DOI:
10.1039/C8RA00245B
(Paper)
RSC Adv., 2018,
8, 8878-8897
Sorption of cationic malachite green dye on phytogenic magnetic nanoparticles functionalized by 3-marcaptopropanic acid†
Received
9th January 2018
, Accepted 15th February 2018
First published on 27th February 2018
Abstract
Phytogenic magnetic nanoparticles (PMNPs) were fabricated using plant leaves' extract of Fraxinus chinensis Roxb. and then, the surfaces of the PMNPs were functionalized by 3-mercaptopropionic acid (3-MPA) to investigate the adsorptive removal of the toxic dye malachite green (MG) from aqueous solutions. The preparation and coating of 3-MPA on the surface of the PMNPs was confirmed and characterized using different techniques, which are UV-visible spectroscopy, Fourier transform infrared spectroscopy (FTIR), X-ray diffractometry (XRD), scanning electron microscopy with integrated energy dispersive X-ray analysis (SEM-EDX), transmission electron microscopy (TEM), X-ray photoelectron spectroscopy (XPS), vibrating sample magnetometry (VSM), Brunauer–Emmett–Teller (BET) analysis and thermogravimetric analysis (TGA). The hysteresis loops of 3-MPA@PMNPs depicted an excellent superparamagnetic nature with saturation magnetization values of 50.95 emu g−1. The prepared material showed the highest adsorptive rate (98.57% MG removal within 120 min) and an estimated comparable adsorptive capacity of 81.2 mg g−1 at 25 °C. The experimental data were well fitted to the Langmuir isotherm, indicating the monolayer adsorption of MG onto 3-MPA@PMNPs. Furthermore, the kinetic data agreed well with the pseudo-second-order model, indicating the removal of MG by chemisorption and/or ion-exchange mechanism. Thermodynamic study confirmed that the adsorption of MG was exothermic and spontaneous. The high adsorptive removal of the dye not only persisted over a wide pH range (6–12), but the material also demonstrated high selectivity in the presence of co-existing ions (i.e. Pd2+ and Cd2+) along with the fastest separation times (35 s) from aqueous solutions. The recovered adsorbent (3-MPA@PMNPs) was reused five times and maintained a removal efficiency of more than 85%. Therefore, the prepared novel 3-MPA@PMNPs can be employed as an alternative low-cost sorbent material for the removal cationic dyes from textile wastewater. In addition, this green nanotechnology/strategy can easily be implemented in low-economy countries for wastewater treatment.
1. Introduction
The level and volume of water pollution is increasing as a result of the discharge of toxic dyes and hazardous waste into the aquatic environment1,2 due to industrialization and urbanization. All types of industries, i.e., pharmaceutical, textile, cosmetic, food and leather are discharging toxic and aromatic pollutants into water bodies without prior and proper treatment.3 Among all these industries, the textile industry primarily uses synthetic or toxic dyes for coloring their products.4 These toxic dyes have harmful effects on the residential communities, i.e., causing skin irritation, heart defects, jaundice, tumours and allergies. Moreover, these dyes have deleterious effects on aquatic life by creating a barrier to the penetration of sunlight for the photosynthesis process.5 Hence, the eradication of these toxic dyes from wastewater prior to discharge is required. However, due to their synthetic origin and complex molecular structure, the removal of dyes is not easy.6 The removal of dyes is primarily dependent on their physical and chemical characteristics in addition to selected treatment alternatives. The effective removal of dyes is still an open challenge for wastewater treatment experts as most of the current technologies are costly and non-ecofriendly.7 Various types of physical, chemical (coagulation, flocculation, electrochemical oxidation, chemical precipitation, ion-exchange, electrodialysis, etc.) and biological (trickling filter, activated sludge system, membrane bioreactors, biosorption, and photo-catalytic degradation) technologies have been employed and in some way optimized for the removal of toxic dyes.1,8 However, the involvement of high installation and operational costs, the production of a large amount of toxic sludge and low kinetics and removal efficiency are the main impediments to extending these technologies for use in low-economy countries.9 In contrast, adsorption technology is assumed to be comparatively much better than the others in terms of its convenient operation, cost effectiveness, design simplicity, high performance and low energy demand.10 In recent years, different types of adsorbents have been fabricated and employed for the elimination of toxic dyes from wastewater, including orange peel,11 rice husk,12 peanut hull,13 coir pith,14 pinewood and jute fiber,15 zeolites, banana pith, ion-exchange resins, red mud and activated carbon and its different composites.1 However, certain features such as slow kinetics, low adsorptive capacity, regeneration and reusability and the involvement of high costs in the preparation and activation of these adsorbents are the main disadvantages. Hence, adsorbents with high adsorptive capacity, easy of separation, regenerability, high reusability and low cost for fabrication are still in demand in the market.
Therefore, presently, metal oxide nanoparticles (NPs) are gaining much attention for the appropriate management of these problems due to their inexpensive and easy manufacturing, high permanence and greater magnetic absorptivity, thus enabling a rapid separation from the final effluents by simply employing an external magnetic field.16,17 These NPs have been used to eliminate and degrade toxic dyes from textile effluents because of their sole physical, chemical and catalytic properties. Further, various types of methods (such as chemical co-precipitation, hydrothermal, sol–gel, micro-emulsion, and electrochemical) have been used for manufacturing metal oxide NPs.1 However, some specific requirements, such as the need for high pressure and temperature, the employment of toxic and hazardous capping and reducing agents to control the size, shape and composition of the metal oxide NPs, the typically long reaction times and the abrasive reaction environments are the major disadvantages in utilizing these synthesis routes.1,2 Moreover, the disintegration/aggregation of these metal oxides-based NPs into chain-like structures is one of the main and well-known limitations and can cause a reduction in their surface area to volume ratio and interfacial free energy, thus deteriorating the NPs reactivity.18 Despite these issues, such aggregation can be controlled by employing diverse organic surfactants or via the employment of various capping ligands.19 However, these stabilization and functionalization routes should be safe, biocompatible, nontoxic and non-immunogenic.1 All such problems can be solved using another approach, viz., green nanotechnology to fabricate the metal oxides-based NPs by utilizing a green strategy.20 Currently, green nanotechnology is attracting much attention as it involves inexpensive, simple and easy manufacturing of green magnetic NPs because plant biomolecules can be utilized as reducing and capping agents at low temperature and pressure instead of toxic and hazardous chemicals.21–23 Moreover, steric stabilization of metal oxides-based NPs against aggregation can be achieved through green fabrication, which would assist in reducing the concerns related to the employment of hazardous chemicals such as sodium borohydride (NaBH4) as a reducing agent because NaBH4 is well-known to have a corrosive and flammable nature. Recently, different types of plants, plant parts and fruit peels have been used for the biosynthesis of green magnetic NPs and their performance to remove different types of water pollutants have been reported.1 In addition, most often, green magnetic NPs have been used for the removal and recovery of heavy metal ions (Cr, Hg, Cd, As and Pd) from aqueous environments.24–30
However, very limited information is available addressing the adsorptive performance of green MNPs to remove toxic dyes.31,32 Despite this fact, different types of green MNPs (prepared by various types of plant extracts) have been utilized for the degradation of toxic dyes, but an adsorptive study is not yet reported. Most often, green MNPs have been used as a catalyst to degrade cationic and anionic dyes, but the removal mechanism is not well reported. Further, changes in the surface properties after the reaction with dyes are not reported. Hence, in order to investigate the adsorptive performance of green MNPs for the removal of toxic dyes, the following core objectives were designed in the present study: (i) to prepare novel phytogenic magnetic nanoparticles (PMNPs) using a plant leaves' extract of Fraxinus chinensis Roxb. as a reducing and capping agent; (ii) to functionalize the as-prepared PMNPs with the 3-mercaptopropionic acid (3-MPA) ligand (henceforth abbreviated herein as 3-MPA@PMNPs) for its possible adsorption of a toxic dye, i.e., malachite green (MG); (iii) to confirm its fabrication and functionalization by employing different techniques, namely, UV-visible, FTIR, XRD, SEM-EDX, TEM, XPS, TGA, BET and VSM; (iv) to investigate the adsorptive performance of 3-MPA@PMNPs in terms of sorption capacity and sorption kinetics; (v) to evaluate the influence of different parameters, including solution pH, temperature and co-existing ions, on the adsorptive performance of 3-MPA@PMNPs; (vi) to employ various isotherms, kinetics and thermodynamic equations for scrutinizing the removal mechanisms; (vii) to develop an appropriate regeneration scheme and subsequently determine the potential reusability of 3-MPA@PMNPs for consecutive treatment cycles as the magnetic study depicted that 3-MPA@PMNPs had a superparamagnetic nature with high saturation magnetization (50.95 emu g−1) values, which should permit fast separation from aqueous solution.
2. Materials and methods
2.1 Materials/chemicals and instruments
The various types of chemicals used in the present study are listed in the ESI (Text-S1†). The molecular structure and chemical properties of the malachite green (MG) dye, which is used in the experiments, are also provided in the ESI (Table S1†). MG is a cationic triphenyl methane dye and is mostly utilized for coloring silk, leather, paper and cotton. A stock solution of 1000 mg L−1 of MG was prepared by adding 1000 mg powder of MG dye into 1000 mL of DI water in a standard volumetric flask. Then, the as-prepared stock solution was used for preparing various concentrations of MG dye solution by employing a standard dilution method (C1V1 = C2V2). The pH of the solution was adjusted using 0.1 mol L−1 NaOH and HCl aqueous solutions throughout all the experiments depending on requirements. Various types of instrumentation used in the present study are listed in the ESI (Text-S2†).
2.2 Methodology
2.2.1 Preparation of Fraxinus chinensis Roxb. leaves' extracts. For fabrication of the PMNPs, the leaves of F. chinensis Roxb. were selected, which is commonly known as ‘Chinese ash’ (a species of flowering tree), whose leaves are commonly used in traditional Chinese medicine (TCM) for dysentery disorders. This genus is widespread across much of Europe, Asia and North America. To the best of our knowledge, in our study, the leaves of F. chinensis Roxb. have been used for the very first time for the fabrication of PMNPs. Its leaves were first collected from a flower market near Ocean University of China, Qingdao, China and washed completely with DI water to remove impurities (dust). Then, the leaves were dried under sunlight for at least 10 days before being placed in a drying oven for 6 h at 85 °C to reduce their moisture content.Finally, these oven dried leaves were chopped into small pieces manually, passed through a 2 mm sieve and the final product was stored for further use in preparation of the extract.
2.2.2 Evaluation of the reducing capacity of the F. chinensis Roxb. leaves' extracts. The reducing ability of the plant extract was investigated using a ferric reducing antioxidant power (FRAP) assay and color development tests as described by Manquián et al.33 and Wei et al.34 (Text-S3†). During the FRAP assay, the ability of the plant extract, to reduce Fe3+ to Fe2+ is measured at an absorbance of λ = 593 nm by producing a blue complex with tripyridyltriazine (TPTZ). In addition, different color development tests were employed to investigate the presence of the probable organic contents in the leaves' extracts that can reduce Fe3+ to Fe2+.34
2.2.3 Evaluation of the total phenolic content (TPC) of the F. chinensis Roxb. leaves' extracts. The presence of phenolic compounds is often considered as an important factor in the formation of green MNPs. This is because it has been reported that phenolic compounds with –OH groups in the ortho position assist in the reduction of metal ions and the construction of green MNPs.35 For this purpose, the Folin–Ciocalteu method was used to investigate the total phenolic content (TPC) in the leaves' extract using gallic acid as the standard as described by Manquián et al.33 (Text-S3†).
2.2.4 Elemental characterization of the F. chinensis Roxb. leaves' extract. The heavy metal contents and elemental contents (i.e. H, N, C and S) of the plant leaves' extract were investigated using an atomic absorption spectrometer (Solaar M6, Thermo Elemental, USA) and elemental analyser (EA, Vario EL cube, German), respectively.
2.3 Fabrication of the PMNPs
For fabrication of the PMNPs, optimized extraction conditions and a fabrication protocol were selected and employed. First, for preparing the plant extract (PE), 10.0 g plant leaves powder of F. chinensis Roxb. was inserted into 80 mL of DI water and then, the mixture was heated at 80 °C for 90 min. The solution pH was adjusted to 3 by dropwise addition of 0.1 mol L−1 NaOH and HCl solution into the mixture. Second, a 1![[thin space (1/6-em)]](https://www.rsc.org/images/entities/char_2009.gif) :
:![[thin space (1/6-em)]](https://www.rsc.org/images/entities/char_2009.gif) 1 metal solution (MS) ratio (Fe2+
1 metal solution (MS) ratio (Fe2+![[thin space (1/6-em)]](https://www.rsc.org/images/entities/char_2009.gif) :
:![[thin space (1/6-em)]](https://www.rsc.org/images/entities/char_2009.gif) Fe3+) was prepared separately by adding 7.321 g FeSO4·7H2O and 7.321 g FeCl3·6H2O into 50 mL of DI water. Then, 50
Fe3+) was prepared separately by adding 7.321 g FeSO4·7H2O and 7.321 g FeCl3·6H2O into 50 mL of DI water. Then, 50![[thin space (1/6-em)]](https://www.rsc.org/images/entities/char_2009.gif) :
:![[thin space (1/6-em)]](https://www.rsc.org/images/entities/char_2009.gif) 50 (v/v) ratio of PE and MS was mixed and heated at 80 °C with continues stirring (at 100 rpm) by a magnetic stirrer heater for at least 60 min. The pH of the mixture was maintained at 12 by adding 0.1 mol L−1 NaOH solution dropwise. The color of the mixture transformed from reddish green to dark black, indicating the formation of PMNPs. Following this, the mixture was allowed to stand for at least 60 min and then, the resultant black colored particles were centrifuged for at least 20 min at 8000 rpm. Subsequently, the supernatant was vacuum-filtered via 0.22 μm filter paper. Then, the collected black particles were cleaned twice using 50 mL of ethanol solution and the final end product was again vacuum-filtered via 0.22 μm filter paper. Finally, the fabricated black particles were kept in a drying oven for at least 20 min at 80 °C.
50 (v/v) ratio of PE and MS was mixed and heated at 80 °C with continues stirring (at 100 rpm) by a magnetic stirrer heater for at least 60 min. The pH of the mixture was maintained at 12 by adding 0.1 mol L−1 NaOH solution dropwise. The color of the mixture transformed from reddish green to dark black, indicating the formation of PMNPs. Following this, the mixture was allowed to stand for at least 60 min and then, the resultant black colored particles were centrifuged for at least 20 min at 8000 rpm. Subsequently, the supernatant was vacuum-filtered via 0.22 μm filter paper. Then, the collected black particles were cleaned twice using 50 mL of ethanol solution and the final end product was again vacuum-filtered via 0.22 μm filter paper. Finally, the fabricated black particles were kept in a drying oven for at least 20 min at 80 °C.
2.4 Fabrication of the 3-MPA@PMNPs
For fabrication of 3-MPA@PMNPs, 5 g powdered PMNPs and 2.35 g 3-MPA were mixed together via ultra-sonication for at least 12 h in 50 mL distilled water at room temperature and the mixture pH was adjusted to 8 by adding 0.1 M NaOH solution dropwise. Then, the collected black particles were washed twice with 50 mL of ethanol solution and the final product was vacuum-filtered via 0.22 μm filter paper. Finally, the fabricated black particles were kept in a drying oven for 20 min at 80 °C. The obtained 3-MPA@PMNPs were further employed in the adsorption experiments.
2.4.1 Characterization of the 3-MPA@PMNPs. The as-prepared 3-MPA@PMNPs were characterized using TEM, FTIR, XPS, XRD, TGA, SEM, EDX/S, VSM and BET techniques. The presence of probable plant biomolecules in the leaves' extract were identified by FTIR, and the coating of 3-MPA was also studied using FTIR (Bruker Vertex 70). The crystalline shape and size of the fabricated 3-MPA@PMNPs were recognized via XRD (Philips Electronic Instruments) analysis and the sample was scanned within the 2θ range of 20–70°. The as-prepared 3-MPA@PMNPs sample was cleaned thoroughly with ethanol prior to the analysis to eliminate the content of NaCl and other impurities that might have crystallized out during the synthesis procedure. Further, SEM (SEM-EDX, JSM-6610 LV, Japan Electronics) and TEM (JEM-2100HR, Japan) analyses were employed to scrutinize the size, shape and morphologies of the as-prepared 3-MPA@PMNPs. The elemental contents were analyzed by EDS/X and XPS (ESCALAB 250, German). The thermal stability of 3-MPA@PMNPs was estimated by TGA, for which a NETZSCH TG 209F3 instrument was employed with a heating rate of 10 °C min−1 in the temperature range of 30–800 °C under nitrogen gas (flow rate, 20 mL min−1). The magnetic measurements of 3-MPA@PMNPs were estimated at 300 K through a VSM (VSM600) by a applying magnetic field of up to 15 kOe. The surface properties of the as-prepared material were determined using the BET (Micromeritics 'ASAP2020) method at 77 K using nitrogen gas.
2.4.2 Measurement of the point of zero charge of the 3-MPA@PMNPs. The point of zero charge pH (pHPZC) of the as-prepared 3-MPA@PMNPs was calculated using the pH drift method.36 In brief, 20 mL of NaCl (0.005 mol L−1) solution was added into several 50 mL bottles of polystyrene. The initial pH (pHi) values of the NaCl solutions were adjusted from 2–13 through dropwise addition of 0.1 mol L−1 solution of HCl and NaOH. Then, 10 mL of NaCl (0.005 mol L−1) solution was added into each bottle to bring the total volume up to 30 mL. The solution (pHi) values were again noted carefully and 0.500 g of dried powdered 3-MPA@PMNPs was added in to each bottle, which was tightly and instantly covered. The suspensions were shaken at 25 °C for 48 h and vacuum-filtered through a 0.22 μm filter paper; the final pH (pHf) values of the supernatant liquid were noted. The value of pHPZC was estimated by plotting a graph of pHi versus (pHf − pHi). Typically, the value of pHPZC is the point where the two curves, namely, the standard pH (pHi vs. pHi) and pHi vs. (pHf − pHi) intersect each other.
2.5 Adsorption and desorption experimental procedures
For the adsorption studies, batch experiments were executed by shaking Erlenmeyer flasks in a thermostat water bath at constant speed (100 rpm) under atmospheric pressure and room temperature (25 ± 2 °C). A stable amount of powdered 3-MPA@PMNPs was added in to 50 mL of dye solution (25–1000 mg L−1). The pH of the dye solution was adjusted to 6.5 unless otherwise stated. First, the dosages of 3-MPA@PMNPs were optimized by varying the initial dosages from 0.1 to 1.5 g L−1 in 50 mL of dye solution (25 mg L−1). The 3-MPA@PMNPs were separated from the final effluents using a simple hand-held magnet at the end of each experiment and then, the effluents were vacuum-filtered through a 0.45 μm filter paper. A UV-vis spectrophotometer was used to observe the final dyes' concentration and the samples' absorbance readings were determined at λmax = 617 nm for MG. For measuring the real dyes concentration, the predetermined standard calibration curves were used. All the experiments were conducted in triplicate and the averaged values were employed to obtain the final value. Finally, the elimination efficiencies were determined as follows:| |
 | (i) |
where Co (mg L−1) is the initial dye concentration in solution and Ct (mg L−1) is the final concentration of the dye solutions at different time intervals.
2.6 Kinetics of dye sorption onto the 3-MPA@PMNPs
For the kinetic studies, a stable amount of 0.500 g L−1 powdered 3-MPA@PMNPs was added in an Erlenmeyer flask containing 50 mL of dye solutions (25–1000 mg L−1). The mixture was placed in a thermostat water bath under atmospheric pressure and room temperature (25 ± 2 °C) by adjusting the shaking speed to 100 rpm. The final dye concentration was measured at the end of 15, 30, 60, 120, 180, 240, 300, 360, 420, 480, 540 and 600 min. All the kinetic experiments were conducted in triplicate and the average values were put into the eqn (i) for calculating the removal efficiency. The sorption kinetics was calculated using five different kinetics models (the equations are given in detail in Text-S5†).
2.7 Sorption isotherm study of the powdered 3-MPA@PMNPs
For the sorption isotherm experiment, the dye solution concentration was altered from 25 to 1000 mg L−1 and a fixed amount of 0.500 g L−1 powdered 3-MPA@PMNPs was inserted in to 50 mL of dye solution. The 3-MPA@PMNPs were separated from the final effluents by the application of a simple hand-held magnet at the end of each experiment and then, the effluents were vacuum-filtered through 0.45 μm filter paper. A UV-vis spectrophotometer was employed to observe the final dyes' concentration and the sample absorbance reading was determined at λmax = 617 nm for MG. For measuring the real dyes concentration, the predetermined standard calibration curves were used. All the experiments were conducted in triplicate and the averaged values were employed to obtain the final value. Finally, the sorption amount was calculated as| |
 | (ii) |
where Co (mg L−1) is the initial dye concentration in the solution and Ce (mg L−1) is the final concentration of the dye solutions at equilibrium.
For investigating the sorption isotherm, four different equilibrium models (Langmuir isotherm, Freundlich isotherm, Temkin isotherm and Dubinin–Radushkevich isotherm) were employed to explain the MG interaction with the 3-MPA@PMNPs (equations given in Text-S6†).
2.8 Evaluation of the influence of different parameters on the adsorptive performance of the 3-MPA@PMNPs
For investigating the influencing factors on the adsorptive performance of 3-MPA@PMNPs, the following operating parameters were examined and varied: the solution pH (2–12), initial MG dye concentration (25–1000 mg L−1), temperature (298.15–333.15 K) dosage (0.1–1.5 g L−1) and contact time (0–600 min).
2.8.1 Thermodynamic study of the powdered 3-MPA@PMNPs. For the thermodynamic studies, 0.500 g L−1 of powdered 3-MPA@PMNPs was added in to 50 mL of dye solution (25 mg L−1). The adsorption performance was calculated at different temperatures of 298.15, 303.15, 313, 323.15 and 333.15 K. The thermodynamic parameters, namely, entropy ΔSo (kJ mol−1), change in free energy ΔGo (kJ mol−1) and enthalpy ΔHo (kJ mol−1) were estimated by employing the equations presented in Text-S7.†
2.8.2 Influence of solution pH on the sorption of the powdered 3-MPA@PMNPs. The effect of solution pH on the sorption performance was investigated in batch mode at different pH values (from 2–12), for which 0.500 g L−1 of powdered 3-MPA@PMNPs was added in to 50 mL of dye solution (25 mg L−1). The pH of the solution was calculated before and after the sorption and the removal efficiencies were measured as follows:| |
 | (iii) |
where Co (mg L−1) is the initial dye concentration in the solution and Ct (mg L−1) is the final concentration of the dye solutions at different time intervals.
2.8.3 Influence of the co-present constituents on the sorption of the powdered 3-MPA@PMNPs. The effect of the co-present constituents on the adsorption performance was also investigated. The presence of heavy metal cationic ions (i.e. Pb2+ and Cd2+) in dye effluents is often documented and these cationic ions can be selective in the adsorptive removal of cationic MG dye. The dye sorption onto 3-MPA@PMNPs was investigated by varying the initial co-existing cationic ions concentration of 1, 5, 25, 50, 100 and 1000 mg L−1, for which 0.300 g L−1 of the powered 3-MPA@PMNPs was mixed in to 50 mL of binary solution containing the heavy metals' cationic ions (Pb2+ or Cd2+) and the MG dye (10 mg L−1).
2.9 Desorption and reusability study of MG dye
2.9.1 Selection of the regeneration solution. For selection of the appropriate regeneration solution, the MG dye was first sorbed onto the surface of 3-MPA@PMNPs by adding 0.500 g L−1 of 3-MPA@PMNPs into 50 mL (25 mg L−1) of MG dye solution. The MG sorbed ions were then desorbed by using 20 mL of various regeneration solutions of different concentrations (HCl: 25 to 100%; methanol: 25 to 100%; NaCl: 0.5 to 3 M; NaOH: 0.5 to 3 M; EDTA: 0.025 to 2 M; combination of 1 M NaCl in methanol solution: 25 to 100%).The following equation was employed to calculate the desorption efficiency:
| |
 | (iv) |
| |
 | (v) |
where
Mdesorbed is the quantity of MG dye sorbed onto 3-MPA@PMNPs,
Msorbed is the amount of MG dye desorbed from 3-MPA@PMNPs,
Co (mg L
−1) is the initial concentration of MG dye in the feed solution,
Ce (mg L
−1) is the MG dye concentration at equilibrium,
V (L) is the volume of feed solution,
Cr (mg L
−1) is the dye concentration in solution after regeneration and
Vt is the volume of the regeneration solution.
2.9.2 Feed-to-regeneration ratio (v/v). For optimization of the feed-to-regeneration ratio (v/v), 0.500 g L−1 of 3-MPA@PMNPs was added into 50 mL of MG dye solution (25 mg L−1) and then, desorption was carried out by adding different volumes of regeneration solution (Table 1).
Table 1 Experimental conditions to investigate the optimum feed-to-regeneration ratio (v/v)
| Process |
Employed solution |
Regeneration volume (mL) |
Feed-to-regeneration ratio (v/v) |
| Sorption–desorption of MG dye |
25 mg L−1 of MG dye and 0.1 M EDTA solution |
50 |
1.0 |
| 40 |
1.3 |
| 32 |
1.6 |
| 20 |
2.5 |
| 10 |
5.0 |
| 5 |
10.0 |
| 2 |
25.0 |
2.9.3 Sorption–desorption cyclic study. To investigate the MG dye removal and the potential of 3-MPA@PMNPs reusability for long-term applications, consecutive sorption and desorption cycles were examined up to ten times. First, 0.500 g L−1 of 3-MPA@PMNPs was added into 50 mL of MG dye solution (at a concentration of 25 mg L−1) and subsequently, 20 mL of 0.1 M EDTA regeneration solution was added for MG dye desorption. In each cycle, the desorbed 3-MPA@PMNPs were completely washed to neutrality using DI and then re-employed for the sorption of MG dye.
3. Results and discussion
3.1 Characterization of the leaves' extracts of the Fraxinus chinensis Roxb.
The aim of the present study was to assess the clean and safe green fabrication of PMNPs by inspecting the heavy metals and elemental contents of F. chinensis Roxb. leaves' extract. Further, the probability of the existence of some specific organic compounds was found by evaluation and estimation of the elemental contents (H, S, C and N). The present study revealed that the elemental contents of the F. Chinensis Roxb. extracts were C (38.6%), N (4.38%), H (4.99%) and S (0.39%). These findings indicate that the existence of S and N might be due to chlorophyll, protein, nucleic acids, methionine and cysteine in the plant leaves' extract. Moreover, negligible contents of heavy metals, namely, Pb (0.07 mg L−1), Cr (0.011 mg L−1), Co (0.013 mg L−1), Fe (0.06 mg L−1), Zn (0.25 mg L−1) and Cd (0.001 mg L−1) were found in the F. chinensis Roxb. leaves' extracts. Thus, the fabrication of PMNPs from these leaves' extracts will be safe/green because they primarily contain organic compounds and only a limited amount of heavy metals. Moreover, they have higher antioxidant capacity (0.047 Fe2+ mmol L−1) and total phenolic content (TPC) (83.3 ± 5.1 GAE CV/g DW) as measured by FRAP and Folin–Ciocalteu methods. These results indicated that these leaves' extracts have higher tendency of reducing compounds, which could be used to manufacture a greater amount of PMNPs. It is clear from the previous studies that plant extracts having higher antioxidant capacity and TPC will have higher potential for producing PMNPs through the reduction of metal ions.34 Similarly, these results were also obtained through color development tests. The findings are shown in Table S2.†
3.2 Conformation and characterization of the 3-MPA@PMNPs
3.2.1 UV-vis spectra and FTIR analysis. The as-prepared PMNPs were first confirmed by the change of color from reddish green to intense black and through UV-vis absorption spectra (Fig. 1). Fig. 1 illustrates that the reaction between MS and PE was very quick and the color of the solution changed from reddish green to intense black. This color transformation occurred probably due to the plant biomolecules (polyphenols, reducing sugars, flavonoids, etc.), which play an important role in the reduction of metal ions. In addition, these biomolecules appropriately stabilize the Fe3O4 NPs for the biosynthesis of PMNPs under alkaline environments (pH 12). Hence, the UV spectra of the newly prepared PMNPs comprised a broad absorption at higher wavelength than PE and there was no incisive absorption at lower wavelengths (Fig. 1, curves a and b). Finally, 3-MPA was incorporated onto the surface of the PMNPs in alkaline medium (pH 8). The preparation of PMNPs and 3-MPA-capped PMNPs or the reactions that might occur during the fabrication can be summarized as follows:
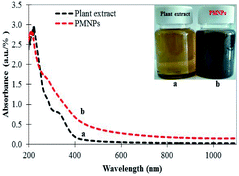 |
| | Fig. 1 UV-vis spectra of plant extract (a) and phytogenic magnetic nanoparticles (PMNPs) (b); inset shows the photographic interpretation of the reaction. | |
Moreover, Fig. 2 shows the FTIR spectra of the plant extract, the fabricated PMNPs, the functionalized PMNPs with 3-MPA and sample of the MG molecules adsorbed onto the as-prepared 3-MPA@PMNPs. The FTIR spectra revealed different peaks in the spectral range of 500–4000 cm−1, attributed to the probable presence of plant biomolecules (polyphenols) on the surface of the PMNPs. The spectrum of Fig. 2a illustrates a broad absorption at 3454 cm−1, attributed the O–H stretching vibrations (polyphenolic group) and it was shifted to 3460 cm−1 in the spectrum of Fig. 2b, where its width might be due to the formation of intra- and inter-molecular hydrogen bonds.32 The peaks at 2935 and 2893 cm−1 are attributed to the O–H and C–H stretching vibrations of carboxylic acid, alcohol or alkene groups (Fig. 2a). A very distinct peak at 1662 cm−1 (Fig. 2a) indicates the existence of C![[double bond, length as m-dash]](https://www.rsc.org/images/entities/char_e001.gif) O or C
O or C![[double bond, length as m-dash]](https://www.rsc.org/images/entities/char_e001.gif) C stretching vibration of acid derivatives, which then shifts to 1639 cm−1 (Fig. 2b). These peaks may hint at the physisorbed or chemisorbed H2O onto PMNPs as previously reported by various researchers.31,32 A slim absorption peak at 1163 cm−1 (Fig. 2a) is attributed to the C–O stretching vibration of esters, which is then shifted to 1114 cm−1 (Fig. 2b) due to the C–O stretching vibration of aliphatic ether or a bond of the glucose ring in the plant leaves' extract. Further, the rapid decline in intensity at 1662 and 1163 cm−1 after the reduction of MS implies the main involvement of –OH groups in this as previously discussed by various researchers.18,32 Finally, a strong absorption band at 630 cm−1 can be attributed to the characteristic band of Fe–O, which suggests the formation of Fe3O4 NPs or PMNPs (as previously reported by Prasad et al.31). Therefore, the FTIR results verified the capping and participation of plant biomolecules (polyphenol, glucose, primary amine, ether, carboxyl, aliphatic, alkene and ester) on the surface of PMNPs through –OH, C–H and C–O functional groups. In addition, the FTIR results also proved the findings achieved from the color development tests (as discussed in the extract characterization section).
C stretching vibration of acid derivatives, which then shifts to 1639 cm−1 (Fig. 2b). These peaks may hint at the physisorbed or chemisorbed H2O onto PMNPs as previously reported by various researchers.31,32 A slim absorption peak at 1163 cm−1 (Fig. 2a) is attributed to the C–O stretching vibration of esters, which is then shifted to 1114 cm−1 (Fig. 2b) due to the C–O stretching vibration of aliphatic ether or a bond of the glucose ring in the plant leaves' extract. Further, the rapid decline in intensity at 1662 and 1163 cm−1 after the reduction of MS implies the main involvement of –OH groups in this as previously discussed by various researchers.18,32 Finally, a strong absorption band at 630 cm−1 can be attributed to the characteristic band of Fe–O, which suggests the formation of Fe3O4 NPs or PMNPs (as previously reported by Prasad et al.31). Therefore, the FTIR results verified the capping and participation of plant biomolecules (polyphenol, glucose, primary amine, ether, carboxyl, aliphatic, alkene and ester) on the surface of PMNPs through –OH, C–H and C–O functional groups. In addition, the FTIR results also proved the findings achieved from the color development tests (as discussed in the extract characterization section).
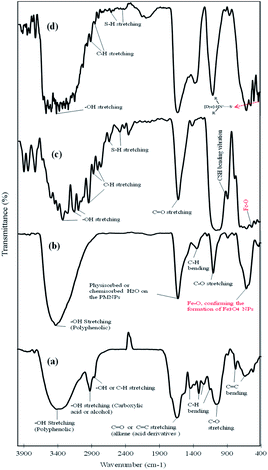 |
| | Fig. 2 Fourier transform infrared spectroscopy (FTIR) spectra of (a) plant extract, (b) fabricated phytogenic magnetic nanoparticles (PMNPs), (c) 3-MPA@PMNPs, and (d) sample of malachite green (MG) adsorbed onto 3-MPA@PMNPs. | |
To understand the nature of the capping/binding of 3-MPA on the surface of PMNPs and its alteration after the sorption of MG molecules, the FTIR spectrum was also studied (Fig. 2, curves c and d). The FTIR spectrum indicates that the as-prepared 3-MPA@PMNPs have five important functional groups (a broad –OH stretching from 3357 to 2962 cm−1, C–H stretching from 2891 to 2812 cm−1, thiol (–SH) at 2659 and 2511 cm−1, carboxylic (–COOH) at 1633 cm−1 and free stretching of –CSH at 898 cm−1). The presence of –SH group and the binding nature of COO− on the surface of PMNPs, confirmed the capping of 3-MPA.37,38 The two peaks at 2659 and 2511 cm−1 are attributed to the vibration of the –SH groups on the surface of PMNPs, which were then shifted to 2632 and 2501 cm−1, indicating the sorption of MG molecules.39
3.2.2 Powder XRD analysis. Further, Fig. 3 illustrates the XRD patterns of PMNPs, 3-MPA@PMNPs and after the sorption of MG onto the 3-MPA@PMNPs. The observed reflections in the XRD profiles are attributed to ferric oxide or haematite (Fe2O3) and iron oxide or magnetite (Fe3O4) in addition to NaCl.40 The prepared PMNPs were highly crystalline and majority of them show an indication of Fe2O3/Fe3O4 NPs, which could clearly be attributed to the cube shape of metallic iron. The XRD spectra demonstrates a series of high intensity characteristic peaks at 2θ = 32.5°, 35.2°, 45.4°, 57.3° and 62.8°, which are associated to (220), (311), (400), (511) and (440) planes of Fe3O4, respectively, as reported in the JCPD reference pattern no. 019-0629.38 The peaks at 2θ = 35.2° and 62.8° principally hint the existence of Fe3O4. The average diameter of the as-prepared PMNPs was determined using the Scherrer equation D = 0.89λ/βcos![[thin space (1/6-em)]](https://www.rsc.org/images/entities/char_2009.gif) θ, where D is the average particle size, λ is the wavelength of the CuKα irradiation, β is the full width at half maximum intensity of the diffraction peak and θ is the diffraction angle at 2θ = 35.2° peak attributed to iron oxide NPs.34 The biosynthesized PMNPs possessed the mean crystallite size of ∼39 nm. Further, the XRD pattern of 3-MPA@PMNPs was also recorded and it was found that the –SH functional group had undergone binding with the fabricated PMNPs. The characteristic peaks at 2θ = 30° and 2θ = 56° indicated the capping of the –SH group with the PMNPs. In addition, the intensity of the characteristic peaks of Fe2O3/Fe3O4 NPs (denoted as “+”) in the patterns also improved, indicating the formation of bonding between the –SH groups and PMNPs.39 This might be due to the presence of a carboxylate group (COO−) on the surface of the PMNPs (as previously confirmed by FTIR analysis). Overall, the XRD results confirmed the formation of PMNPs, the smooth capping of 3-MPA on the surface of PMNPs and the sorption of MG molecules on the 3-MPA@PMNPs (Fig. 3).
θ, where D is the average particle size, λ is the wavelength of the CuKα irradiation, β is the full width at half maximum intensity of the diffraction peak and θ is the diffraction angle at 2θ = 35.2° peak attributed to iron oxide NPs.34 The biosynthesized PMNPs possessed the mean crystallite size of ∼39 nm. Further, the XRD pattern of 3-MPA@PMNPs was also recorded and it was found that the –SH functional group had undergone binding with the fabricated PMNPs. The characteristic peaks at 2θ = 30° and 2θ = 56° indicated the capping of the –SH group with the PMNPs. In addition, the intensity of the characteristic peaks of Fe2O3/Fe3O4 NPs (denoted as “+”) in the patterns also improved, indicating the formation of bonding between the –SH groups and PMNPs.39 This might be due to the presence of a carboxylate group (COO−) on the surface of the PMNPs (as previously confirmed by FTIR analysis). Overall, the XRD results confirmed the formation of PMNPs, the smooth capping of 3-MPA on the surface of PMNPs and the sorption of MG molecules on the 3-MPA@PMNPs (Fig. 3).
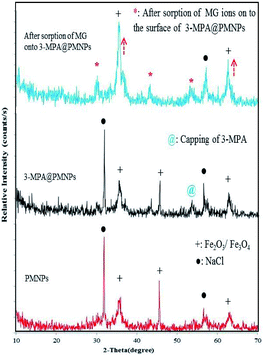 |
| | Fig. 3 X-ray diffractometer (XRD) patterns of phytogenic magnetic nanoparticles (PMNPs), 3-MPA@PMNPs and after the sorption of malachite green (MG) onto the 3-MPA@PMNPs. | |
3.2.3 SEM and EDX/S analyses. The EDX spectrum of the as-prepared 3-MPA@PMNPs was obtained to determine the chemical composition and the presence of 3-MPA on the surface of the 3-MPA@PMNPs (Fig. 4). Fig. 4 shows that the EDX spectra consist of intense peaks of Fe and O in addition to C and S. The C peak of 3-MPA@PMNPs was ascribed principally to the polyphenol groups or other carbon-containing biomolecules present in the PE. These results indicated that the atomic percentages as acquired by EDX quantification were Fe (24.49%), C (24.75%), O (49.02%), C (24.75%) and S (1.74%). The presence of sulfur homogenously distributed throughout the sample indicated the capping of the sulfur-containing ligand (3-MPA) on the surface of the 3-MPA@PMNPs although in a small amount. However, the higher percentages of C (24.75%) hinted the participation of plant biomolecules in the reduction of metal ions and the steadiness of the PMNPs (Fig. 4a). Moreover, these values might be helpful in determining the atomic content on the surface and the near surface region of the as-prepared 3-MPA@PMNPs. For comparison, the EDX spectrum was also studied after the sorption of MG onto the 3-MPA@PMNPs. Overall, the EDX results confirmed the presence of Fe, O, C and S elements in the formation of the 3-MPA@PMNPs.
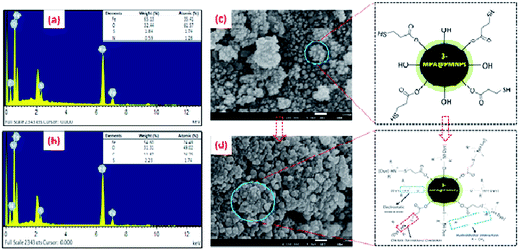 |
| | Fig. 4 Energy dispersive X-ray (EDX) images of 3-MPA@PMNPs (a) before and (b) after sorption of malachite green (MG) dye; scanning electron microscopic (SEM) images of 3-MPA@PMNPs (c) before and (d) after sorption of MG dye. | |
Further, SEM analysis was also carried out to observe the morphology of the fabricated 3-MPA@PMNPs before and after the sorption of MG (Fig. 4). Fig. 4c depicts that the as-prepared 3-MPA@PMNPs were primarily granular, exhibiting a homogenous spherical-shaped structure of Fe3O4 (magnetite) particles with diameters in the range of 30–50 nm. In contrast, Fig. 4d indicates that the granular size increased after the sorption of MG molecules. This increase in size might be due to the attachment of MG molecules onto the surface of 3-MPA@PMNPs. However, the morphology of 3-MPA@PMNPs was almost stable after the sorption of MG molecules, indicating the high stability of the 3-MPA@PMNPs. In addition, the capping of plant biomolecules and the coating of 3-MPA were important for preventing the aggregation of PMNPs and also in enhancing their stability and distribution.
3.2.4 TEM analysis. The size, shape and morphological characteristics of the as-fabricated 3-MPA@PMNPs were elucidated by TEM analysis. The results of the TEM analysis recorded at different scale bars are shown in Fig. 5, which clearly illustrate the formation of magnetite (Fe3O4) NPs and the capping of 3-MPA on the surface of PMNPs. The as-prepared 3-MPA@PMNPs were fine, monodispersed, compact and irregular in shape. Majority of them were cubic, while some of them were spherical in shape. The average diameter of majority of the particles (>85% of 3-MPA@PMNPs) was in the range of 35–55 nm, which is in good agreement with the results obtained from the powder XRD and SEM analyses (Fig. 5). The particles were agglomerated because the 3-MPA ligands interlinked on the surface of PMNPs due to the involvement of –OH (hydroxyl groups) and COO− groups. The surface of the 3-MPA@PMNPs was coated by organic matter from the plant leaves' extracts and the 3-MPA ligands, which played an important role in restraining the aggregation of PMNPs and enhancing their dispersion and colloidal stability. In addition, the presence of high specific surface area and mesoporous structure hinted that a large number of vacant/active sites could exist on the surface of 3-MPA@PMNPs to adsorb heavy metal ions and toxic dyes from an aqueous environment (Fig. 5). Overall, the TEM results clearly depicted the formation of Fe3O4 NPs/PMNPs via the reduction of iron (Fe) ions within the plant leaves' extract and the functionalization of PMNPs by 3-MPA (Fig. 5).
 |
| | Fig. 5 Transmission electron microscopy (TEM) images of 3-MPA@PMNPs: (a) 200 nm scale bar; (b) 100 nm scale bar, and (c) 50 nm scale bar. | |
3.2.5 XPS analysis. Further, XPS spectroscopy was carried out to understand the surface composition and structure of the as-fabricated 3-MPA@PMNPs (Fig. 6). The XPS results clearly demonstrated three major peaks at 710.58/724.6, 529.95, and 284.79 eV, ascribed to Fe 2p, O 1s and C 1s, respectively. In addition, a small peak at 163.5 eV for S 2p also appeared, suggesting the presence/coating of 3-MPA on the surface of the as-prepared 3-MPA@PMNPs (Fig. 6e). High-resolution XPS spectra were also recorded to carefully investigate the structure of Fe3O4 (Fig. 6b and c). Fig. 6b, demonstrates two major peaks at 710.58 and 724.6 eV in the binding energy range of 700–740 eV, which were associated with Fe 2p3/2 and Fe 2p1/2, respectively, indicating the formation or pure Fe3O4 phase. The binding energy resembling Fe 2p3/2 is typical for Fe in iron oxide/Fe3O4. In addition, there is no satellite peak at or around 719 eV, which is a typical characteristic feature for the maghemite phase, i.e., γ-Fe2O3, further indicating the phase purity of Fe3O4.38,41,42 The O 1s spectrum shows a major peak at 529.95 (∼530) eV in addition to a small peak at 532.8 eV. The peak at 529.95 eV can be attributed to the lattice oxygen atoms bonding with Fe (Fe–O), while the peak at 532.8 eV can be assigned to O in the –OH groups of the PMNPs or 3-MPA (Fig. 6c). Moreover, the C 1s profile displays two peaks at 285.7 and 287.6 eV in the binding energy range of 275–305 eV (Fig. 6d). These features indicated the presence of two C atoms with different chemical nature. The main peak at 285.7 eV in C 1s can be assigned to polyphenolic (O–H) or alcoholic (C–O) groups, which might be associated with the capping membrane of organic functional groups onto the PMNPs. Overall, the XPS results combined with the results obtained from EDX, FTIR and XRD analyses clearly confirmed the formation of 3-MPA@PMNPs by the surface functionalization of PMNPs by 3-MPA.
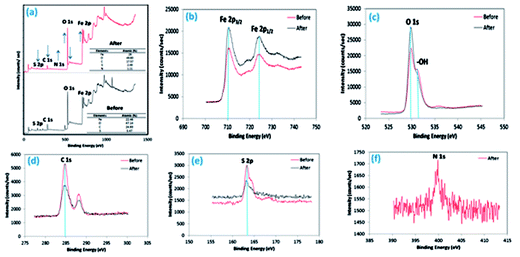 |
| | Fig. 6 (a) X-ray photoelectron spectra (XPS) of 3-MPA@PMNPs (before and after the sorption of MG); (b) high-resolution XPS spectra of Fe 2p (before and after the sorption of MG); (c) high-resolution XPS spectra of O 1s (before and after the sorption of MG); (d) high-resolution XPS spectra of C 1s (before and after the sorption of MG); (e) high-resolution XPS spectra of S 1s (before and after the sorption of MG); (f) high-resolution XPS spectra of N 1s (after the sorption of MG). | |
3.2.6 Thermogravimetric analysis (TGA). The thermal stability and capping structure of the plant biomolecules and/or chemical composition of the 3-MPA@PMNPs was estimated via TGA. The TGA profile depicted two weight loss steps in the tested temperature range of 0–800 °C (Fig. 7). The first weight loss (2.53%) appeared in the temperature range of 28–203.3 °C, indicating the removal of water or residual solvent, physisorbed and chemisorbed H2O molecules in the sample.41,42 The second major weight loss (17.31%) occurred at 203.3–597.6 °C, suggesting the elimination or decomposition or loss of capping biomolecules and 3-MPA.38,39 Further, no weight loss was noticed above 600 °C and 80.16% weight residue of 3-MPA@PMNPs remained. The TGA results suggest that about 17% of the (plant biomolecules + 3-MPA) coating/capping was observed on the surface of 3-MPA@PMNPs and it possessed high thermal stability.
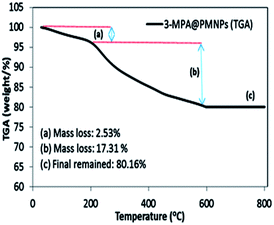 |
| | Fig. 7 Thermogravimetric analyzer (TGA) plot or curve of the 3-MPA@PMNPs. | |
3.2.7 Magnetic measurements. The magnetic nature is primarily dependent on the size, shape and morphology of the prepared material, which are significantly influenced by the fabrication protocol. A vibrating sample magnetometer (VSM) study was employed to obtain the hysteresis loop of 3-MPA@PMNPs at a temperature of 300 K by applying a magnetic field from −15 to +15 kOe (Fig. 8). The absence or value of the remanent magnetization (Mr) and coercivity (Hc) was zero, suggesting the superparamagnetic nature of the 3-MPA@PMNPs, while the value of saturation magnetization (Ms) was 50.95 emu g−1. The lower value of Ms compared to Ms for bulk Fe3O4 (93 emu g−1) could be due to the increase in surface area or due to reactions among the coating agent and PMNPs. Similarly, the reduction in Ms values have also been reported by other researchers for green MNPs.26,28,29,41,42 In addition, Fig. 8b demonstrates that the as-prepared 3-MPA@PMNPs can easily be separated from solution within a few seconds with the help of a permanent hand-held magnet. Therefore, for improving the operational efficiency and to keep the treatment costs economically feasible, this material is perceived to be incredibly prerequisite for water/wastewater treatment process. In addition, the as-prepared material can be reused for consecutive treatment cycles and recovery of the metal ions can also be achieved.
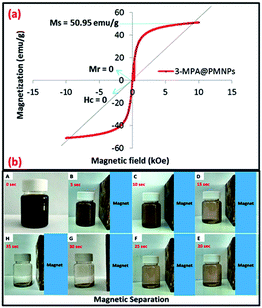 |
| | Fig. 8 (a) M–H hysteresis loop/vibrating sample magnetometer (VSM) measurements of 3-MPA@PMNPs at a temperature of 300 K; and (b) magnetic separation study of 3-MPA@PMNPs using a simple hand-held magnet (distant between the magnet and sample was 5 cm). | |
3.2.8 BET analysis. The surface properties of the 3-MPA@PMNPs, such as the surface area, total pore volume, pore radius and pore size were also examined using BET surface area analysis.The surface area is most often assumed to be important property of any material and can disclose imperative information about its adsorption properties. A higher surface area is mostly desired over lower surface area for affording high sorption capacity. A greater number of small sized pores is organized due to high surface area in a controlled volume. Similarly, the pore size of the material is an important factor that can reveal the adsorption ability of pollutants onto a particles' surface. N2 adsorption–desorption method was employed to determine the surface properties of the as-prepared 3-MPA@PMNPs. The obtained isotherms show a hysteresis loop of different intensities correlated with the type IV isotherm model with H4-type hysteresis loop as classified by IUPAC. The hysteresis loops were generated at relative pressures between 0.46 and 0.99, evoking the mesoporous feature of the sample. The specific surface area of the material was 115.42 m2 g−1 as determined by the BET method. Surprisingly, the specific surface area of 3-MPA@PMNPs was much better than most of the previously reported green MPNs.6–10,28,29,37,41,42 The Barrett–Joyner–Halenda (BJH) model was used to calculate the average pore size and total pore volume. The results indicated that the average pore radius of the material was 17.052 nm (the pictorial representation of the size distribution is shown in the inset of Fig. 9). The total volume of the pores was determined by the single-point adsorption value at P/Po = 0.9989, which gave a value of 0.238 cm3 g−1, indicating the loose mesoporous structure of the sample. Overall, the as-prepared material was mesoporous and can assist the diffusion of pollutants. In addition, it can also facilitate the adsorptive removal of toxic dyes and the separation of metal ions from the environment.
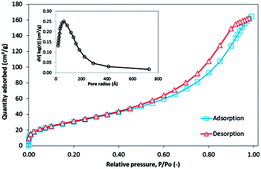 |
| | Fig. 9 N2 adsorption–desorption isotherm at (77 K); pore size distribution (inset) of the 3-MPA@PMNPs. | |
4. Evaluation of the influence of different parameter on the adsorptive performance and properties of 3-MPA@PMNPs for the removal of malachite green (MG)
4.1 Effect of adsorbent dosage
To investigate the optimum amount of adsorbent for enhancing the interactions between MG ions and the adsorption sites of adsorbent, different amount of 3-MPA@PMNPs dosages (0.1–1.5 g L−1) were mixed in 50 mL of MG dye solution (25 mg L−1) for 24 h. The findings indicated that a maximum removal efficiency of 87.5% was achieved at the lowest adsorbent dosage. Subsequently, the removal efficiency increased from 87.5 to 98.57% on increasing the dosages from 0.1 to 0.5 g and later, it was almost stable (Fig. 10). This increase in removal efficiency might be due the increase in the availability of larger vacant or active sites on the adsorbents or the presence of higher surface area for MG ions. However, beyond the dosage of 0.5 g, the removal efficiency was very low or almost plateaued, indicating the equilibrium between MG solution and adsorbents. Hence, 0.5 g of adsorbent dosage was selected for further studies.
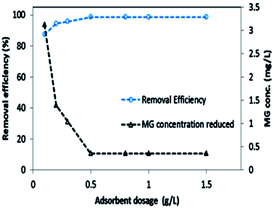 |
| | Fig. 10 Effect of adsorbent dosage on the removal of malachite green (MG) dye by 3-MPA@PMNPs (dosage = 0.1–1.5 g L−1; Co = 25 mg L−1; contact time = 24 h). | |
4.2 Influence of solution pH on sorption
The influence of solution pH on the removal efficiency of MG was assessed in the range of pH 2–12 because the pH of the solution can influence on the binding sites and chemical interaction by altering the ionization state of the functional groups present on the surface of 3-MPA@PMNPs. Initially, the removal efficiency slowly increased from 48 to 93.57% in the pH range of 2–6 and then increased from 93.57 to 98.57% in the pH range of 6–10. Then, it reached up to 100% in the pH range of 11–12 (Fig. 11b). The sorption of MG cationic dye onto 3-MPA@PMNPs surface was primarily associated with the surface charge on the adsorbent, which could be influenced by the variation of solution pH. This behaviour can be observed because the pHPZC of 3-MPA@PMNPs was 5.19 (Fig. 11a) and the surface of 3-MPA@PMNPs was negatively charged at pH > pHPZC, which endorsed the sorption of MG cationic ions onto 3-MPA@PMNPs. However, at lower pH (when pH < pHPZC), the surface of 3-MPA@PMNPs was positively charged, thus increasing electrostatic repulsion among cations of MG ions and the presence of excess H+ ions in the solution. Furthermore, the positively charged surface of 3-MPA@PMNPs inhibited the sorption of the cationic MG ions. Hence, above pH 5.19, the MG removal efficiency increased from 59 to 98.75% because pH > pHPZC, while below pH 5.19, MG removal efficiency was low due to the repulsion among cations, indicating that by lowering solution pH, the number of negatively charged sites decreases and the number of positively charged sites increases. Moreover, the light absorption of MG before and after reaction with 3-MPA@PMNPs at different pH is shown in Fig. 12a–d.
 |
| | Fig. 11 (a) Point of zero charge (pHPZC) of 3-MPA@PMNPs. (b) Effect of solution pH on the removal efficiency of malachite green (MG) onto 3-MPA@PMNPs. Interval of pH: 2–12; initial dye concentration: 25 mg L−1; dosage: 0.5 g L−1; solution volume: 50 mL; temperature: 25 °C; agitation time: 120 min. | |
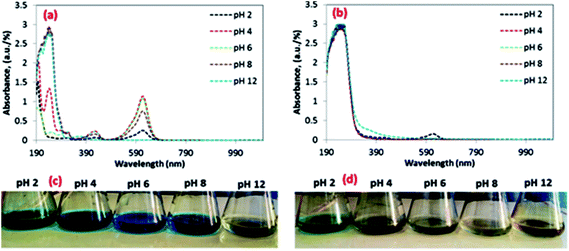 |
| | Fig. 12 Study of the light absorption of malachite green (MG) at different pH: (a) before and (b) after the reaction with 3-MPA@PMNPs/adsorbent; real photographic interpretation of MG solution at different pH: (c) before and (d) after the reaction with 3-MPA@PMNPs/adsorbent [initial dye concentration: 25 mg L−1; dosage: 0.5 g L−1; solution volume: 50 mL; temperature: 25 °C; agitation time: 120 min]. | |
4.3 Kinetics of dye sorption onto the 3-MPA@PMNPs
In order to investigate the kinetics of dye sorption onto the 3-MPA@PMNPs, the effect of contact time on MG adsorption was observed using a fixed amount of adsorbents (0.500 g L−1) at different initial concentrations of MG dye (25–1000 mg L−1). Fig. 13a indicates that the adsorption kinetic curves rapidly increased and then reached a plateau. The equilibrium adsorption time was different for the different concentrations of MG dye. The rapid adsorption of MG dye at different concentrations can be attributed to the availability of a large number of active/vacant surface sites for fresh 3-MPA@PMNPs, which then slowly decreased during the adsorption process until equilibrium was attained. This decrease in MG dye sorption rate might be due to the slow pore diffusion of MG ions into the bulk of 3-MPA@PMNPs. On average, fast adsorption rate was achieved within 60 min of contact time, while at 120 min, the adsorption equilibrium was attained along with 98.57% of MG dye removal efficiency and at equilibrium, the maximum adsorptive capacity of 81.2 mg g−1 was achieved. This fast adsorption of MG ions onto 3-MPA@PMNPs can also be assigned to a synergistic complex formed between MG ions and the –SH functional groups attached on the surface of 3-MPA@PMNPs, which was formerly confirmed by XPS and FTIR. For exploring the sorption mechanism and to calculate the kinetic parameters of MG dye adsorption onto 3-MPA@PMNPs, various adsorption kinetic models were employed. It is assumed that different independent processes may be involved in controlling sorption kinetics during the adsorptive removal of pollutants, which can be performed in series or parallel, for instance, (a) bulk transport, (b) film diffusion/external mass transfer, (c) intraparticle diffusion, (d) chemisorption/chemical reaction. For this purpose, various kinetic models, including pseudo-first-order, pseudo-second-order, Elovich, intraparticle diffusion/Weber and Morris and liquid film diffusion, were employed to fit the experimental data. The obtained results of these fits are summarized in Table 2.
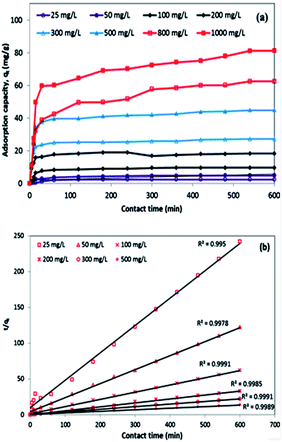 |
| | Fig. 13 (a) Kinetics of malachite green (MG) dye sorption onto 3-MPA@PMNPs (dosage = 0.5 g L−1); (b) linear plot of the pseudo-second-order model of MG dye sorption onto 3-MPA@PMNPs (dosage = 0.5 g L−1). | |
Table 2 Kinetic parameters for the adsorption of malachite green (MG) onto 3-MPA@PMNPs at different initial concentrations of MGa
| Co (mg L−1) |
qe (exp.) (mg g−1) |
Pseudo-first-order kinetic model 
|
Pseudo-second-order kinetic model 
|
Elovich kinetic model 
|
Intraparticle diffusion/Weber and Morris kinetic model qt = kipdt0.5 |
Liquid film diffusion kinetic model ln(1 − F) = −kfdt |
| K1 (min−1) |
R2 |
K2 (min−1) |
h (mg g−1 min−1) |
R2 |
α (mg g−1 min−1) |
β (g mg−1) |
R2 |
Kipd (mg g−1 min−0.5) |
I |
R2 |
Kfd (g mg−1) |
I |
R2 |
| qe (exp.): experimental qe (mg g−1); qe (cal.): calculated qe (mg g−1); I: intercept; Co: initial concentration of the pollutant (mg L−1); h: initial adsorption rate constant (mg g−1 min−1); k1 & k2: equilibrium rate constants for pseudo-first and pseudo-second order kinetic models (min−1); R2: regression coefficient; α = adsorption rate constant; β = desorption rate constant; Kfd = film diffusion rate constant (g mg−1); kipd = intraparticle diffusion rate constant (mg g−1 min−0.5). |
| 25 |
2.47 |
−0.0018 |
0.19 |
0.38 |
0.49 |
0.99 |
0.49 |
0.46 |
0.91 |
1.10 |
0.52 |
0.76 |
−0.025 |
−1.57 |
0.09 |
| 50 |
4.91 |
−0.0025 |
0.41 |
0.19 |
0.98 |
0.99 |
0.98 |
0.84 |
0.95 |
2.19 |
1.31 |
0.79 |
−0.021 |
−1.13 |
0.16 |
| 100 |
9.69 |
−0.0029 |
0.46 |
0.10 |
1.93 |
0.99 |
1.93 |
1.53 |
0.90 |
4.33 |
3.56 |
0.68 |
−0.033 |
−1.14 |
0.14 |
| 200 |
18.36 |
−0.0012 |
0.10 |
0.05 |
3.66 |
0.99 |
3.66 |
2.22 |
0.74 |
8.18 |
10.52 |
0.45 |
−0.139 |
−2.17 |
0.0003 |
| 300 |
27.22 |
−0.0021 |
0.65 |
0.03 |
5.44 |
0.99 |
5.44 |
3.30 |
0.79 |
12.16 |
14.62 |
0.52 |
−0.123 |
−1.80 |
0.031 |
| 500 |
44.89 |
−0.0024 |
0.82 |
0.02 |
8.96 |
0.99 |
8.96 |
6.31 |
0.85 |
20.03 |
19.56 |
0.61 |
−0.051 |
−1.52 |
0.048 |
| 800 |
62.57 |
−0.0028 |
0.96 |
0.01 |
12.5 |
0.99 |
12.5 |
9.78 |
0.97 |
27.95 |
17.17 |
0.83 |
−0.035 |
−0.94 |
0.111 |
| 1000 |
81.29 |
−0.0031 |
0.79 |
0.01 |
16.24 |
0.99 |
16.2 |
12.45 |
0.93 |
36.31 |
25.02 |
0.75 |
−0.029 |
−0.75 |
0.342 |
According to Fig. 13b and the regression coefficient values (R2 = 0.99) in Table 2, it is suggested that MG dye adsorption on the 3-MPA@PMNPs could be successfully described by a pseudo-second order, indicating the presence of chemisorption and/or ion-exchange mechanism.7 Similarly, the values of k2 were lower than those of h (Table 2), indicating fast sorption of MG dye initially, followed by slow adsorption. The values of α were higher than those of β (Table 2), indicating that the as-prepared 3-MPA@PMNPs had higher adsorption rate than desorption. The regression coefficient values (R2) were greater than 0.90, indicating the applicability of this model. To check the diffusion mechanism between MG dye and the 3-MPA@PMNPs, Weber and Morris' kinetic equation was used. In general, this model is used to check the following steps that might occur in the adsorption process: (a) bulk diffusion; (b) film diffusion; (c) intraparticle diffusion; (d) chemical reaction via ion-exchange or the sorption of pollutants at an active/vacant site on the adsorbent's surface. The values of kipd increased (from 1.10 to 36.31 mg g−1 min−0.5), while the regression coefficient (R2) poorly correlated with the experimental data (Table 2). As shown in Fig. 14, the graph line could not pass through the origin, indicating the non-applicability of the intraparticle diffusion model. However, it can be observed that the curves can be subdivided into multi-linear plots, which indicated that more than one process (like boundary layer adsorption) might be involved in the sorption of MG dye onto 3-MPA@PMNPs (Fig. 14). For instance, initially, there is a fast sorption of MG dye onto 3-MPA@PMNPs, indicating the existence of a large amount of fresh active/vacant sites on the surface of 3-MPA@PMNPs. Similarly, the kipd values also grow with the enhancement of MG dye concentration in the solution, indicating that first the MG ions occupy the exterior vacant sites and then, these ions seek to enter into the pores of the adsorbents. Hence, initially, the sorption capacity was high and then, slowed down gradually to reach equilibrium. Moreover, the values of the intercept also increased, which indicated the boundary layer diffusion effect because of the MG molecules entering into the pores of 3-MPA@PMNPs. Consequently, it can be stated that MG dye sorption onto 3-MPA@PMNPs was convoluted because of the presence of both surface adsorption (chemisorption/ion-exchange mechanism) and boundary layer adsorption or intraparticle diffusion. Finally, to confirm the film diffusion mechanism, the liquid film diffusion kinetic model was employed to correlate with the experimental data. The values of the intercept and kfd are listed in Table 2. Although the straight line of the graph did not pass through the origin, only a slight deviation is observed. This deviation might be due to the presence of rapid mixing during the batch sorption experiments, which can create a discrepancy between the rates of mass transfer in the initial and final stages. In addition, it can be assumed that film diffusion mechanism is not the rate limiting step due to the presence of hydrophilic functional groups (R = CH3) in MG dye. Hence, according to the sorption kinetic studies and fitting of the experimental data to the pseudo-second-order model, we can infer that the sorption of MG dye onto 3-MPA@PMNPs was primarily due to chemisorption and/or ion-exchange mechanism. In addition, the multi-layer plots in the intraparticle diffusion kinetic model indicate the presence of boundary layer diffusion, which might be due to the entering of MG ions into the pores of 3-MPA@PMNPs/adsorbents.
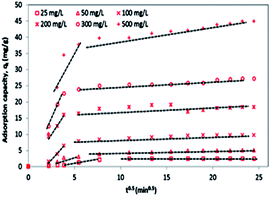 |
| | Fig. 14 Intraparticle diffusion kinetic model fit for the malachite green (MG) dye sorption onto 3-MPA@PMNPs (dosage = 0.5 g L−1). | |
4.4 Sorption isotherm study
For investigating the sorption isotherm, four different equilibrium models (Langmuir isotherm, Freundlich isotherm, Temkin isotherm and Dubinin–Radushkevich isotherm) were employed to explain the MG interaction with the as-prepared 3-MPA@PMNPs. The calculated values of the isotherm constants for the adsorption of MG onto 3-MPA@PMNPs are listed in Table 3. The value of R2 (linear regression correlation coefficient) was determined as an indication of the best fitting of the different models. According to the findings, the Langmuir model gave the best fit to the experimental data of MG dye since it showed higher R2 (0.92) value than the other isotherm models (Fig. 15). Moreover, the range of KL values for MG was 0.14–0.99, indicating that sorption is favourable. These findings suggested the monolayer MG sorption onto homogenous sites of 3-MPA@PMNPs. The estimated maximum sorption capacity for MG dye using the Langmuir model was 81.2 mg g−1 (Table 3).
Table 3 Isotherm constants for the adsorption of malachite green (MG) onto 3-MPA@PMNPsa
| Isotherm models |
Equations |
Parameters |
Values |
| qmax: maximum monolayer adsorption capacity of adsorbent; b: constant related to binding energy; KL: dimensionless constant; n: adsorption intensity; Kf: empirical constants relative adsorption capacities of the adsorbent; KT: the equilibrium binding constant presenting maximum binding energy; BT: constant is related to the heat of adsorption; E: average energy; β: activity coefficient; ε Polanyi potential. |
| Langmuir isotherm model |
 |
qmax (mg L−1) |
81.29 |
| b (L mg−1) |
0.0308 |
 |
KL |
0.14–0.99 |
| R2 |
0.92 |
| Freundlich isotherm model |
 |
1/n |
0.5877 |
| Kf (mg L−1) |
0.5712 |
| R2 |
0.90 |
| Temkin isotherm model |
 |
KT (L g−1) |
3.5395 |
| BT (kJ mol−1) |
26.08 |
| R2 |
0.84 |
| Dubinin–Radushkevich isotherm model |
ln![[thin space (1/6-em)]](https://www.rsc.org/images/entities/char_2009.gif) qe = ln qe = ln![[thin space (1/6-em)]](https://www.rsc.org/images/entities/char_2009.gif) qm − βε2 qm − βε2 |
qmax (mg L−1) |
81.2 |
| E (kJ mol−1) |
0.39 |
 |
β (mol2 J−2) |
3.28 |
| R2 |
0.24 |
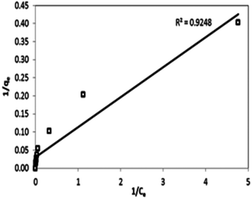 |
| | Fig. 15 Linear plot of the Langmuir isotherm model for malachite green (MG) dye sorption onto 3-MPA@PMNPs (dosage = 0.5 g L−1). | |
4.5 Thermodynamic studies
The negative values of ΔGo indicated the thermodynamically feasible spontaneous nature of the MG sorption onto 3-MPA@PMNPs. However, the values of ΔGo decreased with an increase in temperature, suggesting a lower feasibility of sorption at high temperature (Table 4). The value of enthalpy of sorption (ΔHo) was found to be −105.5 kJ mol−1 for MG, indicating the exothermic nature of sorption at 298.15–333.15 K. In general, the enthalpy or heat of sorption ranging between 2.1 and 20.9 kJ mol−1 is associated with physical sorption, while that ranging from 20.9 to 418 kJ mol−1 is associated with chemical sorption. Hence, the value of (ΔHo) suggests that the sorption of MG dye onto the 3-MPA@PMNPs occurred primarily due to chemisorption and/or ion-exchange mechanism as earlier demonstrated in the kinetic and isotherm studies. The value of entropy (ΔSo) was estimated to be −18.84 kJ mol−1 for MG and this negative value suggested a decrease in randomness/adsorbed species' degree of freedom at the solid/solution interface during the entire sorption process. A slight increase in adsorption capacity (2.44 to 2.49 mg g−1) was noticed on increasing the temperature from 298.15 to 333.15 K, while the MG removal efficiency was almost stable (Fig. 16). This can be attributed to the creation of new vacant/active sites on the adsorbent or the increased rate of pore diffusion. This fact also confirmed that the chemisorption and/or ion-exchange mechanism was involved in the adsorptive removal of MG onto the 3-MPA@PMNPs.
Table 4 Thermodynamic parameters for the adsorption of malachite green (MG) onto 3-MPA@PMNPs at different temperatures (K)a
| Temperature (K) |
ΔGo (kJ mol−1) |
ΔHo (kJ mol−1) |
ΔSo (kJ mol−1 K−1) |
| ΔGo: change in free energy; ΔHo: enthalpy; ΔSo: entropy. |
| 298.15 |
−3615.642778 |
−105.5 |
−18.84 |
| 303.15 |
−5313.461504 |
| 313 |
−6516.542116 |
| 323.15 |
−8637.285988 |
| 333.15 |
−10068.12067 |
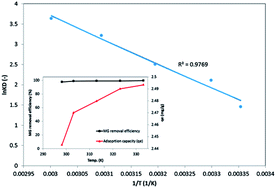 |
| | Fig. 16 Thermodynamic plot for the sorption of malachite green (MG) dye sorption onto 3-MPA@PMNPs (dosage = 0.5 g, Co = 25 mg L−1); inset graph shows the effect of temperature on the adsorptive removal and capacity of MG dye. | |
4.6 Proposed removal mechanism
The indications obtained from the isotherm, kinetics and thermodynamic studies were further ensured by employing FTIR, XRD, SEM, EDX and XPS analysis techniques to explore the probable removal mechanism of MG ions by 3-MPA@PMNPs. Although it was noticed that the 3-MPA ligand played an important role in the removal of MG ions, the exact mechanism is not clear yet. In the FTIR spectrum, after the sorption of MG, a new peak appeared at 435 cm−1, indicating the bonding between –SH and cationic ions of MG (e.g. [Dye]–2RN+⋯S−). The stretching vibrations of C–H (methyl groups) were also reduced, indicating the sorption of MG molecules on the surface of 3-MPA@PMNPs. This might be due to the presence of hydrophobic interactions between (CH3–CH3). Similarly, the stretching vibration of (–OH) functional groups were also altered and reduced, indicating the sorption of MG molecules with O–H via electrostatic interactions (e.g. [Dye]–2RN+⋯O−). Overall, the FTIR results confirmed the sorption of MG ions onto 3-MPA@PMNPs via bonding between S–H and O–H functional groups (Fig. 2d). The XRD pattern of 3-MPA@PMNPs was also studied after the sorption of MG molecules and it was observed that the cationic ions of MG were adsorbed onto 3-MPA@PMNPs. The intensity of the characteristic peaks at 2θ = 30°, 2θ = 35.2°, 2θ = 56° and 2θ = 62° were affected, indicating the sorption of MG molecules on the surface of 3-MPA@PMNPs. Moreover, a new peak appeared at 2θ = 44°, which was attributed to the sorption of MG molecules (Fig. 3). The atomic percentages of Fe, O, S and N obtained for 3-MPA@PMNPs after the sorption of MG were 35.41%, 61.57%, 1.74% and 1.28%, respectively. The presence of N element may indicate the bonding of positively charged nitrogen atoms of MG molecules with negatively charged oxygen and sulfur atoms of 3-MPA@PMNPs (Fig. 4b). In contrast, the SEM image in Fig. 4d indicates that the granular size is improved after the sorption of MG molecules. This increase in size might be due to the attachment of MG molecules on the surface of 3-MPA@PMNPs. Moreover, the morphology of 3-MPA@PMNPs was almost stable after the sorption of MG molecules, indicating the high stability of 3-MPA@PMNPs. In addition, the capping of plant biomolecules and the coating of 3-MPA were important for preventing the aggregation of PMNPs and enhancing their stability and distribution.
Moreover, the XPS spectra of 3-MPA@PMNPs were also recorded after the sorption of MG molecules onto 3-MPA@PMNPs and they indicated that the peak at 163.5 eV for S 2p shifted to higher intensity and the bending energy slightly decreased from 163.5 to 163.2 eV (Fig. 6e). This may suggest that thiol/sulfonic groups attached onto 3-MPA@PMNPs are affected due to the interaction with cationic MG ions. Moreover, the peak at 532.8 eV for (–OH) functional groups attached onto 3-MPA@PMNPs was reduced after the interactions with MG (Fig. 6c). This may show the contribution of –OH functional groups in the removal of MG via ion-exchange or chemisorption. In addition, a new peak at 399.8 eV for N 1s appeared during the high-resolution XPS investigation, confirming the sorption of MG on the surface of the as-prepared 3-MPA@PMNPs (Fig. 6f). This may indicate that the adsorption of MG molecules were also involved in the chelation of cationic MG ions by the –SH groups attached to the surface of 3-MPA@PMNPs. Therefore, the availability of the XPS peaks for O 1s, S 2p and N 1s and their variations clearly indicate the sorption of MG molecules on the surface of 3-MPA@PMNPs. In addition, the data obtained from the XPS spectra are well fitted with the FTIR, EDX, SEM and XRD results.
Overall, the data obtained from the kinetic, isotherm, thermodynamic, FTIR, EDX, SEM, XRD and XPS studies along with the confirmation that the MG dye and functional groups on 3-MPA@PMNPs are oppositely charged indicate that ion-exchange might be the governing adsorptive removal mechanism of MG onto 3-MPA@PMNPs. For example, in aqueous solution, the MG dye molecule ionizes as
| [Dye]–2RNCl → [Dye]–2RN+ + Cl− |
where R = CH
3.
This ionized MG dye molecule then exchanges with the hydrogen ions initially attached to the –OH (hydroxyl) and –SH groups of 3-MPA@PMNPs. The cationic ions of MG dye are primarily coordinate with –OH groups due to electrostatic interaction. However, the formation of a chelate also appeared due to bonding of the cationic ions of MG with –SH groups. In addition to the electrostatic interaction, hydrophobic interaction might occur due to the presence of hydrophobic functional groups (i.e. R = CH3) in the MG dye molecules (Fig. 17). The possible interaction of cationic MG ions with the functional groups of 3-MPA@PMNPs is explained using in the equations below:
| [Dye]–2RN+ + −OH+-[3-MPA@PMNPs] → [Dye]–2RN+⋯−O-[3-MPA@PMNPs] + H+ |
| [Dye]–2RN+ + −SH+-[3-MPA@PMNPs] → [Dye]–2RN+⋯−S-[3-MPA@PMNPs] + H+ |
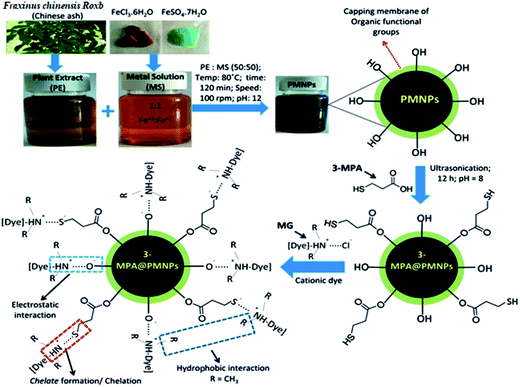 |
| | Fig. 17 Schematic of 3-MPA@PMNPs fabrication and the proposed adsorptive removal mechanism of malachite green (MG) onto 3-MPA@PMNPs. | |
4.7 UV-vis spectra analysis
Before treatment, the UV-vis spectra MG solution showed major peaks at 308, 415, and 613 nm (Fig. 18). Then, initially, the intensity of the major peaks reduced rapidly within a contact time of 15 min, which subsequently decreased approximately in proportion to each other within the contact time of 120 min and then almost disappeared at the stage of equilibrium (Fig. 18). This indicates that the initial sorption rate was high due to the presence of a large amount of vacant/active sites on the surface of the 3-MPA@PMNPs and that the adsorbents attracted most of the cationic MG ions and some of the MG molecules.9 This change in peaks indicated that the MG molecules were significantly sorbed onto the surface of the 3-MPA@PMNPs. Finally, the adsorbents were separated from solution within 35 s using a simple magnet because 3-MPA@PMNPs had a high magnetic power due to the presence of Fe3O4/Fe2O3 (Fig. 18). Similar findings were reported by other researchers.43,44 In addition, the concentrations of total organic carbon (TOC) and total nitrogen (TN) were determined and it was noted that the concentrations of TOC and TN were significantly reduced (48.5 to 2.58 mg L−1 for TOC and 86.26 to 12.5 mg L−1 for TN) after sorption.
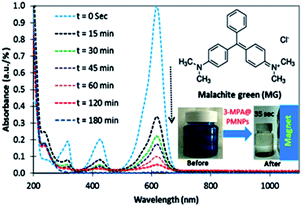 |
| | Fig. 18 Study of the adsorptive removal of MG via UV-vis spectra [inset figures show the chemical structure of MG dye and the condition of MG solution before and after treatment with 3-MPA@PMNPs] (adsorbents dosage = 0.5 g L−1). | |
5. Desorption and reusability studies of 3-MPA@PMNPs
The stability, recovery and reusability of an adsorbent are often considered as an important attribute for making adsorption technology technically more viable and economically feasible for commercial and industrial applications. For this purpose, this study was designed to select a suitable regeneration solution and optimum volume of regeneration solution for 3-MPA@PMNPs. Finally, the reusability for consecutive treatment cycles was investigated. First, various types of regeneration solutions were employed for achieving the maximum replenishment of the 3-MPA@PMNPs (Fig. 19). The results and underlying conditions for each regeneration solution are summarized in Fig. S1–S6.† In brief, salt (NaCl), organic solvent (methanol), and basic (NaOH) and acidic (HCl and EDTA) solutions were utilized to desorb the cationic ions and to recover the adsorbent. Initially, the desorption efficiency increased to 13% using 1 M NaCl and then started decreasing on increasing the salt concentration. This might be due to the ‘salting out effect’ because the solubility of dyes falls on enhancing the salt concentrations in the solution.45 This incomplete desorption presented a clue that other forces (hydrophobic interactions) along with ion-exchange might be involved between the MG dye ions and adsorbents. Thus, an organic solvent (methanol) was selected and used to disconnect these additional forces, but it was ineffective at desorbing dye ions from the adsorbent, indicating the co-presence of other forces (ion-exchange and/or chemisorption and strong bonding between the –SH group on the adsorbents and the cationic ions of MG dye) along with hydrophilic interactions.46 Similar results were obtained via applying basic solution (NaOH). For making regeneration solution economically feasible, a combination of salt and organic solvents was also tested to desorb dye ions from the adsorbents. The findings indicated that this combination was effective, but not up to the mark to achieve the complete desorption of MG dye from the adsorbent, hinting that (salt + organic solvent) may help diminish the hydrophobic interactions and electrostatic interaction by exchanging Na+ with the sorbed MG dye molecules. At this stage, the data obtained by applying different types of regeneration solutions suggest that the overall sorption of MG dye onto 3-MPA@PMNPs might be due to the combination of three types of interactions: ion-exchange/electrostatic interaction, hydrophobic interaction and strong bonding of –SH group with MG dye ions. In addition, the MG molecule has a cationic nitrogen atom (N+) at only one of its terminal ends along with two methyl groups, while there are three aromatic rings, among which one is attached with a nitrogen atom along with two methyl groups.47–49 Thus, the positive charge is not equally distributed over the MG molecule. It can be supposed that the terminal end having the cationic N+ side participates in electrostatic interactions and at the same time, forms a chelate bond with the –SH group, while the rest of the sides (particularly the organic portion) aid the hydrophobic interactions. Finally, acidic solutions (HCl and EDTA) were employed as suggested by many researchers.1 Interestingly, EDTA showed better desorption performance than HCl and more than 90% MG desorption efficiency was achieved using 0.1 M EDTA concentrated solution, while 62% was achieved using 100% HCl solution (Fig. 19). This can be because in coordination chemistry, EDTA4− is a member of the amino polycarboxylic acid family of ligands. It has two amino and four carboxylic groups. Thus, it can be supposed that EDTA can replace four cationic ions of MG dye sorbed onto the adsorbent with four carboxylic anionic sides and at the same time, the chelation phenomenon could occur due to the S ligand atoms in the –SH groups on the surface of the adsorbent. This might help to rapidly weaken the electrostatic interaction, hydrophilic interactions and chelation forces among the cationic ions of MG dye with the –SH group of 3-MPA@PMNPs. Therefore EDTA was selected for further desorption studies.
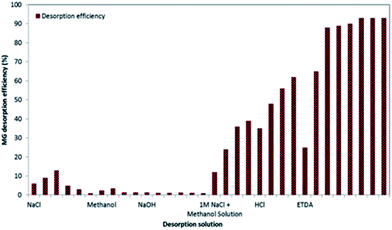 |
| | Fig. 19 Effect of different concentrations of desorption solutions on the desorption efficiency of malachite green (MG) dye (adsorbents dosage = 0.5 g, MG initial concentration (Co) = 25 mg L−1). | |
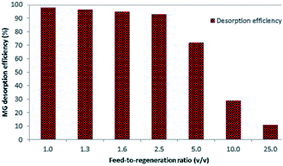
The feed-to-regeneration ratio (v/v) was also optimized to make the EDTA regeneration solution economically feasible for further applications. Initially, the desorption efficiency was almost stable from 1 to 2.5, which decreased gradually on increasing the feed-to-regeneration ratio from 2.5 to 25 (Fig. 20). Most often, a higher ratio is preferred, but it often leads to a lower desorption efficiency. Hence, for keeping technology sustainable, a 2.5 feed-to-regeneration was chosen for the next experiments.
 |
| | Fig. 20 Effect of different feed-to-regeneration ratio (v/v) on the desorption efficiency of malachite green (MG) dye. (0.1 M EDTA regeneration solution; adsorbents dosage = 0.5 g L−1, MG initial concentration (Co) = 25 mg L−1). | |
Fig. 21 shows the results of the sorption–desorption of MG for ten consecutive treatment cycles. The as-prepared 3-MPA@PMNPs adsorbent maintained its performance for up to 5 consecutive treatment cycles and then gradually decreased. Since the desorption efficiency was not 100%, it can be assumed that a segment of sorbed MG dye remained inside the 3-MPA@PMNPs. This deposition of MG dye onto 3-MPA@PMNPs might be responsible for maintaining the desorption efficiency in the first few treatment cycles. Moreover, during the first five treatment cycles, no leakage of iron was found. This suggests that there was no stripping of 3-MPA-capped PMNPs. However, later, the reusability decreased with an increase in the number of treatment cycles. This might be due to the destruction of 3-MPA@PMNPs surface caused by the dissolution of iron particles. The sorption–desorption efficiency was greater than 85% for up to five cycles without a loss in stability, while it decreased to 20% after about ten cycles. This decline in stability or decrease in sorption–desorption efficiency might be due to the leakage of iron, change in the morphology or deficiency of the availability of active/vacant sites on the surface of the 3-MPA@PMNPs (because a portion of the sorbed dye remained inside). Overall, the capping of 3-MPA onto PMNPs was stable for up to five consecutive treatment cycles and it could successfully remove cationic dyes from dye wastewaters in a continues process.
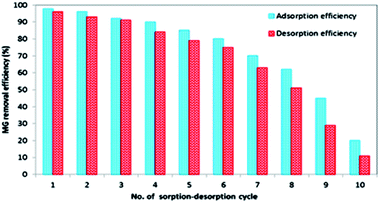 |
| | Fig. 21 Study of the stability and reusability of 3-MPA@PMNPs for consecutive sorption–desorption cycles of malachite green (MG) dye (20 mL of 0.1 M EDTA regeneration solution; adsorbents dosage = 0.5 g L−1, MG initial concentration (Co) = 25 mg L−1). | |
5.1 Influence of co-present constituents
For investigating the sorption selectivity, a binary system (cationic metals ions + cationic MG dye) was prepared and used. The co-presence of cationic ions did not influence the adsorptive removal of cationic MG by 3-MPA@PMNPs under all the experimented concentrations (Fig. 22). However, the presence of higher concentration of Cd2+ in the solutions inhibited MG sorption by the 3-MPA@PMNPs. A higher selectivity was observed in the presence of Pb2+ than with Cd2+ within the contact time of 24 h, while initially (within the contact time of 1 h), both metals ions inhibited the adsorptive removal of MG by 3-MPA@PMNPs (Fig. S7†). This suggests that a competition developed between the excess cationic ions and the MG molecules for the sorption sites on the 3-MPA@PMNPs. Cd2+ ions inhibited the sorption to a larger extent than Pb2+, which might be due to the formation of an inner sphere complex by the reaction between metal ions and the adsorbent. In addition, the hydrated radii of Pb2+ (4.01 Å) is lower than that of Cd2+ (4.26 Å) and this can also influence the adsorptive removal of other cations onto the 3-MPA@PMNPs. This could be because Pb2+ and Cd2+ ions' selectivity might be due to the presence of a mercapto/–SH group on the surface of 3-MPA@PMNPs, where the –SH group plays a governing role in the selectivity of Pb2+ and Cd2+ ions due to the softness of the base because the interaction between a soft acid and soft base predominates (according to the Hard-Soft Acid-Base (HSAB) theory). However, the mercapto (–SH) group is a soft base and prefers to interact with a soft acid (i.e. metal ions) and subsequently form a chelate via a chelation mechanism due to the presence of an S-atom ligand on the surface of 3-MPA@PMNPs.41,42 In addition, MG is a basic cationic dye and its selectivity may be inhibited in the presence of soft acid (metal ions) and the –SH group on the surface of 3-MPA@PMNPs. However, the findings depicted that the MG adsorptive removal was inhibited initially, but later, with the increase in contact time, the adsorptive removal accelerated. This indicates that 3-MPA@PMNPs had sufficient active/vacant sites for the sorption of a greater amount of cationic ions. Therefore, the pre-knowledge of the co-presence of different cationic ions is mandatory to compatibly optimize the operational prerequisites for a smooth application of 3-MPA@PMNPs because the influence of co-existing ions could be varied for different cationic dyes.
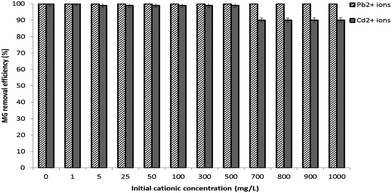 |
| | Fig. 22 Study of the influence of co-present cationic ions on malachite green (MG) removal by 3-MPA@PMNPs (adsorbents dosage = 0.3 g L−1; MG initial concentration (Co) = 10 mg L−1; contact time: 24 h). | |
5.2 Comparison of 3-MPA@PMNPs with other sorbents
Finally, compared to the other sorbents employed for the removal of cationic MG dyes, it was observed that the 3-MPA@PMNPs had a superior performance in terms of high adsorptive capacity and removal towards MG along with high reusability for up to five consecutive treatment cycles (Table 5). In addition, green fabrication, wide operable pH range (6–12) and the fast and easy separation from the final effluents using a simple magnet make 3-MPA@PMNPs a desirable candidate for the adsorptive removal of cationic dyes and heavy metals from domestic and industrial wastewaters.
Table 5 Comparison of 3-MPA@PMNPs with other reported sorbents for the removal of cationic malachite green (MG) dyea
| Cationic dye |
Sorbent |
qe (mg g−1) |
Reusability |
Reference |
| qe: sorption capacity (mg g−1); P.S: present study. |
| MG |
Neem sawdust (Azadirachta indica) |
4.354 |
No |
50 |
| MG |
Chitosan ionic liquid beads |
8.07 |
No |
51 |
| MG |
Activated carbon commercial grade |
8.27 |
No |
52 |
| MG |
Arundo donax root carbon |
8.69 |
No |
53 |
| MG |
Carboxylate group functionalized multi-walled carbon nanotubes |
11.73 |
No |
54 |
| MG |
Annona squamosa seed |
25.91 |
No |
55 |
| MG |
Leaves of Solanum tuberosum |
33.3 |
No |
56 |
| MG |
Wood apple shell (WAS) |
34.56 |
No |
57 |
| MG |
Organically modified clay |
40.48 |
No |
58 |
| MG |
Activated carbon laboratory grade |
42.18 |
No |
51 |
| MG |
Activated carbon derived from Borassus aethiopum flower |
48.48 |
No |
59 |
| MG |
Cobalt ferrite–silica nanocomposites |
75.5 |
No |
60 |
| MG |
3-MPA@PMNPs |
81.2 |
Yes |
Present study |
6. Conclusions
Despite the fact that the various types of nanoparticles have been utilized and reported for the elimination of toxic dyes, the development of novel nanomaterials with high adsorptive performance, low development costs, rapid separation and high reusability is still a challenge. Therefore, to the best of our knowledge, for the very first time, PMNPs were prepared using plant leaves' extract of F. chinensis Roxb. by using a green strategy. The as-prepared PMNPs were further capped by the 3-MPA ligands via a facile method and exploited for the adsorptive removal of cationic MG dye from aqueous solution. The preparation, morphology, surface properties and coating of 3-MPA were examined via FTIR, XRD, EDX, SEM, TEM, XPS, VSM, TGA and BET techniques. Moreover, the 3-MPA@PMNPs presented a high sorption rate (98.57% MG dye removal within 120 min) and the kinetic experimental data fitted well with the pseudo-second-order kinetic model, suggesting that the dye removal mainly supported chemisorption and/or ion-exchange mechanism. The adsorption data agreed well with the Langmuir isotherm, hinting the monolayer sorption of MG onto 3-MPA@PMNPs. The prepared material showed a comparable adsorptive capacity of 81.2 mg g−1 at 25 °C. Similarly, it was evident from the thermodynamic study that the adsorption was exothermic and spontaneous. In addition, the FTIR, XRD and XPS results suggested that mainly cationic MG ions were sorbed due to the presence of electrostatic interaction and the formation of a chelate between (–OH) functional groups and the –SH ligand attached on the surface of 3-MPA@PMNPS. The selected desorption solution for MG was 0.1 M EDTA. Moreover, due to its superparamagnetic nature, the as-prepared 3-MPA@PMNPs adsorbent showed the fastest separation time of 35 s by simply applying a permanent hand-held magnet and the recovered adsorbent could be reused for at least five times and maintained a removal efficiency above 85%. Altogether, the as-prepared 3-MPA@PMNPs showed satisfactorily high adsorptive performance and appropriate kinetics, emphasizing a bright future for its applications in wastewater treatment, particularly in low-economy countries.
Conflicts of interest
The authors declare that there no conflicts of interest.
Acknowledgements
This study was supported by the State Key Laboratory of Environmental Criteria and Risk Assessment (No. SKLECRA 2013FP12) and Shandong Province Key Research and Development Program (2016GSF115040). Further, the first author would like to thank for the financial support by the Chinese Scholarship Council, China (CSC No. 2016GXYO20).
References
- I. Ali, C. Peng, I. Naz, Z. M. Khan, M. Sultan, T. Islam and I. A. Abbasi, RSC Adv., 2017a, 7, 40158–40178 Search PubMed.
- I. Ali, C. Peng, Z. M. Khan and I. Naz, J. Basic Microbiol., 2017b, 9999, 1–10 Search PubMed.
- I. Ali, Z. M. Khan, M. Sultan, M. H. Mahmood, H. U. Farid, M. Ali and A. Nasir, Pol. J. Environ. Stud., 2016, 25, 2265–2273 CrossRef.
- M. Vakili, M. Rafatullah, B. Salamatinia, A. Z. Abdullah, M. H. Ibrahim, K. B. Tan, Z. Gholami and P. Amouzgar, Carbohydr. Polym., 2014, 113, 115–130 CrossRef CAS PubMed.
- M. T. Yagub, T. K. Sen, S. Afroze and H. M. Ang, Adv. Colloid Interface Sci., 2014, 209, 172–184 CrossRef CAS PubMed.
- L. Huang, X. Weng, Z. Chen, M. Megharaj and R. Naidu, Spectrochim. Acta, Part A, 2014a, 117, 801–804 Search PubMed.
- P. Cheera, S. Karlapudi, G. Sellola and V. Ponneri, J. Mol. Liq., 2016, 221, 993–998 CrossRef CAS.
- X. Weng, L. Huang, Z. Chen, M. Megharaj and R. Naidu, Ind. Crops Prod., 2013, 51, 342–347 CrossRef CAS.
- R. Abbassi, A. K. Yadav, N. Kumar, S. Huang and P. R. Jaffe, Ecol. Eng., 2013, 61, 366–370 CrossRef.
- L. Huang, X. Weng, Z. Chen, M. Megharaj and R. Naidu, Spectrochim. Acta, Part A, 2014b, 130, 295–301 Search PubMed.
- R. Sivaraj, C. Namasivayam and K. Kadirvelu, Waste Manage., 2001, 21, 105–110 CrossRef CAS PubMed.
- U. R. Lakshmi, V. C. Srivastava, I. D. Mall and D. H. Lataye, J. Environ. Manage., 2009, 90, 710–720 CrossRef CAS PubMed.
- R. Gong, Y. Ding, M. Li, C. Yang, H. Liu and Y. Sun, Dyes Pigm., 2005, 64, 187–192 CrossRef CAS.
- C. Namasivayam, M. D. Kumar, K. Selvi, R. A. Begum, T. Vanathi and R. T. Yamuna, Biomass Bioenergy, 2001, 21, 477–483 CrossRef CAS.
- K. Porkodi and K. V. Kumar, J. Hazard. Mater., 2007, 143, 311–327 CrossRef CAS PubMed.
- R. Sivashankar, A. B. Sathya, K. Vasantharaj and V. Sivasubramanian, ENMM, 2014, 1, 36–49 Search PubMed.
- X. Luo and L. Zhang, J. Hazard. Mater., 2009, 171, 340–347 CrossRef CAS PubMed.
- T. Shahwan, S. A. Sirriah, M. Nairat, E. Boyacı, A. E. Eroğlu, T. B. Scott and K. R. Hallam, Chem. Eng. J., 2011, 172, 258–266 CrossRef CAS.
- C. Su, J. Hazard. Mater., 2017, 322, 48–84 CrossRef CAS PubMed.
- S. Shamaila, A. K. L. Sajjad, S. A. Farooqi, N. Jabeen, S. Majeed and I. Farooq, Appl. Mater. Today, 2016, 5, 150–199 CrossRef.
- C. Mystrioti, D. Sparis, N. Papasiopi, A. Xenidis, D. Dermatas and M. Chrysochoou, Bull. Environ. Contam. Toxicol., 2015, 94, 302–307 CrossRef CAS PubMed.
- H. Wang, X. Yuan, G. Zeng, L. Leng, X. Peng, K. Liao, L. Peng and Z. Xiao, Environ. Sci. Pollut. Res., 2014, 21, 11552–11564 CrossRef PubMed.
- H. Wang, X. Yuan, Z. Wu, L. Wang, X. Peng, L. Leng and G. Zeng, Sep. Sci. Technol., 2014, 49, 2689–2699 CrossRef CAS.
- L. P. Lingamdinne, Y. Y. Chang, J. K. Yang, J. Singh, E. H. Choi, M. Shiratani and P. Attri, Chem. Eng. J., 2017, 307, 74–84 CrossRef CAS.
- C. M. Martínez, G. M. López, J. L. Barriada, R. Herrero and M. E. S. Vicente, Chem. Eng. J., 2016, 301, 83–91 CrossRef.
- S. Venkateswarlu, D. Lee and M. Yoon, ACS Appl. Mater. Interfaces, 2016, 8, 23876–23885 CAS.
- M. Fazlzadeh, K. Rahmani, A. Zarei, H. Abdoallahzadeh, F. Nasiri and R. Khosravi, Adv. Powder Technol., 2017, 28, 122–130 CrossRef CAS.
- K. S. Prasad, P. Gandhi and K. Selvaraj, Appl. Surf. Sci., 2014, 317, 1052–1059 CrossRef CAS.
- S. Venkateswarlu, B. N. Kumar, B. Prathima, Y. SubbaRao and N. V. V. Jyothi, Arabian J. Chem., 2014 Search PubMed.
- V. K. Gupta and A. Nayak, Chem. Eng. J., 2012, 180, 81–90 CrossRef CAS.
- C. Prasad, G. Yuvaraja and P. Venkateswarlu, J. Magn. Magn. Mater., 2017, 424, 376–381 CrossRef CAS.
- F. Buazar, N. M. H. Baghlani, M. Badri, M. Kashisaz, N. A. Khaledi and F. Kroushawi, Starch/Staerke, 2016, 68, 796–804 CrossRef CAS.
- C. K. Manquián, E. Cruces, M. A. Rubio, C. Reyes and M. N. Arancibia, Ecotoxicol. Environ. Saf., 2017, 145, 69–77 CrossRef PubMed.
- Y. Wei, Z. Fang, L. Zheng and E. P. Tsang, Appl. Surf. Sci., 2017, 399, 322–329 CrossRef CAS.
- V. Smuleac, R. Varma, S. Sikdar and D. Bhattacharyya, J. Membr. Sci., 2011, 379, 131–137 CrossRef CAS PubMed.
- M. E. Haddad, R. S. limani, R. Mamouni, S. ElAntri and S. Lazar, J. Assoc. Arab Univ. Basic Appl. Sci., 2013, 14, 51–59 Search PubMed.
- S. Venkateswarlu, S. H. Kumar and N. V. V. Jyothi, Water Resour. Ind., 2015b, 12, 1–7 Search PubMed.
- T. Burks, M. Avila, F. Akhtar, M. Göthelid, P. C. Lansåker, M. S. Toprak, M. Muhammed and A. Uheida, J. Colloid Interface Sci., 2014, 425, 36–43 CrossRef CAS PubMed.
- D. Morillo, A. Uheida, G. Pérez, M. Muhammed and M. Valiente, J. Colloid Interface Sci., 2015, 438, 227–234 CrossRef CAS PubMed.
- S. Nasrazadani and H. Namduri, Spectrochim. Acta, Part B, 2006, 61, 565–571 CrossRef.
- S. Venkateswarlu and M. Yoon, ACS Appl. Mater. Interfaces, 2015a, 7, 25362–25372 Search PubMed.
- S. Venkateswarlu and Y. Minyoung, Dalton Trans., 2015c, 44, 18427–18437 Search PubMed.
- S. Asad, M. A. Amoozegar, A. Pourbabaee, M. N. Sarbolouki and S. M. M. Dastgheib, Bioresour. Technol., 2007, 98, 2082–2088 CrossRef CAS PubMed.
- L. Ayed, K. Chaieb, A. Cheref and A. Bakhrouf, World J. Microbiol. Biotechnol., 2009, 25, 705 CrossRef CAS.
- S. Karcher, A. Kornmüller and M. Jekel, Dyes Pigm., 2001, 51, 111–125 CrossRef CAS.
- I. Szilagyi, G. Trefalt, A. Tiraferri, P. Maroni and M. Borkovec, Soft Matter, 2014, 10, 2479–2502 RSC.
- G. S. Dawood, Tikrit Journal of Pure Science, 2010, 15, 231–234 Search PubMed.
- S. Çoruh and S. Elevli, Global NEST J., 2014, 16, 339–347 Search PubMed.
- E. H. Gurkan and S. Çoruh, Environ. Eng. Manage. J., 2017, 16, 1173–1185 Search PubMed.
- S. D. Khattri and M. K. Singh, J. Hazard. Mater., 2009, 167, 1089–1094 CrossRef CAS PubMed.
- F. Naseeruteen, N. S. A. Hamid, F. B. M. Suah, W. S. W. Ngah and F. S. Mehamod, Int. J. Biol. Macromol., 2018, 107, 1270–1277 CrossRef CAS PubMed.
- I. D. Mall, V. C. Srivastava, N. K. Agarwal and I. M. Mishra, Colloids Surf., A, 2005, 264, 17–28 CrossRef CAS.
- J. Zhang, Y. Li, C. Zhang and Y. Jing, J. Hazard. Mater., 2008, 150, 774–782 CrossRef CAS PubMed.
- M. Rajabi, B. Mirza, K. Mahanpoor, M. Mirjalili, F. Najafi, O. Moradi, H. Sadegh, G. R. Shahryari, M. Asif, I. Tyagi and S. Agarwal, Ind. Eng. Chem. Res., 2016, 34, 130–138 CrossRef CAS.
- T. Santhi, S. Manonmani, V. S. Vasantha and Y. T. Chang, Arabian J. Chem., 2016, 9, S466–S474 CrossRef CAS.
- N. Gupta, A. K. Kushwaha and M. C. Chattopadhyaya, Arabian J. Chem., 2016, 9, S707–S716 CrossRef CAS.
- A. S. Sartape, A. M. Mandhare, V. V. Jadhav, P. D. Raut, M. A. Anuse and S. S. Kolekar, Arabian J. Chem., 2017, 10, S3229–S3238 CrossRef CAS.
- C. S. Arellano, C. S. López, M. M. Cornejo and G. J. C. Mares, Appl. Surf. Sci., 2013, 280, 74–78 CrossRef.
- S. Nethaji, A. Sivasamy, G. Thennarasu and S. Saravanan, J. Hazard. Mater., 2010, 181, 271–280 CrossRef CAS PubMed.
- M. Amiri, N. M. Salavati, A. Akbari and T. Gholami, Int. J. Hydrogen Energy, 2017, 42, 24846–24860 CrossRef CAS.
Footnote |
| † Electronic supplementary information (ESI) available. See DOI: 10.1039/c8ra00245b |
|
| This journal is © The Royal Society of Chemistry 2018 |
Click here to see how this site uses Cookies. View our privacy policy here.  Open Access Article
 *d
*d
![[thin space (1/6-em)]](https://www.rsc.org/images/entities/char_2009.gif) :
:![[thin space (1/6-em)]](https://www.rsc.org/images/entities/char_2009.gif) 1 metal solution (MS) ratio (Fe2+
1 metal solution (MS) ratio (Fe2+![[thin space (1/6-em)]](https://www.rsc.org/images/entities/char_2009.gif) :
:![[thin space (1/6-em)]](https://www.rsc.org/images/entities/char_2009.gif) Fe3+) was prepared separately by adding 7.321 g FeSO4·7H2O and 7.321 g FeCl3·6H2O into 50 mL of DI water. Then, 50
Fe3+) was prepared separately by adding 7.321 g FeSO4·7H2O and 7.321 g FeCl3·6H2O into 50 mL of DI water. Then, 50![[thin space (1/6-em)]](https://www.rsc.org/images/entities/char_2009.gif) :
:![[thin space (1/6-em)]](https://www.rsc.org/images/entities/char_2009.gif) 50 (v/v) ratio of PE and MS was mixed and heated at 80 °C with continues stirring (at 100 rpm) by a magnetic stirrer heater for at least 60 min. The pH of the mixture was maintained at 12 by adding 0.1 mol L−1 NaOH solution dropwise. The color of the mixture transformed from reddish green to dark black, indicating the formation of PMNPs. Following this, the mixture was allowed to stand for at least 60 min and then, the resultant black colored particles were centrifuged for at least 20 min at 8000 rpm. Subsequently, the supernatant was vacuum-filtered via 0.22 μm filter paper. Then, the collected black particles were cleaned twice using 50 mL of ethanol solution and the final end product was again vacuum-filtered via 0.22 μm filter paper. Finally, the fabricated black particles were kept in a drying oven for at least 20 min at 80 °C.
50 (v/v) ratio of PE and MS was mixed and heated at 80 °C with continues stirring (at 100 rpm) by a magnetic stirrer heater for at least 60 min. The pH of the mixture was maintained at 12 by adding 0.1 mol L−1 NaOH solution dropwise. The color of the mixture transformed from reddish green to dark black, indicating the formation of PMNPs. Following this, the mixture was allowed to stand for at least 60 min and then, the resultant black colored particles were centrifuged for at least 20 min at 8000 rpm. Subsequently, the supernatant was vacuum-filtered via 0.22 μm filter paper. Then, the collected black particles were cleaned twice using 50 mL of ethanol solution and the final end product was again vacuum-filtered via 0.22 μm filter paper. Finally, the fabricated black particles were kept in a drying oven for at least 20 min at 80 °C.


![[double bond, length as m-dash]](https://www.rsc.org/images/entities/char_e001.gif) O or C
O or C![[double bond, length as m-dash]](https://www.rsc.org/images/entities/char_e001.gif) C stretching vibration of acid derivatives, which then shifts to 1639 cm−1 (Fig. 2b). These peaks may hint at the physisorbed or chemisorbed H2O onto PMNPs as previously reported by various researchers.31,32 A slim absorption peak at 1163 cm−1 (Fig. 2a) is attributed to the C–O stretching vibration of esters, which is then shifted to 1114 cm−1 (Fig. 2b) due to the C–O stretching vibration of aliphatic ether or a bond of the glucose ring in the plant leaves' extract. Further, the rapid decline in intensity at 1662 and 1163 cm−1 after the reduction of MS implies the main involvement of –OH groups in this as previously discussed by various researchers.18,32 Finally, a strong absorption band at 630 cm−1 can be attributed to the characteristic band of Fe–O, which suggests the formation of Fe3O4 NPs or PMNPs (as previously reported by Prasad et al.31). Therefore, the FTIR results verified the capping and participation of plant biomolecules (polyphenol, glucose, primary amine, ether, carboxyl, aliphatic, alkene and ester) on the surface of PMNPs through –OH, C–H and C–O functional groups. In addition, the FTIR results also proved the findings achieved from the color development tests (as discussed in the extract characterization section).
C stretching vibration of acid derivatives, which then shifts to 1639 cm−1 (Fig. 2b). These peaks may hint at the physisorbed or chemisorbed H2O onto PMNPs as previously reported by various researchers.31,32 A slim absorption peak at 1163 cm−1 (Fig. 2a) is attributed to the C–O stretching vibration of esters, which is then shifted to 1114 cm−1 (Fig. 2b) due to the C–O stretching vibration of aliphatic ether or a bond of the glucose ring in the plant leaves' extract. Further, the rapid decline in intensity at 1662 and 1163 cm−1 after the reduction of MS implies the main involvement of –OH groups in this as previously discussed by various researchers.18,32 Finally, a strong absorption band at 630 cm−1 can be attributed to the characteristic band of Fe–O, which suggests the formation of Fe3O4 NPs or PMNPs (as previously reported by Prasad et al.31). Therefore, the FTIR results verified the capping and participation of plant biomolecules (polyphenol, glucose, primary amine, ether, carboxyl, aliphatic, alkene and ester) on the surface of PMNPs through –OH, C–H and C–O functional groups. In addition, the FTIR results also proved the findings achieved from the color development tests (as discussed in the extract characterization section).![[thin space (1/6-em)]](https://www.rsc.org/images/entities/char_2009.gif) θ, where D is the average particle size, λ is the wavelength of the CuKα irradiation, β is the full width at half maximum intensity of the diffraction peak and θ is the diffraction angle at 2θ = 35.2° peak attributed to iron oxide NPs.34 The biosynthesized PMNPs possessed the mean crystallite size of ∼39 nm. Further, the XRD pattern of 3-MPA@PMNPs was also recorded and it was found that the –SH functional group had undergone binding with the fabricated PMNPs. The characteristic peaks at 2θ = 30° and 2θ = 56° indicated the capping of the –SH group with the PMNPs. In addition, the intensity of the characteristic peaks of Fe2O3/Fe3O4 NPs (denoted as “+”) in the patterns also improved, indicating the formation of bonding between the –SH groups and PMNPs.39 This might be due to the presence of a carboxylate group (COO−) on the surface of the PMNPs (as previously confirmed by FTIR analysis). Overall, the XRD results confirmed the formation of PMNPs, the smooth capping of 3-MPA on the surface of PMNPs and the sorption of MG molecules on the 3-MPA@PMNPs (Fig. 3).
θ, where D is the average particle size, λ is the wavelength of the CuKα irradiation, β is the full width at half maximum intensity of the diffraction peak and θ is the diffraction angle at 2θ = 35.2° peak attributed to iron oxide NPs.34 The biosynthesized PMNPs possessed the mean crystallite size of ∼39 nm. Further, the XRD pattern of 3-MPA@PMNPs was also recorded and it was found that the –SH functional group had undergone binding with the fabricated PMNPs. The characteristic peaks at 2θ = 30° and 2θ = 56° indicated the capping of the –SH group with the PMNPs. In addition, the intensity of the characteristic peaks of Fe2O3/Fe3O4 NPs (denoted as “+”) in the patterns also improved, indicating the formation of bonding between the –SH groups and PMNPs.39 This might be due to the presence of a carboxylate group (COO−) on the surface of the PMNPs (as previously confirmed by FTIR analysis). Overall, the XRD results confirmed the formation of PMNPs, the smooth capping of 3-MPA on the surface of PMNPs and the sorption of MG molecules on the 3-MPA@PMNPs (Fig. 3).


![[thin space (1/6-em)]](https://www.rsc.org/images/entities/char_2009.gif) qe = ln
qe = ln![[thin space (1/6-em)]](https://www.rsc.org/images/entities/char_2009.gif) qm − βε2
qm − βε2


