
 Open Access Article
 This Open Access Article is licensed under a Creative Commons Attribution-Non Commercial 3.0 Unported Licence
The Yxy colour space parameters as novel signalling tools for digital imaging sensors in the analytical laboratory†
Ashraf A. Mohamed *,
Ahmed A. Shalaby and
Abdelnaby M. Salem
*,
Ahmed A. Shalaby and
Abdelnaby M. Salem
Department of Chemistry, Faculty of Science, Ain Shams University, Abbassia, Cairo-11566, Egypt. E-mail: aamohamd@sci.asu.edu.eg; Fax: +202 24831836; Tel: +2 01001578849
First published on 16th March 2018
Abstract
Digital imaging devices can be promising, sensitive, and cost-effective chemical sensors for resource-limited settings. Three model colour reactions of iron were used and monitored using a simple platform consisting only of a camera, a cuvette, and a white paper diffuser. A desktop scanner and a mobile phone camera were also used as imaging devices. Captured images were analysed to obtain the RGB intensities (red, green, blue) and were further converted into the corresponding signals of the grayscale, CMY (cyan, magenta, yellow), XYZ (Y: luminance, XZ: chromaticity plane values) and Yxy colour spaces (Y: luminance, xy: chrominance values) analytical signals. The elegant procedure utilizing the Yxy signals surpassed those based on RGB, grayscale, CMY and tristimulus XYZ data regarding the calibration graph linearity and detection limit and compare well with those data obtained from a sophisticated spectrophotometer for assessing iron in complex environmental samples. The simplicity, sensitivity and cost effectiveness of the approach make it suitable for poorly equipped laboratories and locally deprived communities.
1. Introduction
Spectrochemical methods utilizing the light absorbed by (or emitted from) a sample are very popular in quantitative chemical analysis. However, bulky size and relatively high cost are common disadvantages of many research grade spectrometers.Therefore, methods of digital image-based analysis (DIBA) are suggested as simple and low-cost alternatives. DIBA relies on a colour change, wherein the analyte reacts with a chromogenic reagent to give a coloured product, the digital images of which are analysed to obtain the red, green and blue (RGB) intensity values (IR, IG, IB, and IRGB). The RGB intensities,1–10 the RGB absorbance (AR, AG, AB, ARGB),11–14 the normalized IG/IR ratio,15 the cyan, magenta, and yellow (CMY) intensities,16–19 the tristimulus XYZ parameters,20–22 the greyscale intensity,23,24 and the inverted 8 bit greyscale intensity25,26 have been used as analytical signals in DIBA. Images have been captured using digital cameras,9,14,18,24 mobile phone cameras,4,7,12,15,17,19,23 web cams,10,11 or computer scanners.6,13,16,17,25,26 However, some other excellent papers on the topic have been undoubtedly missed and can be found in excellent reviews of the topic.27–29
The mathematical conversion of RGB intensities into the corresponding parameters of other colour spaces is well documented;27–30 A brief introduction to the aforementioned colour spaces and their inter-conversions is given in the ESI.† However, some programs perform these conversions at a click of a button. The free online Colormine converter is very simple and was adopted in this work.31
It is worthy to mention that, the CIE (Commission Internationale de l'Eclairage, International Commission on Illumination) has classified the RGB, CMY, YXZ, and Yxy spaces as non-uniform colour spaces, where at constant luminance, the colour differences represented by equal distances are not perceived, by the human eye, as being equal. Moreover, the RGB and CMY are device dependent colour spaces that vary from one device to another and cannot represent all the colours.30
Despite the aforementioned progress,1–26 the direct application of RGB intensity,1–10 RGB colour absorbance,11–14 CMY,16–19 XYZ,20–22 and grayscale parameters,23–26 in analytical determinations exhibited a major disadvantage of poor linearity of its calibration graphs, especially at the low analyte concentrations that are commonly encountered in environmental samples.1–26
Herein, we present the Yxy colour space parameters (Y: luminance, xy: chrominance values) as a novel signalling tool for digital imaging sensors in the analytical laboratory. The Yxy signals exhibited excellent performance compared to the RGB parameters and the corresponding data of a sophisticated Shimadzu UV 1601 PC spectrophotometer. Moreover, we show the advantages of Yxy over the RGB, grayscale, CMY, and tristimulus XYZ colour space signals regarding calibration graph linearity, slope-to-intercept ratio, and LOD. Also, we describe the design, use, and validation of a simple homemade platform and its application to the assessment of iron based on its reactions with 1,10-phenanthroline, 2,4,6-tris(2-pyridyl)-s-triazine (TPTZ) or salicylate. Our low-cost and simple platform is free from lenses, slits, mirrors, monochromators, photodiodes, photomultipliers, and signal amplifiers. It consists of (1) a digital camera, (2) a cuvette and (3) a white paper as a background diffuser. These advantages make the present platform an excellent successor to many of the closely related devices.1–26
2. Experimental
2.1. Materials and reagents
All reagents were of ACS grade and were used as received from Sigma-Aldrich (St. Louis, MO, USA) or Merck (Darmstadt, Germany). Ultrapure water and aqueous solutions were used throughout. 1,10-Phenanthroline, 2,4,6-tris(2-pyridyl)-s-triazine (TPTZ), sodium salicylate, ferrous ammonium sulphate hexahydrate, ferric ammonium sulphate dodecahydrate, and L-ascorbic acid were also used. Standard solutions for the determination of iron using phenanthroline,32–35 TPTZ,35,36 and salicylate37 were prepared according to standard/reference methods.2.2. Instruments and software
Spectrophotometric measurements were performed on a Shimadzu UV 1601 PC Spectrophotometer (Kyoto, Japan) controlled by UVProbe-2.5 software. Eppendorf 10–100 and 100–1000 μL vary-pipettes (Westbury, NY, USA) and a calibrated EDT pH-mV meter (Dover Kent, UK) were also used.Digital image-based analysis (DIBA) measurements were conducted using a simple homemade platform (spectrometer) consisting of (1) a cuvette as a sample container, (2) a digital camera as an imaging device, (3) white paper as a background diffuser. However, the sample container can also be a test tube, a beaker, or a microwell plate, and the digital imaging device can be a smartphone camera, a desktop scanner, or a simple webcam. The diffuser and the camera were fixed at 5 cm distances from both sides of the polylactic acid 3D-printed cell-holder on a 20 × 20 cm wooden plate, as shown in Fig. 1. For comparison of various digital imaging devices, images were captured using a 16.0 MP Canon PowerShot A810 digital camera, a 3.15 MP Sony Xperia E Dual smartphone camera, and the scanner of an HP LaserJet Pro M1536dnf MF printer.
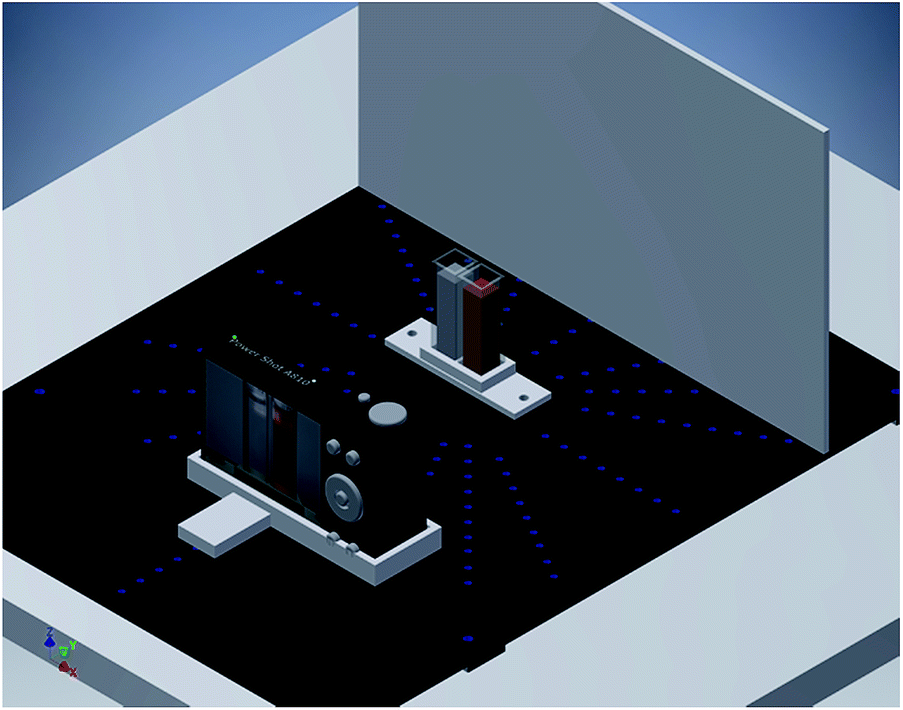 | ||
| Fig. 1 The homemade platform design. | ||
A simple HP-Pavilion dv6-6176ex Notebook running Windows 8.1 was used for data treatment and analysis. Photoshop CC 2015.5 and ImageJ software version 1.51i were used for digital image cropping and RGB channel intensity calculations, respectively.
2.3. Recommended procedure
2.4. Procedure for digital image processing
From each captured image, a representative homogenous area was cropped (a square of 354 × 354 pixels from the camera images, a square of 142 × 142 pixels from the smartphone images and a circle of 64, 127, and 253 pixels in diameter from the 300, 600 and 1200 dpi images of the scanner, respectively; however, any other predefined area can be used). Cropped images were processed to obtain the RGB channel intensities (IR, IG, and IB), which can be used directly or after conversion into other colour spaces. For each image, the RGB colour absorbance (AR, AG, AB, and ARGB) was calculated from [A = log(I0/I)], where I0 and I are the channel intensities of the blank and sample, respectively. However, the Yxy colour absorbance was calculated from [Axy = |log(I0/I)|]. The obtained RGB intensities were converted into the corresponding coordinates of other non-uniform colour spaces using the Colormine online converter.313. Results and discussion
3.1. Preliminary studies
The main advantages of the developed platform were its simplicity, ease of construction and high performance at minimum cost. Trials using conventional LED lamps as light sources4 were unsuccessful, as captured images were not homogeneous among their different parts, exhibiting variable degrees of brightness depending on not only the number and intensity of LED lamps but also the relative distances and angles between the lamp, cuvette, camera, and diffuser. Therefore, for the sake of simplicity, reproducibility, and cost reduction, we used the conventional fluorescent daylight lamp fixed to the ceiling of our laboratory (at about 2.5 m distance from the bench-top), as the light source. With this choice, the photo quality and the colour absorbance registered with the platform was almost independent of the lamp intensity, the relative platform-lamp position, camera-cuvette distance, and cuvette-diffuser distance, Fig. S1 and S2.† This is due to the relatively large distance between the lamp and cuvette that allowed a uniform light segment to reach the sample. However, for practical considerations, the camera and the diffuser were set at 5 cm distances from the 3-D printed cell holder carrying the cuvettes, Fig. 1. Moreover, the flash off mode of the camera was used to prevent any reflections on the cuvette surface due to the camera flash light.3.2. Comparison between RGB, grayscale, CMY, XYZ and Yxy parameters as signalling tools
Our homemade platform was applied to the determination of iron using 1,10-phenanthroline, TPTZ and salicylate, which gave orange-red, blue-purple and violet colours, respectively. These reaction systems were selected to give three different colours covering a wide range of the visible spectrum. A representative area was cropped from each image (Fig. S2A–C).† These cropped images were analysed to obtain the corresponding RGB channel intensities. For the Fe(II)-phenanthroline system, plots of Fe(II) concentration vs. RGB intensities or their logarithmic values (i.e., log(IR), log(IG), log(IB), or log(IRGB)), gave inadequate linearity, as shown in Fig. 2A and B. On the other hand, conversion of the RGB intensities to the corresponding 8 bit greyscale intensity and plotting Fe(II) concentration vs. greyscale intensity (IGrey), logarithmic greyscale intensity (log![[thin space (1/6-em)]](https://www.rsc.org/images/entities/char_2009.gif) IGrey) or greyscale colour absorbance (Agreyscale) worsened the linearity, Fig. 2C–E.
IGrey) or greyscale colour absorbance (Agreyscale) worsened the linearity, Fig. 2C–E.
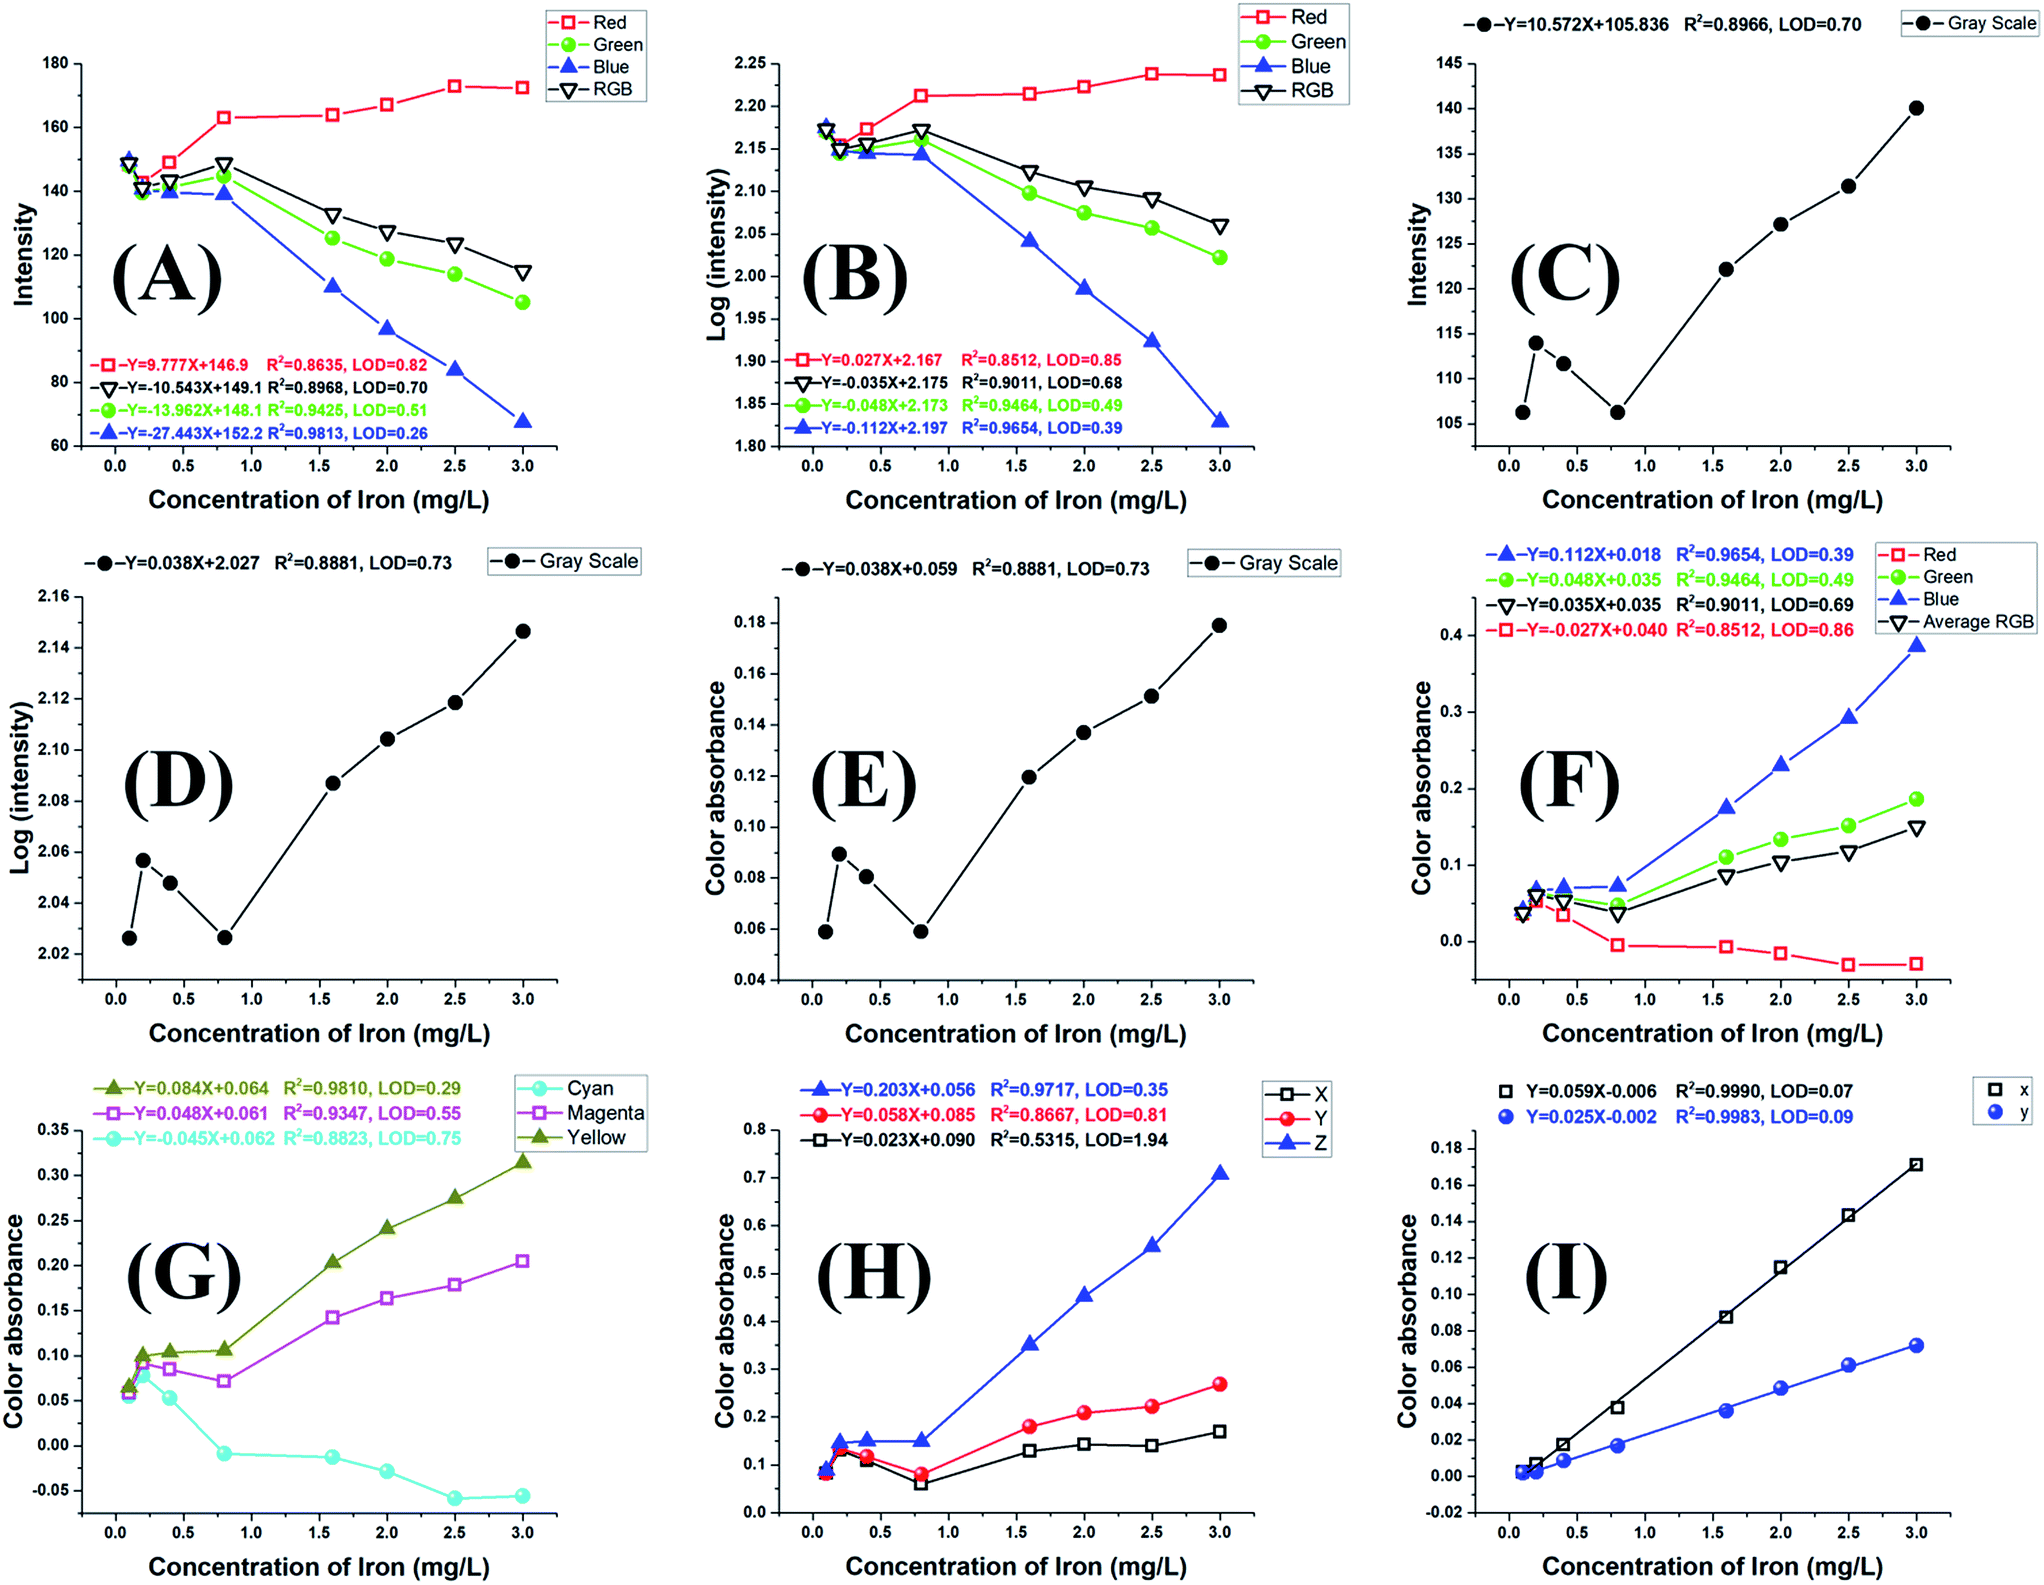 | ||
| Fig. 2 Calibration graphs of Fe(II)-phenanthroline solutions. Responses are RGB intensity (A), logIRGB (B), greyscale intensity (C), log(greyscale intensity) (D), greyscale colour absorbance (E), RGB colour absorbance (F), CMY colour absorbance (G), tristimulus XYZ colour absorbance (H), and Yxy colour absorbance (I). Conditions are those of the recommended procedure. | ||
To improve the linearity, we converted the RGB channel intensities into the corresponding RGB colour absorbance values (AR, AG, AB, and ARGB), Fig. 2F, where inadequate linearity was also observed. Therefore, we tested the conversion of the RGB intensities into the corresponding colour absorbance values in the CMY, XYZ, and Yxy colour spaces, Fig. 2G–I. The conversion data clearly show that compared to the RGB, CMY and tristimulus XYZ values, the x and y coordinate of the Yxy space exhibited a marginal improvement not only in linearity (R2 = 0.999) but also in slope, slope-to-intercept ratio and detection limit (LOD = 0.07 mg L−1), Fig. 2I.
To confirm that these findings are not limited to the orange-red coloured Fe-phenanthroline system, we examined the well-known Fe(II)-TPTZ system exhibiting a deep blue-purple colour. Solutions containing 0.00–2.00 mg L−1 Fe(II) were treated with TPTZ according to the recommended procedure. Images of these reacting solutions, Fig. S2B,† were captured, cropped, and analysed to obtain the RGB values and further converted into other non-uniform colour spaces' parameters. The relations between Fe(II) concentration and IRGB, ARGB, ACMY, AXYZ and AYxy, have been constructed. The data, Fig. S3A–E,† also showed that among all the tested signals, the x and/or y coordinate of the Yxy space exhibited marginal improvements in linearity (R2 ≥ 0.999), slope, slope-to-intercept ratio and detection limit (LOD = 0.02 mg L−1).
For further verification, we extended our work from the orange-red Fe-phenanthroline and the blue-purple Fe-TPTZ systems to the well-known violet-coloured Fe(III)-salicylate system. Solutions containing 0.0–18.0 mg L−1 Fe(III) were treated with salicylate according to the recommended procedure. Images of these reacting solutions, Fig. S2C,† were similarly analysed and the relations between Fe(III) concentration and IRGB, ARGB, ACMY, AXYZ and AYxy, were established. Similarly, the data, Fig. S4A–E,† showed that among all the tested parameters, the Ay parameter of the Yxy space exhibited marginal improvements in linearity (R2 = 0.999), slope, slope-to-intercept ratio and detection limit.
In addition, the colour absorbance of the x and/or y coordinates of the Yxy colour space was compared to the absorbance readings recorded using the Shimadzu UV 1601 PC spectrophotometer for the three colour systems: Fe(II)-Phenanthroline, Fe(II)-TPTZ and Fe(III)-salicylate, respectively, Fig. 3A–C. The regression parameters of Table S1† clearly show that colour absorbance data from digital images compete well with the corresponding spectrophotometric absorbance data, with the added advantage that our platform does not contain any monochromator, photomultiplier, signal amplifier, or any special optical unit.
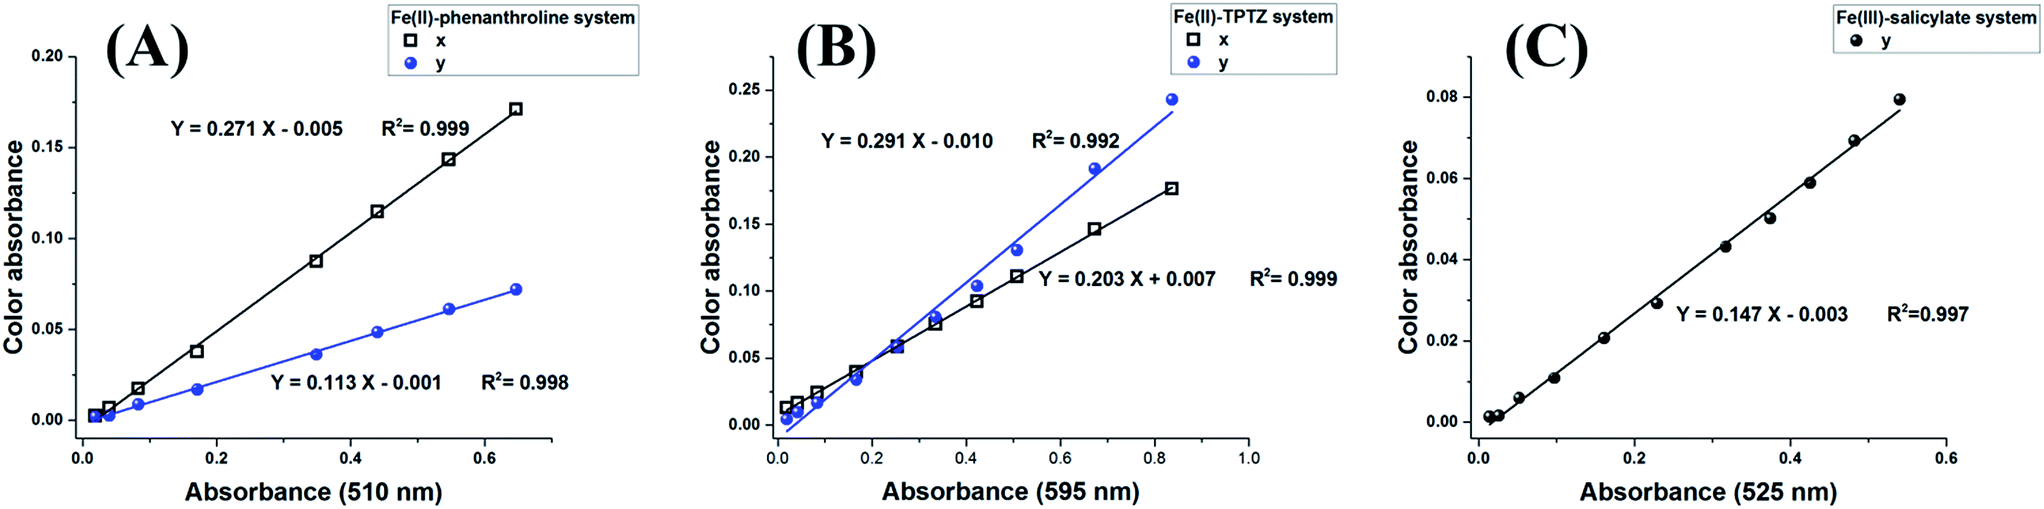 | ||
| Fig. 3 Relationship between Yxy colour absorbance and spectrophotometric absorbance at the appropriate wavelength for the Fe(II)-phenanthroline (A), Fe(II)-TPTZ (B), and Fe(III)-salicylate systems (C). The other conditions tested are those shown in Fig. 2. | ||
Now, the challenging question is as follows: why do the x and y coordinate absorbances provide excellent linearity in the Fe(II)-phenanthroline and Fe(II)-TPTZ systems, whereas only the y coordinate absorbance exhibited excellent linearity in the Fe(III)-Salicylate system? This can be explained by the fact that the Fe(II)-phenanthroline and Fe(II)-TPTZ are orange-red and blue-purple, respectively, and are affected by both the x and y coordinate parameters. Therefore, they provide excellent calibration relations with both parameters. However, the Fe(III)-salicylate system exhibits a violet colour and is mainly affected by the y parameter; therefore, it gave excellent linearity with the y parameter only.
It is worthy to mention that, according to the CIE, the XYZ and Yxy are device independent spaces and can represent all the colours because the xy gamut includes the RGB gamut inside it. However, the Yxy space has an advantage over the XYZ space as it normalizes the XYZ parameters and represents the colours in 2D plane that give good correlation with human vision attributes.30 This may explain why the Yxy space data are more linear compared to other non-uniform colour spaces.
Based on the above findings, we can safely recommend using the x and/or y colour absorbance values of the Yxy space for analytical determination based on digital imaging. This is because the Yxy colour absorbance surpasses the conventional RGB intensities, greyscale intensity, logRGB, loggreyscale parameters, along with the colour absorbance values of RGB, greyscale, CMYK or tristimulus XYZ parameters.
3.3. Comparison of different digital imaging devices
To compare various image-capturing devices, we compared a Sony Xperia E smartphone with a 3.15 MP low-resolution camera and the scanner of HP LaserJet Pro M1536dnf MF printer to our Canon PowerShot A810 digital camera with its 16 MP sensor. Digital images and the corresponding cropped areas of Fe(II)-phenanthroline solutions in 10 mm glass cells and 96-microwell plates, were recorded, Fig. 4A and B. The relation between Fe(II) concentration and the x-coordinate colour absorbance (Ax) of the scanner images at 300, 600 and 1200 dpi were depicted, Fig. 4C. The regression parameters clearly show that there is no significant difference in the linearity or slopes of the three calibration lines. Thus, to save time, we recommend using the 300 dpi scan speed. The use of the microwell plate and scanner added the advantage of the possible direct analysis of samples in the form of thin-films, nL or μL droplets.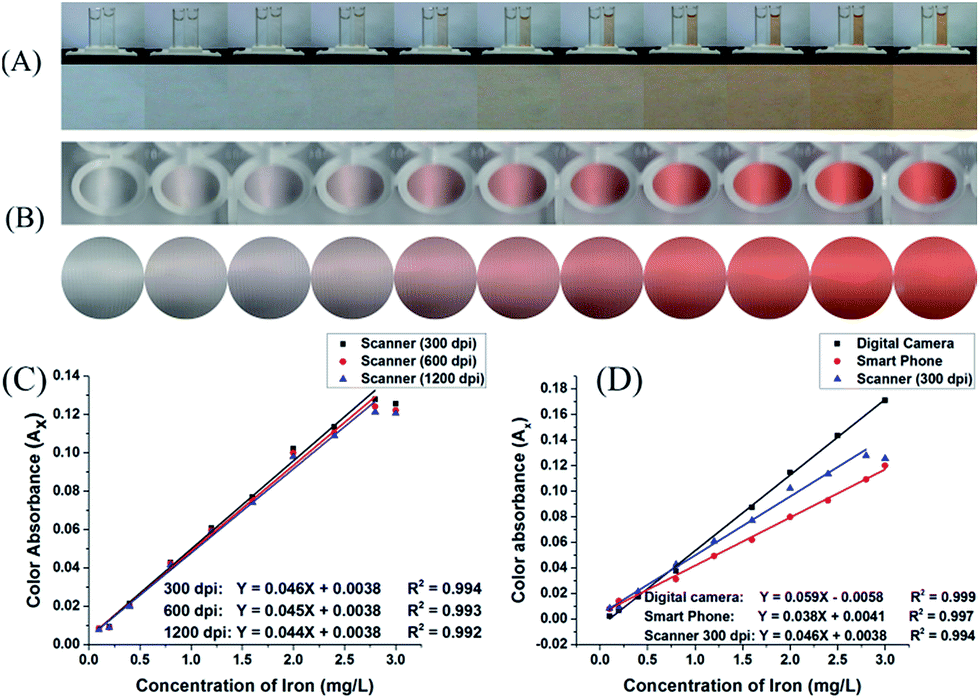 | ||
| Fig. 4 Digital images and cropped images of Fe(II)-phenanthroline standard solutions (0.0–3.0 mg L−1 Fe). Images were captured using (A) a Sony Xperia E smartphone equipped with a 3.15 MP camera and (B) the scanner of HP LaserJet Pro M1536dnf MF printer at 1200 dpi. Calibration graphs based on images from the desktop scanner at various pixel densities (C), and from various digital image-capturing devices (D). Captured images were arbitrarily compressed to fit into the page margins; however, for image processing, the original uncompressed images were used. The other conditions tested are those shown in Fig. 2. | ||
The relations between Fe(II) concentration and the colour absorbance (Ax) obtained by the three image-capturing devices are depicted, Fig. 4D. The linear calibration equations indicate that the sensor sensitivity has the order digital camera > scanner > smartphone, as evidenced from the slope values of 0.059 > 0.046 > 0.038. However, the linearity is not significantly affected by changing the image-capturing device resolution, as all devices resulted in a correlation coefficient R2 ≥0.994.
Similarly, the relation between the Fe concentration and x or y colour absorbance of images of Fe(II)-TPTZ and Fe(III)-salicylate solutions captured using various image-capturing devices, Fig. S5 and S6.† For both systems, the regression equations show no significant difference between the linearity and sensitivity of the different calibration lines constructed using the scanner at various levels of pixel density. Moreover, all calibration lines constructed using the three image-capturing devices show excellent linearity (R2 > 0.99), with the digital camera exhibiting the best sensitivity (slope).
3.4. Determination of iron in real samples
The performance of our homemade platform with the Yxy signalling was tested by its application to the assessment of iron in real samples. The analytical data obtained by the proposed approach were validated by comparison with the corresponding data obtained with the sophisticated Shimadzu UV 1601 PC spectrophotometer. For sample analysis, the digital camera was used as the image-capturing device, and the Ax colour absorbance of the Yxy colour space was used as the analytical signalling tool. The 1,10-phenanthroline method was used for the analysis of natural and waste waters and three pharmaceutical samples: Fercayl injection solution, Hydroferrin syrup, and Theragran multivitamin tablets. Table 1 shows the results of iron determination obtained using the proposed DIBA and standard phenanthroline-based spectrophotometric methods. At the 95% confidence level, the Student's t-test and the F-test could not detect any significant difference between the means and variances of the two methods.38| Iron concentration | F0.05(3,3), Ftabulated = 39 | |t0.05(3,3)|, Ttabulated = 2.78 | P value, Ptabulated = 0.050 | ||
|---|---|---|---|---|---|
| DIBA | Spectrophotometry | ||||
| a Collected downstream, approximately 1 km from the Qasr El Nile Bridge on March 10, 2017; (pH = 8.10).b Collected from the exit pipe of 101 Chem Lab. | |||||
| Nile river water (mg L−1)a | 0.52 ± 0.02 | 0.53 ± 0.02 | 1 | 0.61 | 0.573 |
| Waste water (mg L−1)b | 1.95 ± 0.03 | 1.94 ± 0.02 | 2.25 | 0.48 | 0.656 |
| Fercayl injection (mg mL−1) | 45.12 ± 0.21 | 45.20 ± 0.07 | 10.05 | 0.67 | 0.542 |
| Hydroferrin syrup (mg mL−1) | 55.72 ± 0.98 | 56.56 ± 0.23 | 17.68 | 1.45 | 0.220 |
| Theragran multivitamin (mg per tablet) | 64.95 ± 0.62 | 65.45 ± 0.32 | 3.88 | 2.11 | 0.102 |
4. Conclusion
In conclusion, we report a homemade, low-cost, and portable camera-based platform with Yxy signalling and its application to the assessment of iron. Our inexpensive and simple design is free from special light sources, lenses, slits, mirrors, filters, gratings, special sample compartments, photodiodes, photomultipliers, and signal amplifiers. In principle, it requires only a cuvette, a camera (or mobile phone or scanner), and a white paper as a diffuser. Moreover, it can measure absorption, reflectance, and/or luminescence without any additional instrumentation or software, indicating its potential as an excellent competitor to sophisticated laboratory spectrophotometers and spectrofluorometers. This would be very promising, especially in resource-limited environments. In addition, it can in principle analyse not only large volume liquid samples but also nano- or microlitre droplet and thin-film samples of transparent, non-transparent, solid, turbid or opaque dispersion samples where common spectrophotometers and spectrofluorometers usually require special attachment units. With our platform, a comparison of various non-uniform (RGB, greyscale, inverted greyscale, CMY, tristimulus XYZ, and Yxy) signals revealed that the Ax and/or Ay colour absorbance parameters of the Yxy colour space yielded calibration graphs with excellent linearity, slope-to-intercept ratio, and LOD irrespective of the colour and nature of the reaction system. Moreover, the linearity and sensitivity of the calibration lines were independent of the type and resolution of the image-capturing device. The excellent performance of the platform was demonstrated by its application to the assessment of iron in natural and waste waters and pharmaceutical samples. Statistical treatment of the analytical results revealed no significant difference between the data obtained using our platform and the sophisticated Shimadzu UV-1601 PC spectrophotometer.Conflicts of interest
There are no conflicts to declare.Notes and references
- N. A. Rakow, A. Sen, M. C. Janzen, J. B. Ponder and K. S. Suslick, Angew. Chem., Int. Ed. Engl., 2005, 44, 4528–4532 CrossRef CAS PubMed.
- R. C. Evans and P. Douglas, Anal. Chem., 2006, 78, 5645–5652 CrossRef CAS PubMed.
- A. W. Martinez, S. T. Phillips, M. J. Butte and G. M. Whitesides, Angew. Chem., Int. Ed. Engl., 2007, 46, 1318–1320 CrossRef CAS PubMed.
- A. Scheeline, Appl. Spectrosc., 2010, 256A–268A, http://scheeline.scs.illinois.edu/%7Easweb/CPS/, accessed 08-Jan-2018 Search PubMed.
- F. R. d. Souza, G. F. Duarte Junior, P. d. T. Garcia and W. K. T. Coltro, Quim. Nova, 2014, 37, 1171–1176 CrossRef.
- H. Kudo, K. Yamada, D. Watanabe, K. Suzuki and D. Citterio, Micromachines, 2017, 8, 127–138 CrossRef.
- P. Masawat, A. Harfield, N. Srihirun and A. Namwong, Anal. Lett., 2016, 50, 173–185 CrossRef.
- S. K. Vashist, T. van Oordt, E. M. Schneider, R. Zengerle, F. von Stetten and J. H. Luong, Biosens. Bioelectron., 2015, 67, 248–255 CrossRef CAS PubMed.
- E. H. Doeven, G. J. Barbante, E. Kerr, C. F. Hogan, J. A. Endler and P. S. Francis, Anal. Chem., 2014, 86, 2727–2732 CrossRef CAS PubMed.
- S. J. E. Andrade, M. B. Lima, I. S. Barreto, W. S. Lyra, L. F. Almeida, M. C. U. Araujo and E. C. Silva, Microchem. J., 2013, 109, 106–111 CrossRef CAS.
- J. A. V. A. Barros, F. M. d. Oliveira, G. d. O. Santos, C. Wisniewski and P. O. Luccas, Anal. Lett., 2016, 50, 414–430 CrossRef.
- L. J. Wang, R. Sun, T. Vasile, Y. C. Chang and L. Li, Anal. Chem., 2016, 88, 8302–8308 CrossRef CAS PubMed.
- B. M. Jayawardane, I. D. McKelvie and S. D. Kolev, Anal. Chem., 2015, 87, 4621–4626 CrossRef CAS PubMed.
- D. C. Christodouleas, A. Nemiroski, A. A. Kumar and G. M. Whitesides, Anal. Chem., 2015, 87, 9170–9178 CrossRef CAS PubMed.
- Q. Wei, R. Nagi, K. Sadeghi, S. Feng, E. Yan, S. J. Ki, R. Caire, D. Tseng and A. Ozcan, ACS Nano, 2014, 8, 1121–1129 CrossRef CAS PubMed.
- S. A. Klasner, A. K. Price, K. W. Hoeman, R. S. Wilson, K. J. Bell and C. T. Culbertson, Anal. Bioanal. Chem., 2010, 397, 1821–1829 CrossRef CAS PubMed.
- B. Pang, C. Zhao, L. Li, X. Song, K. Xu, J. Wang, Y. Liu, K. Fu, H. Bao, D. Song, X. Meng, X. Qu, Z. Zhang and J. Li, Anal. Biochem., 2018, 542, 58–62 CrossRef CAS PubMed.
- W.-H. Liang, C.-H. Chu and R.-J. Yang, Talanta, 2015, 145, 6–11 CrossRef CAS PubMed.
- A. W. Martinez, S. T. Phillips, E. Carrilho, S. W. Thomas III, H. Sindi and G. M. Whitesides, Anal. Chem., 2008, 80, 3699–3707 CrossRef CAS PubMed.
- J. C. Ye, N. Li, Y. Lu, J. Cheng and Y. C. Xu, Anal. Methods, 2017, 9, 2464–2471 RSC.
- V. M. Ivanov, V. N. Figurovskaya and Y. I. Shcherbakova, Moscow Univ. Chem. Bull., 2013, 68, 191–195 CrossRef.
- V. M. Ivanov, O. V. Monogarova and K. V. Oskolok, J. Anal. Chem., 2015, 70, 1165–1178 CrossRef CAS.
- B. Wang, Z. Lin and M. Wang, J. Chem. Educ., 2015, 92, 733–736 CrossRef CAS.
- H. Asano and Y. Shiraishi, Anal. Chim. Acta, 2015, 883, 55–60 CrossRef CAS PubMed.
- P. Rattanarat, W. Dungchai, D. Cate, J. Volckens, O. Chailapakul and C. S. Henry, Anal. Chem., 2014, 86, 3555–3562 CrossRef CAS PubMed.
- P. Rattanarat, W. Dungchai, D. M. Cate, W. Siangproh, J. Volckens, O. Chailapakul and C. S. Henry, Anal. Chim. Acta, 2013, 800, 50–55 CrossRef CAS PubMed.
- L. F. Capitan-Vallvey, N. Lopez-Ruiz, A. Martinez-Olmos, M. M. Erenas and A. J. Palma, Anal. Chim. Acta, 2015, 899, 23–56 CrossRef CAS PubMed.
- G. G. Morbioli, T. Mazzu-Nascimento, A. M. Stockton and E. Carrilho, Anal. Chim. Acta, 2017, 970, 1–22 CrossRef CAS PubMed.
- V. V. Apyari, M. V. Gorbunova, A. I. Isachenko, S. G. Dmitrienko and Y. A. Zolotov, J. Anal. Chem., 2017, 72, 1127–1137 CrossRef CAS.
- R. W. G. Hunt and M. R. Pointer, Measuring colour, John Wiley & Sons, Ltd, United Kingdom, Fourth edn, 2011 Search PubMed.
- http://colormine.org/color-converter, accessed 8-Jan-2018.
- Z. Marczenko and M. Balcerzak, Separation, Preconcentration and Spectrophotometry in Inorganic Analysis, Amsterdam, The Netherlands, 2000 Search PubMed.
- Method 3500-Fe B, in Standard Methods for The Examination of Water and WasteWater, ed. E. W. Rice, R. B. Baird, A. D. Eaton and L. S. Clesceri, American Public Health Association, Washington, DC, 22nd edn, 2011 Search PubMed.
- Method 315 B, in EPA's Sampling and Analysis Methods, ed. L. H. Keith, CRC Press, Inc., United States of America, 2nd edn, 1996 Search PubMed.
- Methods 937.03, 970.13, in Official Methods of Analysis, AOAC INTERNATIONAL, Gaithersburg, MD, 17th edn, 2000 Search PubMed.
- P. F. Collins, H. Diehl and G. F. Smith, Anal. Chem., 1959, 31, 1862–1867 CrossRef CAS.
- J. T. Mitchell-Koch, K. R. Reid and M. E. Meyerhoff, J. Chem. Educ., 2008, 85, 1658–1659 CrossRef CAS.
- J. N. Miller and J. C. Miller, Statistics and Chemometrics for Analytical Chemistry, Pearson Education Limited, Harlow, England, Sixth edn, 2010 Search PubMed.
Footnote |
| † Electronic supplementary information (ESI) available: Additional figures and tables. See DOI: 10.1039/c8ra00209f |
| This journal is © The Royal Society of Chemistry 2018 |