 Open Access Article
UHPLC-Q-TOF-MS/MS-oriented characteristic components dataset and multivariate statistical techniques for the holistic quality control of Usnea†
Yiran Jinab,
Yinghua Maac,
Weiwei Xiea,
Ludan Houa,
Huijun Xua,
Kerong Zhangd,
Lantong Zhang *a and
Yingfeng Du*a
aDepartment of Pharmaceutical Analysis, School of Pharmacy, Hebei Medical University, Shijiazhuang, Hebei 050017, P. R. China. E-mail: zhanglantong@263.net; yingfengdu@hotmail.com; Fax: +86-311-86266419; Tel: +86-311-86266419 Tel: +86-311-86265625
bThe Second Hospital of Hebei Medical University, Shijiazhuang, Hebei 050000, P. R. China
cChildren's Hospital of Hebei Province, Shijiazhuang, Hebei 050031, P. R. China
dApplied Biosystems Trading Co., Ltd., Beijing Branch Office, Beijing 100027, China
First published on 24th April 2018
Abstract
The holistic quality evaluation of Traditional Chinese Medicine (TCM) is confronted with significant challenges due to its extreme chemical complexity. In this study, a sensitive strategy based on ultra-high-performance liquid chromatography-triple/time-of-flight mass spectrometry (UHPLC-Q-TOF-MS/MS) and chemometric analysis was established and validated for the qualitative and semi-quantitative analyses of characteristic components in Usnea. First, three mass spectrometry fragmentation patterns of phenolic acid standards were studied and summarized. Then, an extract of this herb was analyzed by the full-scan MS spectra and identified by extracted ion chromatography (XIC). Based on the abovementioned methods, a total of 38 compounds (8 dibenzofurans, 11 didepsides, 13 depsidones, and 6 mono-substituted phenyl rings) were identified. Subsequently, the qualities of Usnea samples from different regions were evaluated by the semi-quantitative analysis based on their relative peak areas. Furthermore, principal component analysis (PCA) was performed to compare the Usnea herbs and to find possible diagnostic chemical components. This novel and powerful strategy could provide a potential approach for the holistic quality control of TCM.
1. Introduction
Usnea belongs to the Usnea genus and originates from the dried lichen body of Usnea longissima Ach. It is mainly distributed in Sichuan, Yunnan, Zhejiang, and Shanxi provinces in China. For hundreds of years, this plant has been used in folk medicine to protect the liver, clear the heat, and remove the toxins as is recorded in several Materia Medica books such as “Compendium of Materia Medica” and “The Dictionary of Medicinal Plant”. Although it also exhibits antioxidant, antineoplastic, anti-allergic, antimicrobial, analgesic, antipyretic, cytotoxic, and antiviral properties in clinic, it is mainly known for its anti-inflammatory and anti-microbial properties in the treatment of cough and rheumatism.1–8 Simultaneously, it is often consumed as tea or as a healthy drink.9–11Phytochemical studies demonstrate that the members of Usnea genus contain phenolic acids, steroids, triterpenoids, and polysaccharides.12,13 Among them, the types of phenolic acids found in the lichens of Usnea genus mainly include dibenzofurans, didepsides, depsidones, and mono-substituted phenyls.13 Recently, phenolic acids were believed to be the main bioactive constituents in the lichens of Usnea genus due to their various activities such as anti-microbial, anti-cancer, and anti-inflammatory.14–16 However, according to the reports, only a few chemical ingredients have been isolated from Usnea.17,18 In our previous study, a large number of phenolic acids were detected in Usnea by MS, and most of them were at low levels.19 It is well-known that Traditional Chinese Medicine (TCM) is commonly believed to operate due to synergistic effects of all of the major and minor components in the medicines.20,21 Moreover, many factors such as different origins can affect the quality of TCM. Therefore, it is critically important to explore a more scientific, systematic, and strongly operated evaluation method that canhelp maintain the inherent qualities of TCMs so as to ensure their safety, efficacy, and batch-to-batch consistency. At present, as is observed in the recent studies, only a few quantitative markers have been selected for the quality evaluation of Usnea,22–24 which severely restricts its in-depth study and clinical application. Although a HPLC method has been developed for the analysis of usnic acid in this plant, this method mainly focuses on the quantitative determination of single components and also cannot reflect the intrinsic qualities of Usnea. Therefore, the in-depth studying of a qualitative and semi-quantitative analytical strategy on the basis of the active ingredients in Usnea is of great significance for its pharmacodynamics and comprehensive quality control.
Recently, HPLC coupled with Q-TOF-MS has been used in ingredient analysis and metabolite detections.25–27 Among the multifarious LC platforms, UHPLC holds advantages over HPLC because of its higher speed, higher detection sensitivity, increased specificity, and enhanced repeatability. In addition, Q-TOF-MS provides accurate precursor and product ion information with a mass error of less than 5 ppm, which authentically increases the characterization and dependability of the compound.28,29 The recent decade has witnessed an increasingly vital role of high-resolution mass spectrometry (HRMS) in complex chemical profiling and highly sensitive quantitative analysis of medicinal herbs. The HRMS system can provide the acquisition of full-scan MS spectra and fragment ion spectral datasets for compounds by virtue of on-line and off-line techniques, enabling the overall consideration of MS and MS/MS spectra for the identification of both target and non-target compounds. In previous studies, it was challenging and error-prone to monitor the relatively small signals from the complex chemical background in full-scan mass chromatograms.30,31 To detect as many metabolites as possible, a novel approach combining multiple mass defect filter (MMDF) and dynamic background subtraction (DBS)-dependent on-line data acquisition is used to identify the chemical composition that has explicit mass defect values.32 On the other hand, the effective multiple data-mining techniques involved in extracted ion chromatography (XIC), mass defect filtering (MDF), product ion filtering (PIF), and neutral loss filtering (NLF) are employed to further identify and analyze the compounds. Because of the combined use of the above-described techniques, the detection and identification of herbal components becomes easier and faster than before. Furthermore, multivariate statistical analysis methods such as PCA are performed to provide more information about the chemical differences in TCMs.33,34 These approaches can be used to process tremendous datasets of TCM samples by showing a two-dimensional space of the variable metabolic profile.
The aim of this study was to develop a novel analytical strategy for the comprehensive quality control of Usnea. First, the fragmentation patterns of three reference substances were studied and summarized. Then, a sensitive method based on on-line data acquisition combined with comprehensive data processing techniques was established for the identification of phenolic acids in Usnea. Next, a semi-quantitative analysis of Usnea samples based on the relative peak areas of the 38 identified compounds was performed in 25 batches of Usnea samples collected from various regions. Meanwhile, PCA was conducted to disclose the possible characteristic components resulting in quality differences in the Usnea samples. It is believed that this novel strategy could be valuable for the quality control of Usnea and other TCMs.
2. Materials and methods
2.1. Chemicals and materials
Usnic acid was purchased from Shanghai Sunny Bio-technology Co., Ltd. Diffractaic acid was obtained from Shanghai Yuanye Bio-technology Co., Ltd. Evernic acid was purchased from Shanghai Bohu Bio-technology Co., Ltd. The purities of the abovementioned ingredients were more than 98% according to HPLC analysis. HPLC-grade methanol (Tedia, USA), formic acid (Dikma Technologies Inc., USA), and ammonium acetate (Fisher Scientific, USA) were used in the mobile phase. Redistilled water was prepared in our own lab using the Milli-Q water purification system (Millipore, ELIX100, USA).2.2. Plant materials and sample preparation
Twenty-five batches of Usnea samples (Table 1) were acquired from different regions in China. The Usnea samples, identified by Prof. Lianhuai Li from Department of Pharmacognosy in Hebei Medical University, were deposited in the College of Pharmacy Laboratory of Hebei Medical University, Shijiazhuang, China.| Sample | Source | Collection time | Sample | Source | Collecting time |
|---|---|---|---|---|---|
| S1 | Zigong, Sichuan (AHBZ) | 2015.04 | S13 | Fanxiong, Yunnan (AHBZ) | 2015.04 |
| S2 | Zigong, Sichuan (AHBZ) | 2015.04 | S14 | Fanxiong, Yunnan (AHBZ) | 2015.04 |
| S3 | Zigong, Sichuan (AHBZ) | 2015.04 | S15 | Fanxiong, Yunnan (AHBZ) | 2014.04 |
| S4 | Zigong, Sichuan (AHBZ) | 2015.05 | S16 | Fanxiong, Yunnan (AHBZ) | 2015.05 |
| S5 | Zigong, Sichuan (AHBZ) | 2015.07 | S17 | Zigong, Sichuan (HBAG) | 2015.09 |
| S6 | Zigong, Sichuan (AHBZ) | 2015.09 | S18 | Zigong, Sichuan (HBAG) | 2015.09 |
| S7 | Zigong, Sichuan (AHBZ) | 2015.09 | S19 | Zigong, Sichuan (HBAG) | 2015.09 |
| S8 | Jinhua, Zhejiang (AHBZ) | 2015.04 | S20 | Jinhua, Zhejiang (HBAG) | 2015.09 |
| S9 | Jinhua, Zhejiang (AHBZ) | 2015.04 | S21 | Jinhua, Zhejiang (HBAG) | 2015.09 |
| S10 | Jinhua, Zhejiang (AHBZ) | 2015.04 | S22 | Jinhua, Zhejiang (HBAG) | 2015.09 |
| S11 | Jinhua, Zhejiang (AHBZ) | 2015.05 | S23 | Fanxiong, Yunnan (HBAG) | 2015.09 |
| S12 | Jinhua, Zhejiang (AHBZ) | 2015.05 | S24 | Fanxiong, Yunnan (HBAG) | 2015.09 |
| S25 | Fanxiong, Yunnan (HBAG) | 2015.09 |
Dried Usnea samples were crushed into fine powder so that they could be passed through 60 mesh screens. An amount of 0.1 g of Usnea powder was extracted with 25 mL of 100% methanol in an ultrasonic bath (40 kHz, 500 w) for 30 min. An additional quantity of 100% methanol was added to compensate for the lost weight. Then, the extracted solution was centrifuged for 10 min at 150![[thin space (1/6-em)]](https://www.rsc.org/images/entities/char_2009.gif) 000 rpm and filtered through a 0.2 μm GHP filter (Mfd. by Waters Corporation, USA). Afterwards, the supernatant was transferred to a clean polypropylene tube. An aliquot of 5 μL from each sample was injected into the UHPLC-Q-TOF-MS/MS system for further analysis.
000 rpm and filtered through a 0.2 μm GHP filter (Mfd. by Waters Corporation, USA). Afterwards, the supernatant was transferred to a clean polypropylene tube. An aliquot of 5 μL from each sample was injected into the UHPLC-Q-TOF-MS/MS system for further analysis.
2.3. Preparation of standard solutions
Reference standards were accurately weighed and then dissolved in methanol to yield standard stock solutions for usnic acid, evernic acid, and diffractaic acid at concentrations of 0.400 g L−1, 0.408 g L−1, and 0.392 g L−1, respectively. Then, each stock solution was mixed with methanol to prepare a final mixed standard solution. The working solutions were stored at 4 °C for further analysis.2.4. UPLC-Triple TOF-MS conditions
UHPLC-Q-TOF-MS/MS analysis was conducted on the Shimadzu UHPLC system (Kyoto, Japan) coupled with the triple TOF™ 5600+ MS/MS system (AB SCIEX, CA, USA). The chromatographic separation was accomplished on a Kinetex C18 (100 mm × 3.0 mm, 2.6 μm) column with a Security Guard UPLC C18 column (4.0 mm × 3.0 mm, 2.6 μm) (Phenomenex, Torrance, CA, USA), and the column oven was maintained at 25 °C. The mobile phase consisted of water containing 0.1% formic acid as well as 4 mmoL L−1ammonium acetate (A) and methanol (B) with a flow rate of 0.4 mL min−1. A binary gradient elution was employed, and the consecutive program was as follows: 5–75% B from 0 to 3 min, 75–85% B from 3 to 15 min, 85–95% B from 15 to 20 min, and 95–98% B from 20 to 25 min; later, the column was returned to its starting conditions for 30 min for column balance.The mass spectrometer with a Duo-Spray™ source was operated in the negative ion electrospray mode, and the parameters of the MS/MS detector were as follows: ion spray voltage: −4500 kV; turbo spray temperature: 550 °C; curtain gas: 25 psi; nebulizing gas (GAS1): 55 psi and TIS gas (GAS2): 55 psi; and declustering potential (DP): −60 V. For the full MS-IDA (information-dependent acquisition)-8MS/MS analysis, the eight most intense fragment ions of each analyte that exceeded 100 cps counts were selected for the survey scan, and the MS/MS experiments were run in the scan range from m/z 100 to m/z 1000 with 250 m of accumulation time for full MS and 100 m of accumulation time for MS/MS experiments. The collision energy (CE) was set at −30 eV, and the collision energy spread (CES) was 15 eV in the MS/MS experiments. The IDA criteria were given to ions that matched the mass defect window to obtain the MS/MS spectra. Simultaneously, real-time MMDF and DBS were used to fulfill the IDA criteria. To get convincing results, an automated calibration delivery system (CDS) was used to automatically calibrate MS and MS/MS with every 6 samples in our study.
The UHPLC-Q-TOF-MS data of the extracted samples were analysed using the PeakView® Software (AB SCIEX, CA, USA). The XIC manager tool in Master View® (AB Sciex, CA, USA) provided quasi-molecular weights, mass errors and isotope patterns. The possible compounds, their elemental compositions and chemical formulae could be calculated by screening the ChemSpider database.35 The predicted formula with errors less than ±5 ppm was searched against the compounds reported for Usnea to obtain tentative identification.
2.5. Analytical procedures
The chemical compound identification strategy was based on a Triple TOF instrument with DBS-dependent on-line data acquisition and multiple post data-mining tools. The analytic strategy is presented in detail as follows: first, the mass spectrometry cracking behaviors of the reference substances were studied, and the fragmentation patterns were summarized. Second, a full mass scan was performed, and accurate MS/MS data sets were obtained using an effective MMDF and DBS-dependent data acquisition method. The application of DBS could intelligently promote the ability of identification of drug-related MS/MS ions from the background and matrix-related MS/MS ions. Therefore, the lower-level of target compounds could be clearly captured. Third, post-acquisition data mining was obtained by using various data mining tools including XIC, MDF, PIF, and NLF. Finally, the compounds were identified on the basis of accurate mass measurements and previously investigated fragmentation regulations of reference substances.2.6. Semi-quantitative data and chemometric analysis
To evaluate the qualities of Usnea samples from different regions, a semi-quantitative analysis based on relative peak areas was introduced. PCA was applied to holistically observe the general clustering and trends among all samples using the SPSS 21.0 software (IBM SPSS, USA). The principal component (PC) score plots of the first 2 PCs were generated from the results of PCA.3. Results and discussion
3.1. Optimization of LC-MS/MS conditions
With the purpose of achieving an efficient and rapid analysis, a high pressure chromatographic column packed with 2.6 μm porous particles was applied in UPLC analysis. Different gradient elutions, flow rates (0.3, 0.4, and 0.5 mL min−1) and column temperatures (20, 25, and 30 °C) were optimized to achieve a higher effect of chromatography and mass spectrometry. Meanwhile, to enhance the signal response, mobile phase modifiers such as formic acid and ammonium acetate were also evaluated. A mobile phase containing 0.1% formic acid and 4 mmoL L−1 ammonium acetate improved the chromatographic behavior, reduced the peak tailing and facilitated ionization. The mobile phase at 25 °C with a flow rate of 0.4 mL min−1 was finally selected for the shorter analysis. Thus, all the detected compounds could be well separated within 25 min. As shown in Fig. 1, the representative XIC spectra of standards and samples were obtained under the abovementioned optimized conditions.Furthermore, the mass spectrometric conditions were optimized in positive and negative ion modes. The negative ion mode was selected because the ionization of phenolic acids was more efficient when compared with the positive ion mode. The parameter CE was optimized to get the richest relative abundance by appropriate fragmentation and molecular intensity. Collision-induced dissociation (CID) combined with a CE of −30 eV and CES of 15 eV was performed to obtain more fragmentation information for the elucidation of inferred compounds.
3.2. Establishment of qualitative analysis strategy
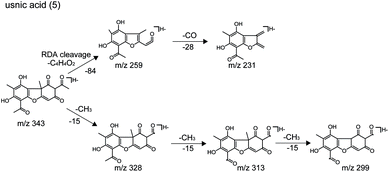
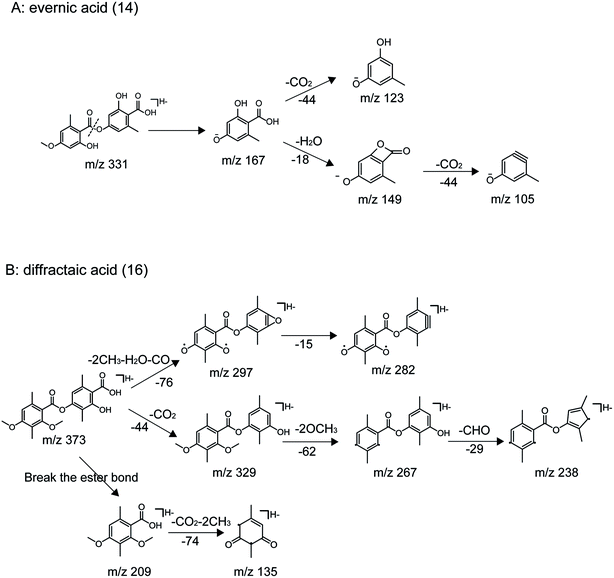
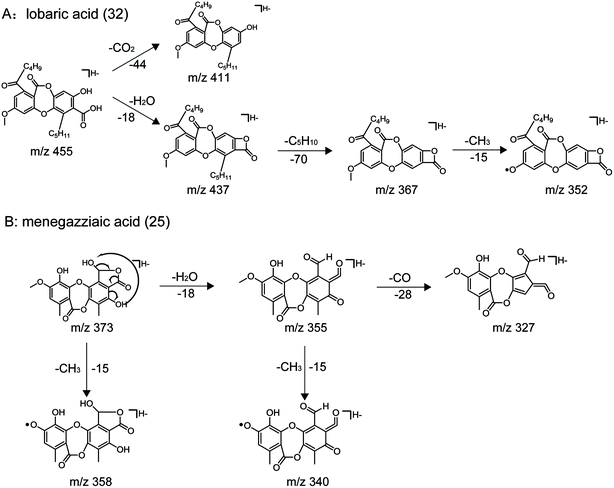
All Usnea samples were detected using the optimized HRMS methods. To rapidly identify the target and non-target compounds in the Usnea extracts, a powerful integrated analytical strategy using on-line data acquisition combined with multiple data processing techniques including database searching, reference standard comparison, TOF-MS information, and MS/MS data analysis was first employed for the unambiguous identification of constituents in the Usnea plant. The structures of the compounds having reference standards were deduced based on the retention times and HRMS data. At the same time, their cracking patterns were probed and summarized. On the contrary, the unknown constituents were deduced based on the high-accuracy [M − H]− precursor ion in the negative ion mode using the XIC Manager software. The next step was to search for a possible compound in the established Usnea characteristic components data set and then, the candidate structures were tentatively deduced from MS/MS spectrogram, the fragmentation patterns of reference standards, and the data of the reported literatures. As known, it is difficult to differentiate isomers because they have the same molecular formula. A certain degree of difference was presented in their retention times and chemical structures with lower energies. The minimized energy value and steric hindrance were used to account for the stability of the molecule. The minimized energy values were provided by the program ChemOffice 14.0 (CambridgeSoft, USA).3.3. Compounds identified in Usnea
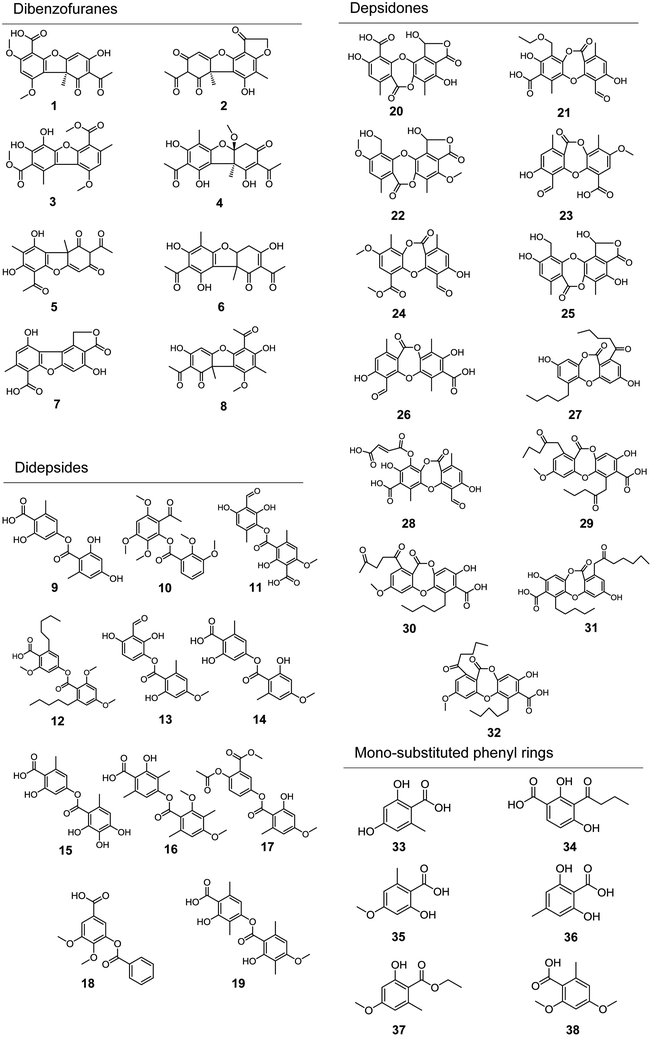
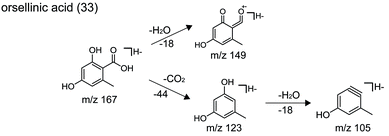
Applying the abovementioned methods, a total of 38 components (8 dibenzofurans, 11 didepsides, 13 depsidones, and 6 mono-substituted phenyl rings) were identified in Usnea samples. Among them, three compounds (including usnic acid, diffractaic acid and evernic acid) were unambiguously characterized via comparison with chemical standards in terms of retention times and mass spectra. Their structures are shown in Fig. 2, and their detailed MS data are shown in Table 2.| No. | Molecular formula | [M − H]− m/z | Error (ppm) | tR (min) | MS/MS fragments | Identification |
|---|---|---|---|---|---|---|
| 1 | C18H16O8 | 359.0772 | −1.0 | 6.306 | 359.0781, 344.0547, 275.0561, 257.0459, 229.0507 | (S)-8-Acetyl-7-hydroxy-1,3-dimethoxy-9a-methyl-9-oxo-9,9a-dihydrodibenzo[b,d]furan-4-carboxylic acid |
| 2 | C18H14O7 | 341.0667 | −0.5 | 6.316 | 341.0638, 326.0407, 311.0191, 257.0448, 229.0509 | (R)-Benzo[b]furo[3′,2′:3,4]benzo[1,2-d]furan-1,6(2H,5bH)-dione, 7-acetyl-5,8-dihydroxy-4,5b-dimethyl |
| 3 | C19H18O8 | 373.0928 | −0.2 | 8.386 | 373.0928, 358.0662, 341.0659, 326.0426, 311.0197, 298.0471 | Dimethyl 3,4-dihydroxy-9-methoxy-1,7-dimethyldibenzo[b,d]furan-2,6-dicarboxylate |
| 4 | C19H20O8 | 375.1085 | −1.1 | 8.960 | 375.1085, 343.0818, 315.0854, 259.0601, 231.0653 | Placodiolic |
| 5 | C18H16O7 | 343.0823 | −0.6 | 12.446 | 343.0815, 328.0584, 313.0345, 299.0904, 259.0598, 231.0652 | Usnic acid |
| 6 | C18H18O7 | 345.0980 | −0.9 | 12.437 | 345.0905, 330.0643, 315.0433, 261.0624, 233.1527 | Isohydrousnic acid |
| 7 | C16H10O7 | 313.0354 | −0.5 | 12.446 | 313.0344, 269.0486, 257.0454, 241.0478, 229.0483, 213.0184 | Porphyrillic acid |
| 8 | C19H18O7 | 357.0980 | −0.1 | 15.694 | 357.0987, 342.0751, 314.0434, 286.0478, 273.0763, 245.0817 | 1,1′-(3,7-Dihydroxy-9-methoxy-8,9b-dimethyl-1-oxo-1,9b-dihydrodibenzo[b,d]furan-2,6-diyl)bis(ethan-1-one) |
| 9 | C16H14O7 | 317.0667 | −0.8 | 5.558 | 317.0663, 255.0642, 167.0350, 149.0239, 123.0449, 105.0347 | Lecanoric acid |
| 10 | C20H22O8 | 389.1242 | −0.6 | 5.620 | 389.2910, 343.0633, 313.1075, 283.0964, 225.0749, 193.0303, 151.0758 | 2-Acetyl-3,5,6-trimethoxyphenyl 2,3-dimethoxybenzoate |
| 11 | C18H16O9 | 375.0722 | −1.4 | 6.002 | 375.1000, 357.0557, 343.0816, 329.2327, 301.0750, 167.0335 | Vermicularin |
| 12 | C27H36O7 | 471.2388 | 0.6 | 7.121 | 471.2986, 425.2879 | Planaic acid |
| 13 | C18H16O8 | 359.0772 | −1.0 | 7.997 | 359.0765, 331.0617, 167.0353, 149.0252 | Hemathamnol |
| 14 | C17H16O7 | 331.0823 | −1.1 | 8.095 | 331.0827, 167.0353, 149.0246, 123.0453, 105.0350 | Evernic acid |
| 15 | C16H14O8 | 333.0616 | 4.3 | 8.117 | 333.0878, 167.0345, 149.0240, 123.0449, 105.0342 | Diploschistesic acid |
| 16 | C20H22O7 | 373.1293 | −1.3 | 9.709 | 373.1297, 329.1392, 297.1133, 282.0900, 267.0667, 238.0997, 209.0820, 165.0926, 135.0814 | Diffractaic acid |
| 17 | C19H18O8 | 373.0929 | −0.2 | 9.709 | 373.1297, 329.1392, 297.1133, 282.0900, 209.0820, 165.0926, 135.0814 | 4-Acetoxy-3-(methoxycarbonyl)phenyl 2-hydroxy-4-methoxy-6-methylbenzoate |
| 18 | C16H14O6 | 301.0718 | −0.5 | 12.461 | 301.0688, 286.0481, 271.0237, 258.0505, 242.0558 | 3-(Benzoyloxy)-4,5-dimethoxybenzoic acid |
| 19 | C19H20O7 | 359.1131 | −1.4 | 13.013 | 359.1141, 181.0501, 163.0396, 137.0605 | Barbatic acid |
| 20 | C18H12O10 | 387.0358 | −2.4 | 4.591 | 387.0355, 369.0221, 343.0457, 341.0324, 325.0343, 297.0405, 269.0450 | Norperistictic acid |
| 21 | C20H18O9 | 401.0878 | −0.7 | 4.775 | 401.0876, 357.0625, 333.2269, 313.0708 | Cetraric acid |
| 22 | C20H18O9 | 401.0878 | −0.7 | 5.341 | 401.0867, 383.2700, 355.0763, 269.0818 | 1-Hydroxy-11-(hydroxymethyl)-4,10-dimethoxy-5,8-dimethyl-7H-benzo[6,7][1,4]dioxepino[2,3-e]isobenzofuran-3,7(1H)-dione |
| 23 | C18H14O8 | 357.0616 | −0.8 | 5.549 | 357.0604, 342.0455, 314.0420, 313.0805, 286.0458 | Psoromic acid |
| 24 | C19H16O8 | 371.0772 | −0.8 | 6.633 | 371.0745, 356.0547, 341.0308, 313.0383, 285.0407 | Methyl psoromate |
| 25 | C18H14O9 | 373.0565 | −0.9 | 7.054 | 373.0564, 358.0329, 355.0455, 327.0518, 271.0222 | Menegazziaic acid |
| 26 | C18H14O8 | 357.0616 | −2.6 | 8.091 | 357.0632, 313.0708, 270.0498, 227.0690 | Virensic acid |
| 27 | C23H26O6 | 397.1657 | −1.9 | 9.329 | 397.1649, 355.1528, 326.0805, 313.1025 | Norlobaridone |
| 28 | C22H16O12 | 471.0569 | −1.4 | 9.713 | 471.0597, 427.0293, 383.0380 | Fumaroprotocetraric acid |
| 29 | C25H26O9 | 469.1504 | 0.4 | 9.784 | 469.1374, 425.1444, 381.1532, 323.2563 | Glomellonic acid |
| 30 | C25H26O9 | 469.1504 | 0.4 | 10.281 | 469.1873, 451.1872, 425.1962, 381.2097 | Oxolobaric acid |
| 31 | C26H30O8 | 469.1504 | −1.2 | 10.424 | 469.1862, 425.1917, 381.2074, 310.1284 | Physodic acid |
| 32 | C25H28O8 | 455.1711 | −0.2 | 13.083 | 455.1719, 437.1562, 411.1817, 367.1892, 352.1664 | Lobaric acid |
| 33 | C8H8O4 | 167.0350 | 0.5 | 5.556 | 167.0357, 149.0251, 123.0461 | Orsellinic acid |
| 34 | C11H12O5 | 223.0612 | 0.3 | 7.041 | 223.0611, 205.0494, 181.0499, 179.0705, 163.0389, 137.0592, 119.0498 | 3-Butyryl-β-resorcylic acid |
| 35 | C9H10O4 | 181.0506 | 1.9 | 7.492 | 181.0485, 163.0520, 137.0595, 122.0357 | Everninic acid |
| 36 | C8H8O4 | 167.0350 | 0.5 | 8.107 | 167.0337, 149.0220, 123.0435, 105.0330 | 2,6-Dihydroxy-4-methylbenzoic acid |
| 37 | C11H14O4 | 209.0820 | 0.9 | 9.608 | 209.0611, 180.0603, 164.9451, 134.9485, 121.0296 | Everninate ethyl |
| 38 | C10H12O4 | 195.0663 | 0.5 | 13.373 | 195.0292, 177.0184, 165.0555, 163.0393, 151.0397, 133.0284, 123.0456 | 2,4-Dimethoxy-6-methylbenzoic acid |
3.4. Semi-quantitative analysis of Usnea samples
To overcome the serious restriction due to lack of reference standards, a feasible semi-quantitative approach on the single herb was developed to evaluate the differences in the qualities of Usnea samples. It was reported that semi-quantitative analysis was successfully used to assess the quality of different batches of the Niuhuang Shangqing pill;38 this analysis could compare the differences between the qualities of various batches. Thus, a semi-quantitative assay was introduced to appraise the similarities and differences in the qualities of the 25 batches of Usnea samples obtained from different sources. At the same time, the main chemical markers affecting the quality of this herb were checked out. In regard to semi-quantitation of Usnea samples, peaks of 38 compositions in the 25 batches were identified and then, their absolute peak areas were recorded in succession. Meanwhile, sample no. 1 was selected as the reference sample based on the previous quantitative study by HPLC-ESI-MS/MS.22 After the absolute peak areas of 38 compounds in the other 24 samples were respectively divided by those in sample no. 1, the relative peak areas (RPAs) were obtained. The absolute peak areas and the relative peak areas of 38 compounds are presented in Tables S1 and S2,† respectively.To further evaluate the quality differences and find the possible characteristic components in Usnea samples, PCA was performed on the basis of the calculated RPAs, and the results exhibited remarkable group segregations and potentially significant components. The first two principle components (PC1 and PC2) with more than 75.2% of the total variance were extracted for analysis; among them, PC1 accounted for 56.9% of the variance and PC2 accounted for 18.3% of the variance. As seen in Table S3,† PC1 included strong contributions from most components except the compounds 3, 8, 13, 21, 22, and 29; PC2 was directly correlated with the compounds 3 and 8. Consistent with the above-mentioned direct data, a graphical illustration is also presented in Fig. 7A. Compound 5 and other compounds such as 1, 2, 6, 7, 9, 11, 12, 18, 20, 24, 25, 27, 32, and 34 were located apart from the above-mentioned components. The results suggested that the compounds 1, 2, 6, 7, 9, 11, 12, 18, 20, 24, 25, 27, 32, and 34 might be the possible diagnostic chemical markers in Usnea samples like usnic acid (5). Pharmacological experiments have proved that usnic acid is a natural active ingredient in Usnea and a broad-spectrum anti-bacterial component. Thus, the consideration of the compounds together with usnic acid as quantitative indicators for further quality control of Usnea herbs is very meaningful.39,40
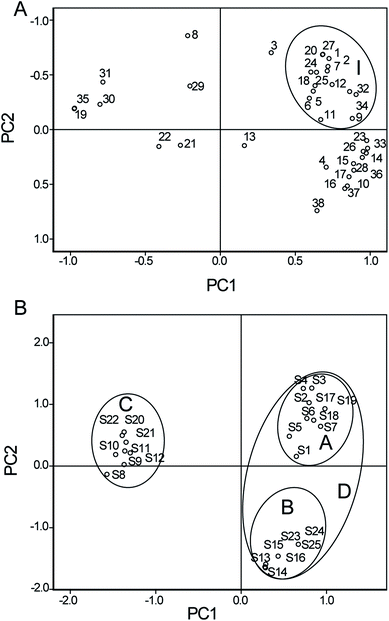 | ||
| Fig. 7 Loading plots (A) and score plots (B) for the compounds of Usnea longissima Ach. obtained from different origins. | ||
As can be seen clearly in Fig. 7B, all the samples were clearly clustered in three domains. Samples S1–S7 and S17–S19 were in circle A (from Sichuan province in China), samples S8–S12 and S20–S22 were in circle B (from Yunnan province in China), and samples S13–S16 and S23–S25 were in circle C (from Zhejiang province in China). The results showed that there was a quality difference in Usnea herbs obtained from different origins. Moreover, the circle D characterized by positive scores on PC1 was located apart from circle B, which suggested potential similarities between the qualities of Usnea samples obtained from the Yunnan province and Sichuan province. It was also plausible that the place of origin could have an impact on the quality of Usnea.
4. Conclusions
A novel analysis strategy based on UHPLC-Q-TOF-MS/MS integrated with multivariate statistical analysis methods was developed and used for the holistic quality control of Usnea herbs. The fragmentation patterns of phenolic acids in Usnea were summarized for the first time. A total of 38 phenolic compounds (8 dibenzofurans, 11 didepsides, 13 depsidones, and 6 mono-substituted phenyl rings) were identified. Then, a semi-quantitative analysis was performed in Usnea samples, and PCA was conducted to evaluate the quality of the Usnea samples. The results showed that there were obvious differences in the qualities of the Usnea samples obtained from different regions, and the main factors influencing these qualities were picked out. The proposed method provided a solution for the comprehensive quality assessment of not only Usnea herbs but also other TCMs.Funding sources
This study received financial support from the National Natural Science Foundation of China (No. 81402894), the Key Projects of Hebei Education Department (No. ZD2017244), the Project of Hebei Province Food and Drug Administration (No. ZD2015021, No. ZD2015029) and the Project of Hebei Province Traditional Chinese Medicine Administration (No. 2014139).Conflicts of interest
The authors declare no competing financial interest.Acknowledgements
Thanks for instrument support from the Department of Pharmaceutical Analysis, School of Pharmacy, Hebei Medical University.References
- C. Bezivin, S. Tomasi, F. L. Devehat and J. Boustie, Phytomedicine, 2003, 10, 499–503 CrossRef CAS PubMed.
- B. Simon-Haarhaus and C. M. Schempp, J. Photochem. Photobiol., B, 2007, 89, 9–14 CrossRef PubMed.
- I. Zizovic, J. Ivanovic, D. Misic, M. Stamenic, S. Djordjevic and J. Kukic-Markovic, J. Supercrit. Fluids, 2012, 72, 7–14 CrossRef CAS.
- F. Rancan, S. Rosan, K. Boehm, E. Fernandez and M. E. Hidalgo, J. Photochem. Photobiol., B, 2002, 68, 133–139 CrossRef CAS.
- Y. Yamamot, Y. Miura, Y. Kinoshita, M. Higuchi, Y. Yamada, A. Murakami, H. Ohigashi and K. Koshimizu, Chem. Pharm. Bull., 1995, 43, 1388–1390 CrossRef.
- M. Halici, F. Odabasoglu, H. Suleyman, A. Cakir, A. Aslan and Y. Bsyir, Phytomedicine, 2005, 12, 656–662 CrossRef CAS PubMed.
- I. C. Muhammad, J. S. Azizuddin and U. R. Atta, Phytochemistry, 2005, 66, 2346–2350 CrossRef PubMed.
- Y. Q. Su, H. H. Wang, Y. M. Ma, R. Q. Li, G. Koichiro and M. Shinji, J. Northwest Univ., 2006, 21, 154–155 Search PubMed.
- J. Li, Preparation of Chinese medicinal oral liquid containing green tea for preventing and treating oral ulcer, Faming Zhuanli Shenqing, 2014 Search PubMed , CN 104173885 A 20141203.
- G. Wang, Method for preparing spiral black tea (usnea), Faming Zhuanli Shenqing, 2010 Search PubMed , CN 101715857 A 20100602.
- S. Cheng, A health tea with effects of clearing away liver heat and purging pathogenic fire and its preparation method, Faming Zhuanli Shenqing, 2010 Search PubMed , CN 101715857 A 20100602.
- Y. Nishitoba, I. Nishimura, T. Nishiyama and J. Mizutani, Phytochemistry, 1987, 26, 3181–3185 CrossRef CAS.
- Laxinamujila, H. J. Bao and T. Bau, Zhongguo Zhongyao Zazhi, 2013, 38, 539–545 CAS.
- Y. Bayir, F. Odabasoglu, A. Cakir, A. Aslan, H. Suleyman, M. Halici and C. Kazaz, Phytomedicine, 2006, 13, 584–590 CrossRef CAS PubMed.
- K. R. Thallita, E. C. Fares, M. V. Laura, P. A. D. S. Joao, F. D. R. Ricardo, A. D. B. H. P. Matheus, L. R. F. Jose, A. S. A. Adriano, C. F. M. Jose and P. G. Daniel, Toxicol. in Vitro, 2012, 26, 304–314 CrossRef PubMed.
- A. A. Shtro, V. V. Zarubaev, O. A. Luzina, D. N. Sokolov, O. I. Kiselev and N. F. Salakhutdinov, Bioorg. Med. Chem., 2014, 22, 6826–6836 CrossRef CAS PubMed.
- M. P. Polovinka, M. T. Egorycheva, N. G. Vlasenko and N. F. Salakhutdinov, Khim. Interesakh Ustoich. Razvit., 2012, 20, 713–720 CAS.
- M. A. Fanovich, J. Ivanovic, I. Zizovic, D. Misic and D. Jaeger, Mater. Sci. Eng., C, 2016, 58, 204–212 CrossRef CAS PubMed.
- Y. H. Ma, T. T. Tian, W. W. Xie, Y. R. Jin, H. J. Xu, L. T. Zhang and Y. s F. Du, Chin. Tradit. Herb. Drugs, 2016, 47, 392–400 CAS.
- H. M. Zhang, S. L. Li, H. Zhang, Y. Wang, Z. L. Zhao, S. L. Chen and H. X. Xu, J. Pharm. Biomed. Anal., 2012, 62, 258–273 CrossRef CAS PubMed.
- J. Jin, Y. B. Li, E. K. Tanui, L. W. Han, Y. Jia, L. Zhang, Y. M. Wang, X. X. Zhang and Y. J. Zhang, J. Ethnopharmacol., 2013, 147, 357–365 CrossRef CAS PubMed.
- Y. H. Ma, T. T. Tian, W. W. Xie, Y. R. Jin, H. J. Xu, L. T. Zhang and Y. F. Du, Zhongguo Zhongyao Zazhi, 2015, 40, 4884–4889 CAS.
- M. F. Fang, H. Wang, Y. Wu, Q. L. Wang, X. F. Zhao, X. H. Zheng, S. X. Wang and G. F. Zhao, Bull. Korean Chem. Soc., 2013, 34, 1684–1688 CrossRef CAS.
- C. V. N. S. Silva, M. S. Ferraz, N. K. Honda, M. C. B. Lira and N. S. Santos-Magalhaes, Lat. Am. J. Pharm., 2012, 31, 120–124 CAS.
- L. Yi, Y. L. Ouyang, X. Sun, N. Y. Xu, R. J. Linhavalt and Z. Q. Zheng, J. Chromatogr. A, 2015, 1423, 79–85 CrossRef CAS PubMed.
- J. A. Padilla-Sanchez and L. S. Haug, J. Chromatogr. A, 2016, 1445, 36–45 CrossRef CAS PubMed.
- L. L. He, Z. F. Zhang, L. Y. Lu, Y. Liu, S. Li, J. G. Wang, Z. J. Song, Z. G. Yan and J. H. Miao, J. Pharm. Biomed. Anal., 2016, 117, 125–139 CrossRef PubMed.
- Y. X. Wang, H. P. Hao, G. J. Wang, P. F. Tu, Y. Jiang, Y. Liang, L. Pai, H. Yang, L. Lai, C. N. Zheng, Q. Wang, N. Cui and Y. T. Liu, Talanta, 2009, 80, 572–580 CrossRef CAS PubMed.
- W. Si, W. Z. Yang, D. Guo, J. Wu, J. X. Zhang, S. Qiu, C. H. Yao, Y. J. Cui and W. J. Wu, J. Pharm. Biomed. Anal., 2016, 117, 510–521 CrossRef CAS PubMed.
- M. A. Farag, S. T. Sakna, N. M. El-fiky, M. M. Shabana and L. A. Wessjohann, Phytochemistry, 2015, 119, 41–50 CrossRef CAS PubMed.
- Z. F. Zhang, L. L. He, L. Y. Lu, Y. Liu, G. T. Dong, J. H. Miao and P. Luo, J. Pharm. Biomed. Anal., 2015, 109, 62–66 CrossRef CAS PubMed.
- T. Xie, Y. Liang, H. P. Hao, A. Jiye, L. Xie, P. Gong, C. Dai, L. S. Liu, A. Kang, X. Zheng and G. J. Wang, J. Chromatogr. A, 2012, 1227, 234–244 CrossRef CAS PubMed.
- S. J. Li, H. Lin, C. Qu, Y. P. Tang, J. Shen, W. X. Li, S. J. Yue, J. Kai, G. X. Shang, Z. H. Zhu, C. B. Zhang, P. Liu, H. Yan, L. Zhang, L. Qian, D. W. Qian and J. A. Duan, J. Ethnopharmacol., 2015, 170, 175–183 CrossRef CAS PubMed.
- W. J. Zhou, J. Z. Song, W. W. Fu, H. S. Tan, Z. X. Bian and H. X. Xu, J. Pharm. Biomed. Anal., 2013, 84, 59–68 CrossRef CAS PubMed.
- A. Masia, M. Ibanez, C. Blasco, J. V. Sancho, Y. Pico and F. Hernandez, Anal. Chim. Acta, 2013, 761, 117–127 CrossRef CAS PubMed.
- C. X. Yin, C. Li, L. Peng, L. L. Tang, M. Z. Yang, H. Zhang and Y. L. Xiao, J. Yunnan Nor. Univ., 1996, 16, 56–61 Search PubMed.
- P. Z. Cong and S. Y. Li, Natural Organic Spectroscopy, 2002, pp. 1284–1296 Search PubMed.
- D. D. Wang, J. Liang and W. Z. Yang, J. Pharm. Biomed. Anal., 2014, 89, 130–141 CrossRef CAS PubMed.
- V. Taresco, I. Francolini, F. Padella, M. Bellusci, A. Boni, C. Innocenti, A. Martinelli, L. Pllario and A. Piozzi, Mater. Sci. Eng. C, 2015, 52, 72–81 CrossRef CAS PubMed.
- Z. Q. Su, Z. Z. Mo, J. B. Liao, X. X. Feng, Y. Z. Liang, X. Zhang, Y. H. Liu, X. Y. Chen, Z. W. Chen, Z. R. Su and X. P. Lai, Int. Immunopharmacol., 2014, 22, 371–378 CrossRef CAS PubMed.
Footnote |
| † Electronic supplementary information (ESI) available. See DOI: 10.1039/c8ra00081f |
| This journal is © The Royal Society of Chemistry 2018 |


