 Open Access Article
Effect of multi-walled carbon nanotubes on the physical properties and crystallisation of recycled PET/TPU composites
Changqing Fang *ab,
Rong Yanga,
Zisen Zhanga,
Xing Zhoua,
Wanqing Leiab,
Youliang Chenga,
Wei Zhanga and
Dong Wangab
aFaculty of Printing, Packing Engineering and Digital Media Technology, Xi’an University of Technology, Xi’an 710048, P. R. China. E-mail: fcqxaut@163.com
bFaculty of Mechanical and Precision Instrument Engineering, Xi’an University of Technology, Xi’an 710048, P. R. China
First published on 28th February 2018
Abstract
Thermoplastic polyurethane (TPU) was blended with recycled polyethylene terephthalate (rPET) to prepare rPET/thermoplastic polyurethane (TPU) composites. Meanwhile, multiple-walled carbon nanotubes (MWCNTs) were employed as a reinforcing filler to study the synergistic effect between CNTs and rPET/TPU composites. The effect of CNT content on the morphology and micro-structure of the composites was investigated using a scanning electron microscope (SEM) and X-ray diffraction (XRD). The thermal properties were characterized using differential scanning calorimetry (DSC), thermogravimetric analysis (TGA) and dynamic mechanical analysis (DMA). The mechanical properties were investigated using tensile tests and hardness measurements. The results showed that TPU was compatible with rPET. The existence of rPET changed the crystalline phase and affected the glass transition and crystallisation temperature of the TPU matrix. The rPET/TPU composites displayed poor thermal stability and tensile properties when compared to pure TPU. The addition of CNTs had no effect on the crystalline phase of the rPET/TPU composites. Due to the occurrence of interfacial adhesion between the CNTs and rPET, the CNTs displayed an offset effect on the reaction of rPET and decreased the rigidity of the molecular chain in the rPET/TPU composites. The thermal stability and tensile strength of the CNTs/rPET/TPU composites improved with an increase in CNT content.
1. Introduction
As is known, poly(ethylene terephthalate) (PET) is a typical semi-crystalline thermoplastic polymer with good thermal and mechanical properties. It is used extensively in disposable beverage bottles and food packaging owing to its nontoxic nature, durability and crystal clear transparency.1–4 With the considerable consumption of food and beverages, flexible manufacturing, printed electronics, etc., PET waste has increased drastically.5 The use of PET not only brings about serious environmental problems, but also causes a shortage of energy as it is not a biodegradable material. Hence, recycling of waste PET products has become an increasingly hot issue around the world.At present, there are two commonly employed methods for recycling PET waste: physical recycling and chemical recycling. Physical recycling methods, i.e. polymer blending, provide a new way to recycle waste, offering an opportunity to use PET as a modifying agent in blended polymer materials for commercial applications.6 In previous studies, the blending of polymer materials with recycled PET has been investigated. Many works have been devoted to exploring polymer–polymer microfibrillar reinforced composites, such as PET/high density polyethylene (HDPE),6 PET/low density polyethylene (LDPE),7,8 PET/isotactic polypropylene (iPP)9,10 and PET/concrete composites.4,11 PET not only increases the tensile properties of polymers but also improves the dead load and acid resistance of concrete building materials.
Thermoplastic polyurethane (TPU) is a kind of polymer material that has excellent physical properties and bio-compatibility. It is widely used in daily life, and in the fields of industry, agriculture and medicine, such as in roller systems, tread, automotives, wire and cable and biomedical products.12 It is known that the elastomer polymer materials can be reinforced via blending with a rigid thermoplastic material. For example, V. Jašo et al.13 prepared TPU/polylactic acid (PLA) composites, and found that the composites had an improved tensile strength and retained relatively high elongation. A rigid thermoplastic material PET has also been used to blend with TPU elastomers in previous work;14 Manfred et al.14 set the heat temperature of an extruder to 220 °C, which was below the melt temperature of the PET material. Hence, TPU and PET were proved to be incompatible. Polymer matrix-added carbon nanotubes (CNTs) have received considerable attention over nearly two decades as some of the properties of polymer–polymer microfibrillar reinforced composites are not yet perfect. Due to their high strength and high elastic modulus along with their large aspect ratio, CNTs have been proved to be an effective reinforcing element in CNTs/polymer composites.1,12,15–17 The nucleation effect occurs between CNTs and semi-crystalline polymers since CNTs have a similar chain-like structure to polymer molecular chains, which can accelerate the crystallization kinetics of polymer matrices. The properties of CNT-based polymer composites greatly depend on the interfacial interaction between the CNTs and the polymer matrix.18,19 For example, Chen et al.18 investigated the effect of CNT content on the strain sensitivity and shape memory behavior of CNTs/PU composites. Steinert et al.20 studied the electrical properties of PET/carbon nanotube composite films, and found that the electrical conductivity was very susceptible to the content and dispersion of CNTs. The electrical properties of the PET/CNTs nanocomposites containing only 1 wt% MWCNTs were nine orders of magnitude higher than those of pure PET.21 CNTs are also used to modify the properties of polymer–polymer composites.22–24 For example, when the content of MWCNTs was 5 wt% in PET/LDPE blends (mass ratio = 20![[thin space (1/6-em)]](https://www.rsc.org/images/entities/char_2009.gif) :
:![[thin space (1/6-em)]](https://www.rsc.org/images/entities/char_2009.gif) 80), Cardinaud et al.22 found that the MWCNTs had little effect on the rheological properties of the blends. The melt viscosity increased as the content of the MWCNTs increased. Most researchers have only proven the effect of the interfacial interactions of CNTs on the properties of a single polymer such as PET and TPU or other polymer–polymer composites. However, little research has focused on exploring the effect of CNTs on the properties of PET/TPU composites, especially for waste PET.
80), Cardinaud et al.22 found that the MWCNTs had little effect on the rheological properties of the blends. The melt viscosity increased as the content of the MWCNTs increased. Most researchers have only proven the effect of the interfacial interactions of CNTs on the properties of a single polymer such as PET and TPU or other polymer–polymer composites. However, little research has focused on exploring the effect of CNTs on the properties of PET/TPU composites, especially for waste PET.
Hence, in this work, we prepared rPET/TPU composites with the aim of recycling waste PET and introducing different amounts of CNTs into the composite to further analyze the relationship between the CNT content and the properties of the CNTs/rPET/TPU composites. To the best of our knowledge, this is the first study on the effect of CNTs on the properties of rPET/TPU composites, and it was found that rPET and TPU have good compatibility and the CNTs have an offset effect on the rPET/TPU composites. The composite products can be used in packing bags for express service packages. It is meaningful to protect the environment and turn waste into treasure.
2. Experimental
2.1 Materials
Waste PET mineral water bottles were collected and utilized. After removing the caps and labels, the bottles were cut into flakes (average size 5 mm × 5 mm) which were washed with alcohol, hydrochloric acid and deionized water to remove adhesive materials and dust, and then dried at room temperature. The melt flow index of the waste PET flakes was 15.12 g s−1 (at a load of 0.35 g). Multi-walled carbon nanotubes (MWCNTs) were purchased from Beijing BOYU GAOKE New Materials Co., Ltd. China. Their diameter was 20–40 nm and their length was about 10–30 μm. Hydrochloric acid (HCl, 37 wt%) was purchased from Sichuan XILONG Chemical Reagent Co., Ltd. China. Deionized water was used in the process of cleaning the PET sheets. TPU (tradename of Elastollan), with a density of 1.14 g cm−3 and a vicat softening point temperature of about 116 °C, was purchased from Dongguan city Zhangmutou embellish plastic raw materials sales department.2.2 Sample preparation
Before the blending process, the CNTs were treated with concentrated nitric acid at 60 °C for 10 h and then dried in a drying oven for 3 h at 400 °C for the purpose of obtaining purified CNTs.25 The TPU pellets and PET flakes were dried at 80 °C for 10 h. The mass ratio of rPET and TPU was 1![[thin space (1/6-em)]](https://www.rsc.org/images/entities/char_2009.gif) :
:![[thin space (1/6-em)]](https://www.rsc.org/images/entities/char_2009.gif) 10. The prepared mixture was placed in a double-screw extruder (SHJ-35, Nanjing, China) at a set temperature profile of 260 °C, 260 °C, 245 °C, 230 °C, 220 °C, 200 °C. The feed speed was set at 10 rpm. In this work, the mass ratio of rPET and TPU was 1
10. The prepared mixture was placed in a double-screw extruder (SHJ-35, Nanjing, China) at a set temperature profile of 260 °C, 260 °C, 245 °C, 230 °C, 220 °C, 200 °C. The feed speed was set at 10 rpm. In this work, the mass ratio of rPET and TPU was 1![[thin space (1/6-em)]](https://www.rsc.org/images/entities/char_2009.gif) :
:![[thin space (1/6-em)]](https://www.rsc.org/images/entities/char_2009.gif) 10. The CNT content was varied from 0.3 wt% to 2 wt% relative to the mass of rPET. For the sake of comparison, pure TPU and rPET/TPU (mass ratio = 1
10. The CNT content was varied from 0.3 wt% to 2 wt% relative to the mass of rPET. For the sake of comparison, pure TPU and rPET/TPU (mass ratio = 1![[thin space (1/6-em)]](https://www.rsc.org/images/entities/char_2009.gif) :
:![[thin space (1/6-em)]](https://www.rsc.org/images/entities/char_2009.gif) 10) were also processed under the same conditions. The abbreviations of the composites synthesized from rPET, TPU and CNTs (0.3 wt%, 0.5 wt%, 0.75 wt%, 1 wt% and 2 wt% relative to the mass of rPET) are defined as rPET/TPU1C, rPET/TPU2C, rPET/TPU3C, rPET/TPU4C and rPET/TPU5C, respectively (as shown in Table 1). The composites were then compression-molded in a hot press machine (JXF, Shanghai, China). Firstly, the samples were heated for 10 min at a melt temperature of 200 °C and compressed at a pressure of 19 MPa. Then, they were compressed at 23 MPa for 5 min and deflated for 2 min, and this was performed twice. Finally, the samples were repressed at 23 MPa for 5 min to obtain sheets with a thickness of 1.6 mm.
10) were also processed under the same conditions. The abbreviations of the composites synthesized from rPET, TPU and CNTs (0.3 wt%, 0.5 wt%, 0.75 wt%, 1 wt% and 2 wt% relative to the mass of rPET) are defined as rPET/TPU1C, rPET/TPU2C, rPET/TPU3C, rPET/TPU4C and rPET/TPU5C, respectively (as shown in Table 1). The composites were then compression-molded in a hot press machine (JXF, Shanghai, China). Firstly, the samples were heated for 10 min at a melt temperature of 200 °C and compressed at a pressure of 19 MPa. Then, they were compressed at 23 MPa for 5 min and deflated for 2 min, and this was performed twice. Finally, the samples were repressed at 23 MPa for 5 min to obtain sheets with a thickness of 1.6 mm.
| Sample | rPET/TPU1C | rPET/TPU2C | rPET/TPU3C | rPET/TPU4C | rPET/TPU5C |
|---|---|---|---|---|---|
| CNTs | 0.5 | 0.5 | 0.5 | 0.5 | 0.5 |
| PET | 166.67 | 100 | 66.67 | 50 | 25 |
| TPU | 1666.7 | 1000 | 666.7 | 500 | 250 |
| CNTs/PET (wt%) | 0.3 | 0.5 | 0.75 | 1 | 2 |
2.3 Morphology
The morphology of the samples was observed using a scanning electron microscope (SEM) JSM-6700M with an accelerating voltage of 1 kV. The samples were fractured in liquid nitrogen and the fractured surfaces were observed.XRD analysis of the samples was performed using an XRD-7000 (SHIMADZU LIMITED, Japan). All of the samples were scanned at 2θ angles from 10–70° and a scanning speed of 8.00 deg min−1.
2.4 Thermal properties
Differential scanning calorimetry (DSC) analysis was carried out using NETZSCH DSC200F3 equipment. The masses of the samples were approximately 5–10 mg. Firstly, the measurements were conducted at a heating rate of 10 °C min−1 from −80 °C to 250 °C, and then maintained for 1 min at 250 °C in order to eliminate the thermal history, the system was then cooled to −80 °C at 10 °C min−1, and finally reheated to 250 °C at 10 °C min−1 under a nitrogen flow to obtain the glass transition temperature (Tg), crystallisation temperature (Tc), melt temperature (Tm), crystallisation enthalpy (ΔHc) and melting enthalpy (ΔHm).The thermal stability of the samples was measured using thermogravimetric analysis (TGA) with a NETZSCH TG209F3. The weight of the samples was 5–10 mg. Tests were conducted with a nitrogen flow rate of 30 ml min−1 at a heating rate of 10 °C min−1 from 30 to 600 °C.
2.5 Dynamic mechanical analysis (DMA)
Dynamic mechanical analysis (DMA) was performed using a METTLER TOLEDO DMA 1 STARe system. Tests were conducted in the tensile module, at 1 Hz and a heating rate of 3 °C min−1 from −100 to 150 °C. A rectangular strip (dimensions 20 mm × 10 mm × 1.6 mm) was cut from the hot pressed sheet.2.6 Mechanical properties
The tensile properties of the samples were investigated using a universal tensile machine at a cross head speed of 50 mm min−1 and at room temperature. Tests were performed using a dumb-bell specimen (according to ISO527-2/1BA/50). The gauge length and thickness of the specimen were 31.7 mm and 1.6 mm, respectively.2.7 Hardness testing
The hardness testing of the composite samples was conducted using a TH200 Shore A durometer, according to GB/T531-92. Samples were cut from the hot pressed sheets. At least five points were tested for each sample to obtain an average, and the distance between two points was 6 mm.2.8 Fourier transform infrared spectrometry (FT-IR)
FT-IR was performed on a film on KBr formed tablets to characterize the purified CNTs, and the FT-IR spectra were recorded as a film on KBr formed tablets under a vacuum press in the spectrophotometer (SHIMADIU FTIR-8400S (CE)), in the wave band ranging from 400 to 4000 cm−1. An average of 128 scans were run to reach a resolution of 4.0 cm−1.2.9 Raman spectra
Raman testing was performed on a LabRAM HR 800 (HORIBA JOBIN YVON) using a 633 nm excitation line from a HeNe laser with a power of about 0.5 mW. The wavenumber range was 100–3500 cm−1.3. Results and discussion
3.1 Morphological characterization
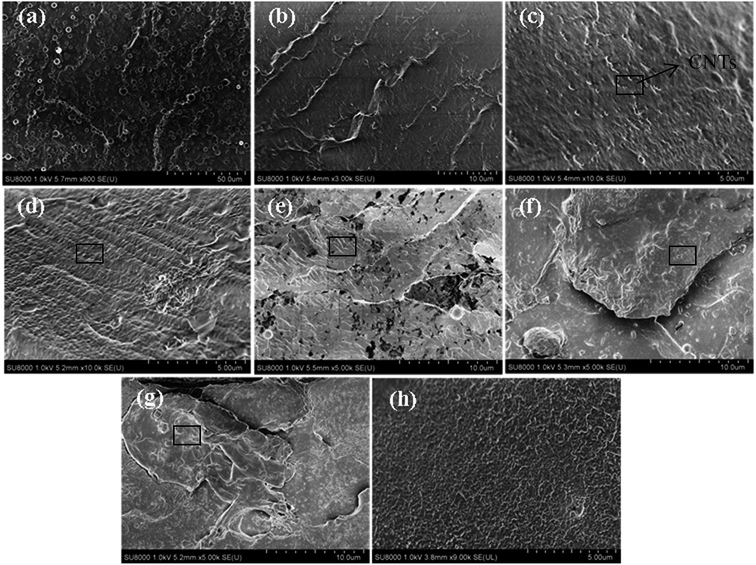
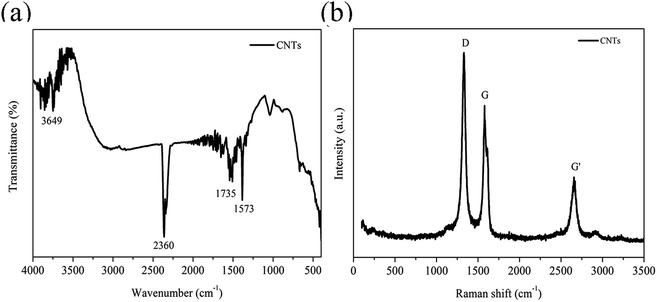
Micrographs of the cryogenically fractured surfaces of pure TPU and CNTs/rPET/TPU composites are shown in Fig. 1. Pure TPU showed typical block copolymer morphology, with the spheres representing the hard segment phase and the base representing the soft segment phase. The fractured surface of pure rPET was flat and pure rPET displayed a homogeneous continuous phase. As shown in Fig. 1(b–g), all of the micrographs displayed a single-phase structure, suggesting that TPU was compatible with rPET in this work. It is easy to observe that there are obvious differences in the distribution of the soft and hard segments. The existence of rPET changed the typical morphology of TPU.In order to characterize the surface of the purified CNTs, FT-IR and Raman testing were also adopted. As shown in Fig. 2a, the FT-IR spectrum of the purified CNTs showed characteristic peaks corresponding to the stretching of C–C at 1573 cm−1, the C![[double bond, length as m-dash]](https://www.rsc.org/images/entities/char_e001.gif) O stretching in –COOH at 1735 cm−1 along with –OH at 3649 cm−1, suggesting that the surface of the CNTs is made up of hydroxyl groups and carboxyl groups. Fig. 2b shows the Raman spectrum of the purified CNTs, and the peaks at 1327 cm−1, 1579 cm−1 and 2656 cm−1 are assigned to the D mode, G mode and G′ mode, respectively. The D mode represents lattice defects. The ratio of ID/IG is ca. 1.16, which indicates the degree of functionalization of the purified CNTs. After introducing purified CNTs into the rPET/TPU composites, short CNT microfibers exposed on the matrix surface can be observed [Fig. 1c and d]. With increasing CNT content, the distribution of short microfibers in the samples became more dense. In composites with 0.75 to 2 wt% CNTs [Fig. 1e–g], there were no short microfibers and the CNTs were wrapped in the composites, revealing the stronger interfacial adhesion between the CNTs and the rPET/TPU composites. This is because after being acidified, the surface of the CNTs was made up of hydroxyl groups, carboxyl groups and other groups, which increases the dispersion of the carbon nanotubes in the rPET/TPU composites. Also, since CNTs have a similar chain-like structure to polymer molecular chains, the nucleation effect occurs between the CNTs and the composite, which can contribute to interfacial adhesion in the matrix. The composites with 1 and 2 wt% CNTs had a homogeneous phase morphology. A more homogeneous phase morphology appeared in the composite with 2 wt% CNTs and most of the CNTs were in contact with each other, showing obvious interfacial adhesion between the CNTs and the matrix. In all of the samples, good bonding between the CNT microfiber phase and the matrix was observed, moreover, no serious aggregation morphology appeared and the CNTs exhibited a homogeneous dispersion in the matrix.
O stretching in –COOH at 1735 cm−1 along with –OH at 3649 cm−1, suggesting that the surface of the CNTs is made up of hydroxyl groups and carboxyl groups. Fig. 2b shows the Raman spectrum of the purified CNTs, and the peaks at 1327 cm−1, 1579 cm−1 and 2656 cm−1 are assigned to the D mode, G mode and G′ mode, respectively. The D mode represents lattice defects. The ratio of ID/IG is ca. 1.16, which indicates the degree of functionalization of the purified CNTs. After introducing purified CNTs into the rPET/TPU composites, short CNT microfibers exposed on the matrix surface can be observed [Fig. 1c and d]. With increasing CNT content, the distribution of short microfibers in the samples became more dense. In composites with 0.75 to 2 wt% CNTs [Fig. 1e–g], there were no short microfibers and the CNTs were wrapped in the composites, revealing the stronger interfacial adhesion between the CNTs and the rPET/TPU composites. This is because after being acidified, the surface of the CNTs was made up of hydroxyl groups, carboxyl groups and other groups, which increases the dispersion of the carbon nanotubes in the rPET/TPU composites. Also, since CNTs have a similar chain-like structure to polymer molecular chains, the nucleation effect occurs between the CNTs and the composite, which can contribute to interfacial adhesion in the matrix. The composites with 1 and 2 wt% CNTs had a homogeneous phase morphology. A more homogeneous phase morphology appeared in the composite with 2 wt% CNTs and most of the CNTs were in contact with each other, showing obvious interfacial adhesion between the CNTs and the matrix. In all of the samples, good bonding between the CNT microfiber phase and the matrix was observed, moreover, no serious aggregation morphology appeared and the CNTs exhibited a homogeneous dispersion in the matrix.
X-ray diffraction analysis was carried out to investigate the development of the crystalline phase in all of the samples. TPU is a typical segmented copolymer that consists of alternating soft polyester and hard polyurethane–urea segments. At a certain temperature, these segments show micro-phase separation, forming hard and soft phases.17 As shown in Fig. 3, one characteristic diffraction peak of pure TPU appeared at 2θ = 21.52°, which corresponds to the soft segments of segmented PU.26 Pure rPET displayed two diffraction peaks, at 22.42° and 25.82°. The characteristic diffraction peak of rPET/TPU composites was at 2θ = 19.38°, and the change in the position of the soft segment in segmented PU was attributed to the introduction of rPET, which contains ester groups (–COOR) crystalline regions,27 suggesting that the existence of rPET can change the crystalline phase of the TPU matrix. For the CNTs/rPET/TPU composites, it can be clearly observed that there are two diffraction peaks at 2θ = 19.38° and 25.94°. The peak that appears at 25.94° was related to the multi-wall interlayer spacing of the nanotubes d002,28,29 as observed in the curve of the CNTs sample. There were no changes in the position and relative intensity of the rPET/TPU composite diffraction peak throughout the whole range of the CNTs/rPET/TPU composites, indicating that the addition of CNTs does not change the crystalline phase of rPET/TPU composites.
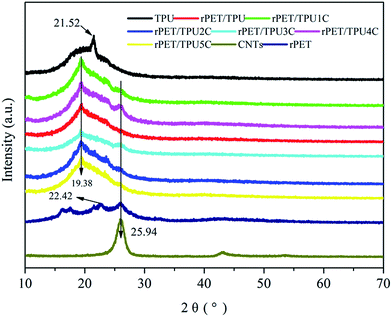 | ||
| Fig. 3 XRD patterns of pure rPET, pure TPU, purified CNTs and rPET/TPU and CNTs/rPET/TPU composites. | ||
3.2 Thermal characterization
The compatibility of several component polymers can be investigated using DSC analysis. The thermal properties can offer insight into the interaction between components in the composites. Table 2 shows the glass transition (Tg), crystallisation (Tc) and melt (Tm) temperature, and the crystallisation (ΔHc) and melting enthalpy values (ΔHm) of pure rPET, pure TPU and rPET/TPU and CNTs/rPET/TPU composites. DSC curves are shown in Fig. 4. Pure TPU has a glass transition at around −36.2 °C and rPET at −15.2 °C. Pure TPU melted at 121.8 and 179.2 °C. The rPET/TPU and CNTs/rPET/TPU composites displayed only one glass transition each at −29.6 °C and about −34.5 °C, respectively, indicating good compatibility between rPET and TPU materials in this work. The glass transition and crystallisation temperature of the TPU phase were affected by the presence of rPET. This was because the addition of rPET introduced a rigid benzene ring molecule, increasing the rigidity of the molecular chain, and resulting in an increase in the Tg of the composite. Although the previous study showed that CNTs can not alter the glass transition of TPU apparently,12 the change between the Tg of rPET/TPU and CNTs/rPET/TPU composites clearly confirmed the mitigating effects of CNTs. This may be attributed to the offset effect of purified CNTs on the reaction of rPET, which decreased the rigidity of the molecular chain in the rPET/TPU composites. This could be due to the occurrence of the nucleation effect between the purified CNTs and the rPET matrix, which may increase the interfacial interaction between the CNTs and the rPET matrix and improve the rigidity of the rPET/TPU composite molecular chain. However, for the CNTs/rPET/TPU composites, with the addition of CNTs, the Tg of the composites showed no striking change. This may be because the amount of CNTs was too small to induce strong effects.| Sample | Heating process | |||||
|---|---|---|---|---|---|---|
| Tg (°C) | ΔCp (J g−1 K−1) | Tm (°C) | ΔHm (J g−1) | Tc (°C) | ΔHc (J g−1) | |
| TPU | −36.2 | 0.04 | 121.8, 179.2 | 2.74, 1.43 | 101.3 | 14.24 |
| rPET/TPU | −29.6 | 0.09 | 188.2 | 0.50 | 141.4 | 0.33 |
| rPET/TPU1C | −34.0 | 0.10 | 203.7 | 2.50 | 144.3 | 10.3 |
| rPET/TPU2C | −34.7 | 0.11 | 193.3 | 5.71 | 151.4 | 12.81 |
| rPET/TPU3C | −34.3 | 0.09 | 203.0 | 2.28 | 147.5 | 6.47 |
| rPET/TPU4C | −35.1 | 0.14 | 193.2 | 5.68 | 153.1 | 12.43 |
| rPET/TPU5C | −34.9 | 0.07 | 204.0 | 1.43 | 146.2 | 3.87 |
| PET | −15.2 | 0.03 | — | — | — | — |
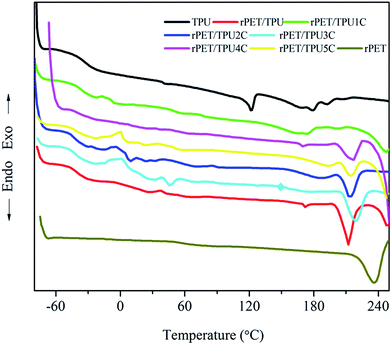 | ||
| Fig. 4 DSC thermograms of fibers from pure rPET, pure TPU and rPET/TPU and CNTs/rPET/TPU composites. | ||
The heat capacity change (ΔCp) is proportional to the quantity of amorphous regions in the specimen.30 With the addition of rPET, the ΔCp of rPET/TPU composites showed an increasing trend when compared to pure TPU. However, there was no striking change in the CNTs/rPET/TPU composites, which suggested that the introduction of rPET increased the amorphous region of the TPU matrix and the CNTs could not change the amorphous region of the rPET/TPU composites apparently. This result was consistent with the XRD analysis.
The thermal stability of the composites was investigated using TGA under a nitrogen atmosphere. The TGA and DTG curves of the prepared pure TPU, pure rPET and rPET/TPU and CNTs/rPET/TPU composites are shown in Fig. 5. The data, including the temperature for 5% (T5%), 10% (T10%) and 50% (T50%) mass loss and the maximum weight loss rate (Tmax), are summarized in Table 3. As shown in Fig. 5, there were two main degradation stages from 30 to 600 °C in the pure TPU and composite samples. The first decomposition stage, between 300 °C and 375 °C, usually corresponds to the decomposition of urethane groups (–NH–COO–) in the hard segment.31 The second stage, between 380 °C and 410 °C, may be ascribed to the polyol segments.27 Pure rPET displayed only one decomposition stage, between 380 °C and 480 °C, corresponding to the decomposition of polyol segments. This result suggests that rPET and CNTs can not change the thermal degradation mechanism of polymer composites. From Table 3 and Fig. 5a, it can be seen that T5% and T10% for the rPET/TPU and CNTs/rPET/TPU composites were lower than that for pure TPU and pure rPET, indicating that the thermal stability of TPU and rPET was better than that of all the composites. This may suggest that the existence of rPET affected the formation and degradation of urethane groups (–NH–COO–) in the hard segment of the TPU matrix, as seen in the XRD analysis. The change in the onset degradation temperature among the CNTs/rPET/TPU composites depended on the content and distribution status of the CNTs, a more even distribution resulted in better stability and interfacial adhesion in the composites, which can also be proved using SEM analysis. However, in the second decomposition, with the addition of CNTs, the thermal stability of the CNTs/rPET/TPU composites showed an increasing trend. When the CNT content exceeded 0.5 wt%, the composite had a better thermal stability when compared to pure TPU. For example, when the weight loss was 50%, the temperature of the rPET/TPU2C sample was at 395.5 °C but for pure TPU it was at about 394.28 °C. This may be attributed to the OH group of the CNTs obtained by the acidizing treatment. The larger the amount of CNTs, the greater the formation of polyol segments.
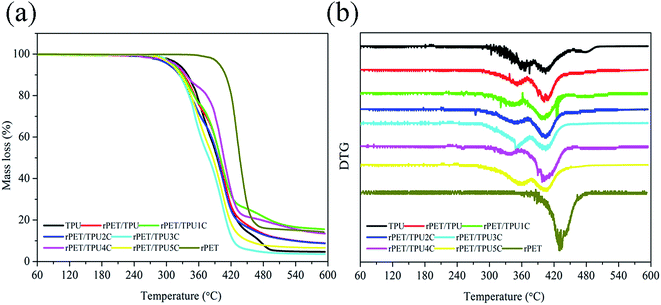 | ||
| Fig. 5 (a) TGA and (b) DTG thermograms of pure rPET, pure TPU and rPET/TPU and CNTs/rPET/TPU composites. | ||
| Sample | TPU | rPET/TPU | rPET/TPU1C | rPET/TPU2C | rPET/TPU3C | rPET/TPU4C | rPET/TPU5C | rPET |
|---|---|---|---|---|---|---|---|---|
| T5% (°C) | 322.10 | 310.15 | 308.76 | 307.82 | 312.19 | 312.73 | 317.47 | 398.72 |
| T10% (°C) | 339.27 | 324.36 | 326.84 | 324.04 | 331.71 | 329.46 | 336.51 | 409.64 |
| T50% (°C) | 394.28 | 378.79 | 386.43 | 395.5 | 399.24 | 399.98 | 406.75 | 436.20 |
| Tmax (°C) | 404.78 | 403.20 | 403.73 | 403.74 | 401.98 | 400.40 | 403.71 | 429.4 |
3.3 Dynamic mechanical properties
In order to further study the morphology of the composites, the dynamic mechanical properties of the composites were investigated using DMA measurements. Fig. 6 shows the curves of the storage modulus (E′) and tan delta for pure TPU, pure rPET and rPET/TPU and CNTs/rPET/TPU composites versus temperature. The corresponding parameters are shown in Table 4. From Fig. 6a, it can be seen that pure TPU displayed the highest storage modulus and the rPET/TPU composites showed a poor modulus, indicating that the existence of rPET resulted in poor mechanical properties. This was because, as shown in the TGA and XRD analysis, rPET affected the formation of urethane groups (–NH–COO–) in the hard segment of the TPU matrix and induced the appearance of a discontinuous TPU phase, which caused the poor mechanical properties. For the CNTs/rPET/TPU composites, the modulus showed an apparently increasing trend with an increase in CNT content, especially at temperatures below Tg.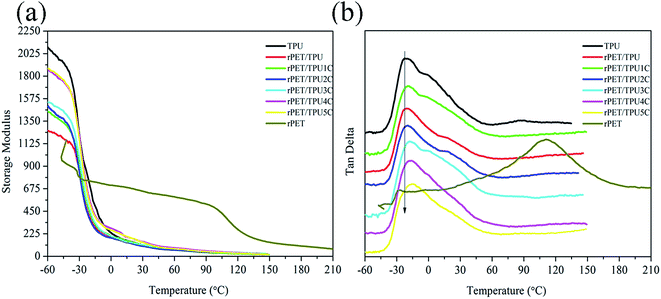 | ||
| Fig. 6 Dynamic mechanical properties of pure rPET, pure TPU and rPET/TPU and CNTs/rPET/TPU composites. (a) Storage modulus, (b) tan delta. | ||
| Sample | TPU | rPET/TPU | rPET/TPU1C | rPET/TPU2C | rPET/TPU3C | rPET/TPU4C | rPET/TPU5C | rPET |
|---|---|---|---|---|---|---|---|---|
| Tg (°C) | −22.40 | −15.60 | −19.51 | −19.53 | −17.75 | −16.10 | −20.12 | −26.62 |
As shown in Fig. 6b and Table 4, only one peak can be seen in all of the curves, suggesting good compatibility between rPET and TPU materials. The Tg of the rPET/TPU composites was higher than that of pure TPU and rPET, indicating that the introduction of rPET increased the molecular chain rigidity of the TPU matrix. This can possibly be attributed to the lower mobility of the soft segments in TPU confined in the rigid continuous PET phase.32 With the increase of CNTs, the Tg of CNTs/rPET/TPU composites showed a decreasing trend. This may be because the existence of purified CNTs allows interfacial adhesion between the CNTs and rPET, which offsets the rigid action from rPET to some extent, resulting in better flexibility of the polymer chain. The results are in agreement with the DSC analysis.
3.4 Mechanical properties
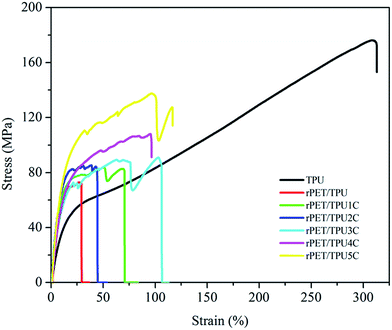
The mechanical properties of the composites are associated with composition and morphology (Table 5).6,32,33 As depicted in Fig. 7, all of the samples showed typical elastomeric behavior and no yield points, i.e. the relationship between stress and strain was directly proportional. For the CNTs/rPET/TPU composites, the tensile strength gradually increased with the increase in CNT content, which may be attributed to the excellent mechanical properties of CNTs. Table 5 shows an elongation of about 320% for pure TPU, an elongation of about 100% for the composites with 0.75, 1 and 2 wt% CNTs, and an elongation below 80% for the composites with 0 to 0.5 wt%, indicating that the existence of rPET induced the appearance of a discontinuous TPU phase and the CNTs displayed an offset effect on the reaction of rPET. There was interfacial adhesion between PET and the purified CNTs, which may lead to the change in the mechanical properties, which can also be observed using DMA analysis. Higher interfacial adhesion may induce an increase in the tensile strength and elongation, and lower interfacial adhesion may induce a significant decline in elongation. The elastic modulus of the CNTs/rPET/TPU composites with a CNT content ranging from 0 to 2 wt% was more than 6 times higher than that of pure TPU, and similar results also appear in other polymer nanocomposite systems, such as PET/LDPE blends.33 From Table 5, it can be seen that with increasing CNT content, the hardness of the composites has a similar tendency to the tensile strength because the introduction of CNTs contributes to interfacial adhesion in the matrix and improves the hardness of the composites. In this section, the results show that one can modify the material properties via blending modification to obtain satisfactory properties of hardness and good tensile strength under the right proportion conditions.| Sample | Tensile strength (MPa) | Elongation at break (%) | Elastic modulus (MPa) | Shore A |
|---|---|---|---|---|
| TPU | 176.12 | 313.08 | 8.43 | — |
| rPET/TPU | 72.82 | 29.51 | 78.97 | 80.3 |
| rPET/TPU1C | 83.73 | 70.91 | 45.86 | 83.1 |
| rPET/TPU2C | 85.35 | 44.70 | 78.26 | 83.9 |
| rPET/TPU3C | 90.87 | 106.53 | 90.28 | 84.3 |
| rPET/TPU4C | 107.98 | 96.74 | 57.37 | 89.9 |
| rPET/TPU5C | 137.65 | 116.89 | 81.18 | 93.1 |
4. Conclusions
In this work, thermoplastic polyurethane (TPU) was blended with recycled polyethylene terephthalate (rPET) to prepare rPET/thermoplastic polyurethane (TPU) composites. CNTs/rPET/TPU composites with different CNT amounts were prepared. The results showed that TPU was compatible with rPET. The existence of rPET changed the crystalline phase and affected the glass transition and crystallisation temperature of the TPU matrix. The rPET/TPU composites displayed poor thermal stability and tensile properties when compared to pure TPU. The addition of CNTs had no effect on the crystalline phase of rPET/TPU composites. This was because of the occurrence of interfacial adhesion between CNTs and rPET, the CNTs displayed an offset effect on the reaction of rPET and decreased the rigidity of the molecular chain in the rPET/TPU composites. The thermal stability and tensile strength of the CNTs/rPET/TPU composites improved with an increase in CNT content.Conflicts of interest
There are no conflicts to declare.Acknowledgements
The authors acknowledge the financial support provided by Programs for New Century Excellent Talents in University of Ministry of Education of China (Grant No. NCET-12-1045), Shaanxi Programs for Science and Technology Development (Fund No. 2010K01-096), Key Program for Innovation Team in Shaanxi Province, Ph.D. Innovation fund projects of Xi’an University of Technology (Fund No. 310-252071501), and Program for Innovation Team in Xi’an University of Technology (Grant No. 108-25605T401).References
- H. Chen, Z. Liu and P. Cebe, Chain confinement in electrospun nanofibers of PET with carbon nanotubes, Polymer, 2009, 50, 872–880 CrossRef CAS.
- Y. Asakuma, K. Nakagawa and K. Maeda, Theoretical study of the transesterification reaction of polyethylene terephthalate under basic conditions, Polym. Degrad. Stab., 2009, 94, 240–245 CrossRef CAS.
- G. M. M. Sadeghi and M. Sayaf, From PET waste to novel polyurethanes, Mater. Recyc. Trend. Persp., 2012 Search PubMed.
- I. M. Nikbin, R. R. Saman and H. Allahyari, Feasibility study of waste poly ethylene terephthalate (PET) particles as aggregate replacement for acid erosion of sustainable structural normal and lightweight concrete, J. Cleaner Prod., 2016, 126, 108–117 CrossRef.
- S. R. Shukla, A. M. Harad and L. S. Jawale, Chemical recycling of PET waste into hydrophobic textile dyestuffs, Polym. Degrad. Stab., 2009, 94, 604–609 CrossRef CAS.
- C. Jiang, X. Xu and Z. Li, Application of in situ microfibrillization to recycling ultraviolet-aged poly(ethylene terephthalate) (PET) and high density polyethylene (HDPE), J. Macromol. Sci., Part B: Phys., 2007, 1, 10–25 CrossRef.
- S. Park, K. Park and K. Suh, Compatibilizing effect of isocyanate functional group on polyethylene terephthalate/low density polyethylene blends, J. Polym. Sci., Part B: Polym. Phys., 2015, 36, 447–453 CrossRef.
- K. Jayanarayanan, S. Thomas and K. Joseph, Effect of blend ratio on the mechanical and sorption behaviour of polymer–polymer microfibrillar composites from low-density polyethylene and polyethylene terephthalate, J. Reinf. Plast. Compos., 2012, 31, 549–562 CrossRef CAS.
- X. Yi and L. Xu, Morphology and properties of isotactic polypropylene/poly(ethylene terephthalate) in situ microfibrillar reinforced blends: influence of viscosity ratio, Eur. Polym. J., 2010, 46, 719–730 CrossRef CAS.
- C. Ji, M. Xie and B. Chang, β-Crystal in injection moulded poly(ethylene terephthalate) fibre/isotactic polypropylene composite, Composites, Part A, 2013, 46, 26–33 CrossRef CAS.
- R. Borg, O. Baldacchino and L. Ferrara, Early age performance and mechanical characteristics of recycled PET fibre reinforced concrete, Constr. Build. Mater., 2016, 108, 29–47 CrossRef CAS.
- J. Chen, Z. X. Zhang and W. B. Huang, Carbon nanotube network structure induced strain sensitivity and shape memory behavior changes of thermoplastic polyurethane, Mater. Des., 2015, 69, 105–113 CrossRef CAS.
- V. Jašo, M. V. Rodić and Z. S. Petrović, Biocompatible fibers from thermoplastic polyurethane reinforced with polylactic acid microfibers, Eur. Polym. J., 2015, 63, 20–28 CrossRef.
- R. Manfred, P. Jurgen and R. Thomas, Reactive polymer blends with thermoplastic polyurethane, Makromol. Chem., Macromol. Symp., 1991, 50, 203–214 CrossRef.
- S. Xu, W. Yu and M. Jing, Largely Enhanced Stretching Sensitivity of Polyurethane/CNTs Nanocomposites via Incorporation of Cellulose Nanofiber, J. Phys. Chem. C, 2017, 121, 4 Search PubMed.
- S. S. Mahapatra, S. K. Yadav and H. J. Yoo, Tailored and strong electro-responsive shape memory actuation in carbon nanotube-reinforced hyperbranched polyurethane composites, Sens. Actuators, B, 2014, 193, 384–390 CrossRef CAS.
- D. Alhazov, A. Gradys and P. Sajkiewicz, Thermo-mechanical behavior of electrospun thermoplastic polyurethane nanofibers, Eur. Polym. J., 2013, 49, 3851–3856 CrossRef CAS.
- J. Chen, Z. X. Zhang and W. B. Huang, Carbon nanotube network structure induced strain sensitivity and shape memory behavior changes of thermoplastic polyurethane, Mater. Des., 2015, 69, 105–113 CrossRef CAS.
- J. Z. Xu, G. J. Zhong and B. S. Hsiao, Low-dimensional carbonaceous nanofiller induced polymer crystallization, Prog. Polym. Sci., 2014, 39, 555–593 CrossRef CAS.
- B. W. Steinert and D. R. Dean, Magnetic field alignment and electrical properties of solution cast PET–carbon nanotube composite films, Polymer, 2009, 50, 898–904 CrossRef CAS.
- S. Mallakpour and V. Behranvand, Application of recycled PET/carboxylated multi-walled carbon nanotube composites for Cd2+, adsorption from aqueous solution: a study of morphology, thermal stability, and electrical conductivity, Colloid Polym. Sci., 2017, 295, 1–10 Search PubMed.
- R. Cardinaud and T. Mcnally, Localization of MWCNTs in PET/LDPE blends, Eur. Polym. J., 2013, 49, 1287–1297 CrossRef CAS.
- Y. Shi, W. Zhang and J. Yang, Super toughening of the poly(L-lactide)/thermoplastic polyurethane blends by carbon nanotubes, RSC Adv., 2013, 3, 26271–26282 RSC.
- Z. Liu, H. Bai and Y. Luo, Achieving a low electrical percolation threshold and superior mechanical performance in poly(L-lactide)/thermoplastic polyurethane/carbon nanotubes composites via tailoring phase morphology with the aid of stereocomplex crystallites, RSC Adv., 2017, 7, 11076–11084 RSC.
- X. Zhou, C. Fang and Y. Li, Preparation and characterization of Fe3O4-CNTs magnetic nanocomposites for potential application in functional magnetic printing ink, Composites, Part B, 2016, 89, 295–302 CrossRef CAS.
- V. García-Pacios and V. Costa, Affect of polydispersity on the properties of waterborne polyurethane dispersions based on polycarbonate polyol, Int. J. Adhes. Adhes., 2010, 30, 456–465 CrossRef.
- C. Q. Fang, W. Q. Lei and X. Zhou, Preparation and characterization of waterborne polyurethane containing PET waste/PPG as soft segment, J. Appl. Polym. Sci., 2015, 132, 45 Search PubMed.
- M. Endo and K. Takeuchi, Stacking nature of grapheme layers in carbon nanotubes and nanofibres, J. Phys. Chem. Solids, 1997, 58, 1707 CrossRef CAS.
- S. Hashmi, H. Prasad and R. Abishera, Improved recovery stress in multi-walled-carbon-nanotubes reinforced polyurethane, Mater. Des., 2015, 67, 492–500 CrossRef CAS.
- X. Zhou, C. Q. Fang and W. Q. Lei, Thermal and Crystalline Properties of Waterborne Polyurethane by in situ water reaction process and the potential application as biomaterial, Prog. Org. Coat., 2017, 1–10 CrossRef.
- X. Lai, Y. Shen and L. Wang, Preparation and properties of self-crosslinkable polyurethane/silane hybrid emulsion, J. Polym. Res., 2011, 18, 2425–2433 CrossRef CAS.
- V. Jašo, M. Cvetinov and S. Rakić, Bio-plastics and elastomers from polylactic acid/thermoplastic polyurethane blends, J. Appl. Polym. Sci., 2014, 131, 547–557 CrossRef.
- S. Fakirov, H. Kamo and M. Evstatiev, Microfibrillar reinforced composites from PET/LDPE blends: morphology and mechanical properties, J. Macromol. Sci., Part B: Phys., 2004, 43, 775–789 CrossRef.
| This journal is © The Royal Society of Chemistry 2018 |

