DOI:
10.1039/C7RA13570J
(Paper)
RSC Adv., 2018,
8, 6709-6718
Effect of a pH-controlled co-precipitation process on rhodamine B adsorption of MnFe2O4 nanoparticles
Received
22nd December 2017
, Accepted 4th February 2018
First published on 12th February 2018
Abstract
We investigated the effect of a pH-controlled co-precipitation process on the adsorption behavior of manganese ferrite (MnFe2O4) nanoparticles as well as their structural and magnetic properties. The pH of prepared MnFe2O4 nanoparticles is typically an important factor affecting the adsorption capacity of an adsorbent. In this study, MnFe2O4 nanoparticles were prepared using a co-precipitation method at four different pH values of 9.0, 9.5, 10.0, and 10.5. The adsorption behaviors on rhodamine B (RhB) by MnFe2O4 nanoparticles prepared at different pH values were investigated. It was found that, via a pH-controlled process, MnFe2O4 nanoparticles prepared at pH 10.5 showed the highest RhB removal efficiency. The results indicated that the large pore size and surface charge of MnFe2O4 nanoparticles improved the adsorption capacities for RhB. Kinetic data were fitted to a pseudo-second order kinetic model and revealed that equilibrium was reached within 60 min. The isotherm data showed that the Langmuir maximum adsorption capacity of the MnFe2O4 nanoparticles prepared at pH 10.5 for RhB was 9.30 mg g−1.
1. Introduction
Many textile industries use processes, such as dyeing silk, wool, jute, leather and cotton that are major sources of severe worldwide water pollution problems.1 The release of many dyes in the water is very harmful because these strong colored components create dangerous byproducts through oxidation, and inhibit benthic photosynthesis.2,3 The toxic and carcinogenic degraded products of dyes from industrial effluents released into clean water affect the central nervous system in humans and the environment.4,5 Rhodamine B (RhB), a cationic dye, is a major source of environmental pollution because of its stability and resistance to biodegradation.6 It can be toxic to human beings and animals, and causes the irritation of skin, eyes and respiratory tract.7,8 Thus, the development of efficient methods for RhB elimination is urgently needed. Several techniques such as advanced oxidation processes,9,10 direct coagulation/flocculation-sand filtration or ozonation,11–14 membrane separation,15 coagulation and flocculation,16 as well as adsorption,17–19 have been used to remove dyes from wastewater. Adsorption processes are considered to be an effective, promising and economical alternative, which can be used to remove dyes in water.20–22 Recently, magnetic nanoparticles have been used to remove dyes from water. Among ferrites utilized for dye removal, manganese ferrite (MnFe2O4) is the most prominent ferrite because of its highest magnetization, high catalytic activity, and good durability. Moreover, MnFe2O4 provides an advantage for repeating magnetic separation with good stability.23–29 It has been shown that MnFe2O4 nanoparticles can be prepared via several methods such as hydrothermal,30,31 sol–gel,29,32 and co-precipitation.33–35 Among these methods, co-precipitation has been widely utilized for the preparation of magnetic ferrite. When compared to other methods, the products obtained from a co-precipitation method are relatively uniform, and can be prepared easily and scaled up for industrial purposes. From previous reports, the physical properties of MnFe2O4 nanoparticles were strongly dependent on the pH preparation value.36–38 Therefore, controlling the pH value within the co-precipitation process is important for the synthesis of MnFe2O4 nanoparticles with the desired morphology and size for efficient adsorption. To the best of our knowledge, the characteristics and adsorption properties of MnFe2O4 nanoparticles prepared at various pH values for RhB removal have not been investigated.
In this study, the MnFe2O4 nanoparticles prepared at different pH values of 9.0, 9.5, 10.0, and 10.5 were synthesized by a co-precipitation method. The effect of controlling the pH during the co-precipitation process was studied to determine the crystal structure, morphology, magnetic properties of the MnFe2O4 nanoparticles. The adsorption capacities, adsorption kinetics and adsorption isotherms of the obtained MnFe2O4 nanoparticles were evaluated based on the efficiency of the RhB removal.
2. Experimental
2.1 Preparation of MnFe2O4 nanoparticles
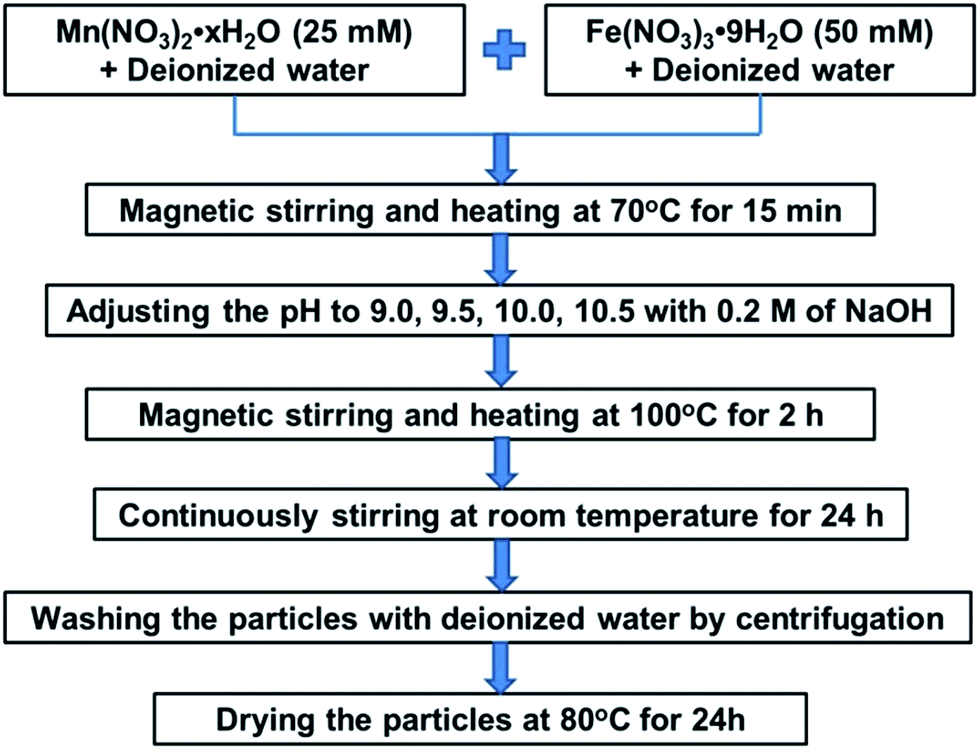
MnFe2O4 nanoparticles were prepared using a co-precipitation method. Firstly, 25 mM of manganese nitrate hydrate (Mn(NO3)2·xH2O, Sigma-Aldrich, USA, 98%) and 50 mM of iron nitrate nonahydrate (Fe(NO3)3·9H2O, Sigma-Aldrich, USA, 98%) were dissolved in deionized water. These solutions were mixed together using magnetic stirring at a constant speed. Then, the mixed solution was heated to 70 °C for 15 min, and then added dropwise 0.2 M of sodium hydroxide (NaOH, Sigma-Aldrich, 97%). The pH of each solution was adjusted to form different values of 9.0, 9.5, 10.0, and 10.5. Correspondingly, the MnFe2O4 samples produced during the pH-controlled preparation process were denoted as MnFe2O4-pH 9.0, MnFe2O4-pH 9.5, MnFe2O4-pH 10.0, and MnFe2O4-pH 10.5. The mixture solutions were then stirred magnetically for 24 h at room temperature. The obtained precipitates were washed with deionized water by centrifugation several times and were dried at 80 °C for 24 h. A flow diagram of MnFe2O4 nanoparticles preparation at the pH values of 9.0, 9.5, 10.0, and 10.5 by co-precipitation method are shown in Fig. 1.
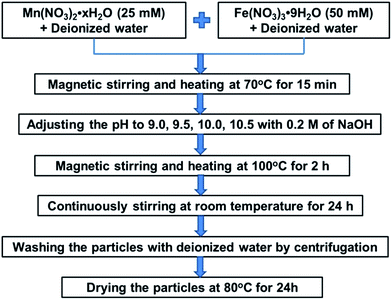 |
| | Fig. 1 Flow diagram of the MnFe2O4 nanoparticles preparation by co-precipitation at the pH values of 9.0, 9.5, 10.0, and 10.5. | |
2.2 Characterization
The crystal phases of all samples were characterized by X-ray diffraction (XRD, JEOL JDX-3530) with Cu Kα irradiation (λ = 1.5418 nm). The morphology and particle size were determined by scanning electron microscopy (SEM, JEOL JSM-6335F) and transmission electron microscopy (TEM, JEOL JEM-2010). The Brunauer–Emmett–Teller (BET) specific surface area and pore size of the prepared samples were analyzed by nitrogen adsorption–desorption isotherms obtained using an autosorb 1 MP (Quantachrome). The zeta potential determined by zetasizer nano instrument (ZS Malvern) was used to evaluate the isoelectric point (IEP) of the MnFe2O4 nanoparticles. A vibrating sample magnetometer (VSM, Lakeshore VSM 7400) was employed to measure the magnetic properties of the obtained samples. The Fourier transform infrared (FTIR) spectra of the samples were recorded in the 4000–400 cm−1 wavenumber region using KBr disks as standard on a Thermo Scientific model Nicolet 6700 FT-IR spectrophotometer. Surface composition and oxidation state were carried out using X-ray photoelectron spectroscopy (XPS, Kratos Axis ULTRADLD) with a monochromatic Al Kα source (1486.6 eV). All XPS spectra for the samples were referenced by setting the adventitious carbon C (1s) peak to 284.8 eV.
2.3 Adsorption experiments
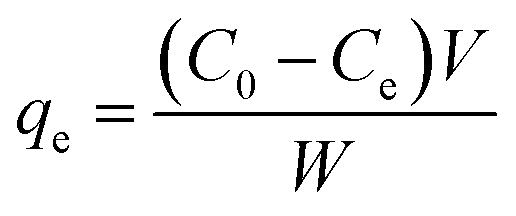
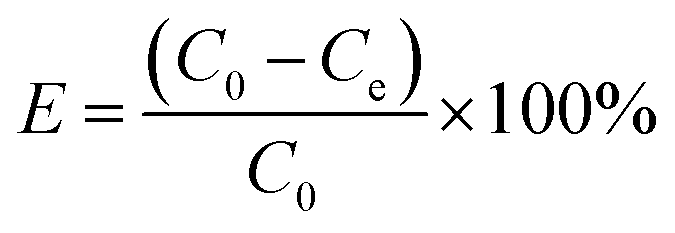
The adsorption properties of MnFe2O4 nanoparticles prepared at different pH values for RhB removal were examined using a batch adsorption experiment. Initially, at room temperature, 100 mg of the adsorbent was added to 100 mL of RhB reaction solution with a concentration of 2 × 10⁻⁵ M. During the adsorption process, samples were taken at 5 min intervals for 60 min. The MnFe2O4 nanoparticles were separated from the RhB solution by centrifugation at 3000 rpm for 5 min. The solute concentration was determined by a UV-vis spectrophotometer (Thermo Scientific Evolution 201) at λmax = 550 nm. The adsorption capacity and removal efficiency were calculated using the following equations:39,40| |
 | (1) |
| |
 | (2) |
where qe is the equilibrium adsorption capability (mg g−1), C0 and Ce are the initial and equilibrium concentrations of RhB (mg L−1), W is the mass (g) of the magnetic adsorbent, and V is the volume of the solution (mL).
3. Results and discussion
3.1 Crystal structure
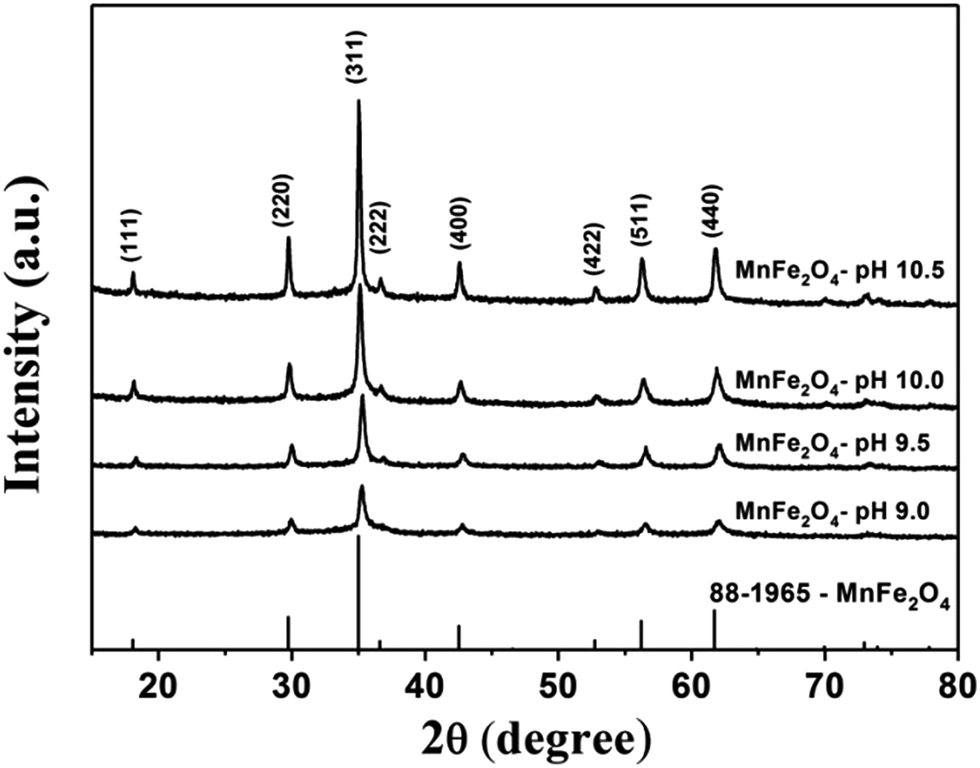
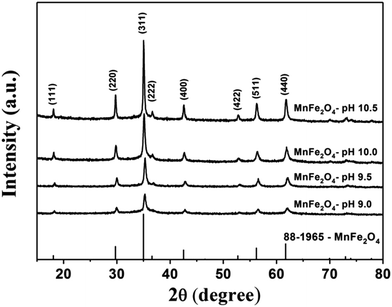
The XRD pattern of the MnFe2O4 powders prepared at different pH values are shown in Fig. 2. The considered diffraction peaks with 2θ values for MnFe2O4-pH 10.5 were 18.08°, 29.74°, 35.02°, 36.66°, 42.57°, 52.82°, 56.26°, and 61.74° corresponding to the crystal planes (111), (220), (311), (222), (400), (422), (511), and (440), respectively. According to the JCPDS standard (card no. 88–1965), the crystal structure of MnFe2O4 powders can be indexed as spinel structure belonging to the face center cubic (FCC) system. No diffraction peak was attributed to manganese oxide and/or iron oxide materials. This suggests that the well-crystallized MnFe2O4 phase with a spinel structure has formed during the co-precipitation process.
 |
| | Fig. 2 XRD patterns of MnFe2O4 nanoparticles prepared by preparation by co-precipitation at the pH values of 9.0, 9.5, 10.0, and 10.5. | |
As seen from Fig. 2, the XRD diffraction pattern of MnFe2O4-pH 9.0 shows the lowest intensity due to its small crystallite size with low crystallinity. On the other hand, the intensity of the (311) peak increased with increasing pH values from 9.5 to 10.5, indicating high crystallinity and large crystallite sizes for particles obtained under these preparation conditions. These results imply that the crystallite size and crystallinity of MnFe2O4 nanoparticles can be adjusted with the pH value used during the co-preparation process. The crystallite size of all samples was calculated using the Debye–Scherer formula.41 The calculated crystallite size of MnFe2O4 at the pH values of 9.0, 9.5, 10.0, and 10.5 were 29.5, 41.2, 54.2, and 103.7 nm, respectively (Table 1).
Table 1 Physical properties of MnFe2O4 nanoparticles prepared by a co-precipitation at different pH values
| MnFe2O4 |
XRD-crystallite size (nm) |
TEM-particle size (nm) |
SSA (m2 g−1) |
Average pore size diameter (nm) |
Ms (emu g−1) |
| pH 9.0 |
29.5 |
4.4 |
182.82 |
2.934 |
24.58 |
| pH 9.5 |
41.2 |
4.5 |
139.25 |
3.371 |
30.60 |
| pH 10.0 |
54.2 |
5.5 |
157.59 |
3.849 |
36.72 |
| pH 10.5 |
103.7 |
6.4 |
53.99 |
5.094 |
41.48 |
3.2 Morphology
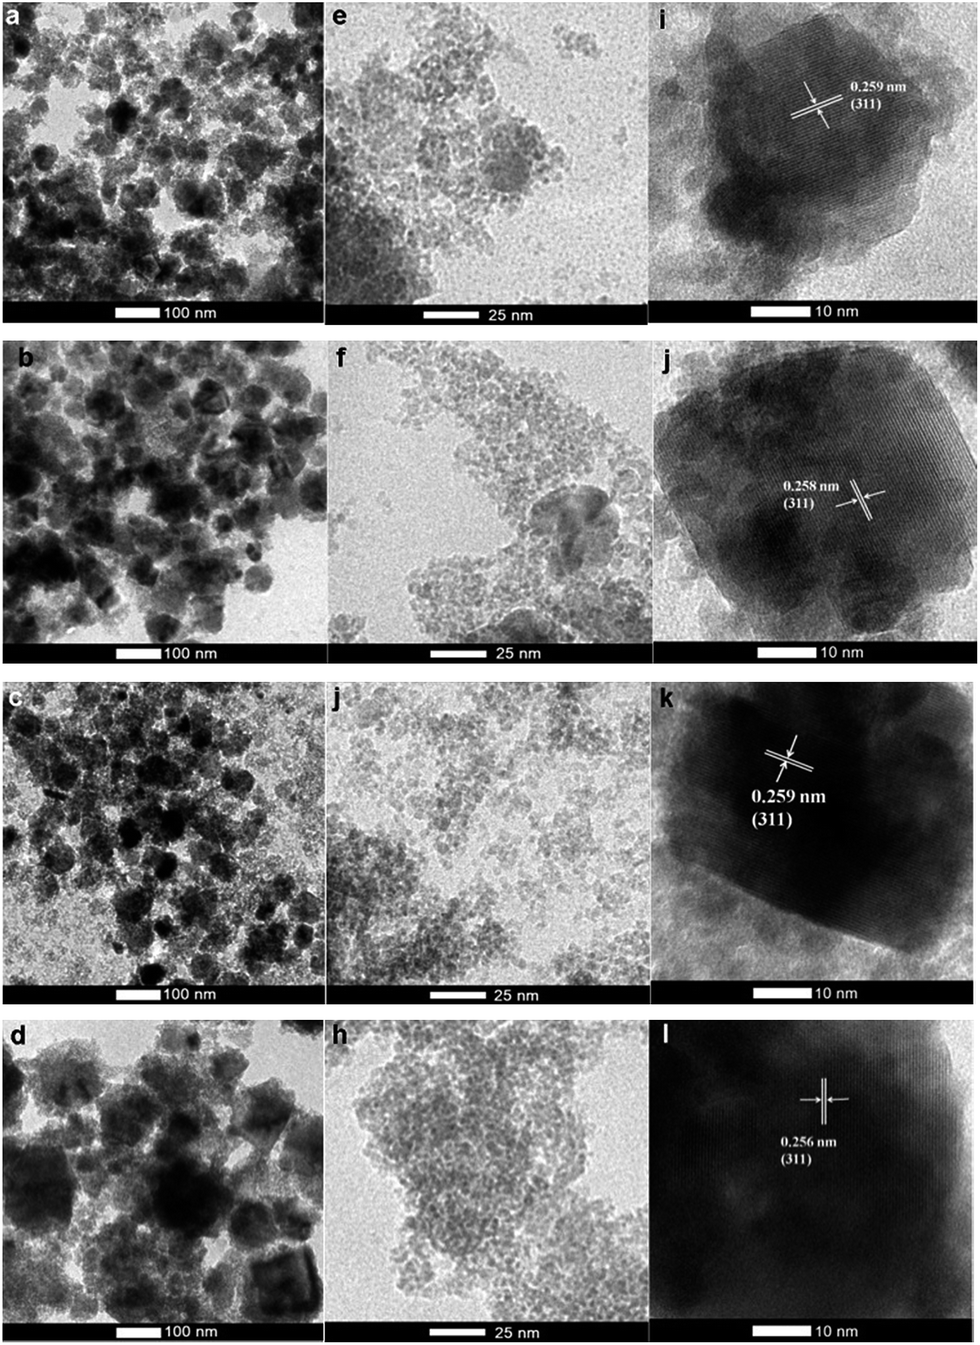
The morphology and particle size of MnFe2O4 nanoparticles with varying pH values (pH 9.0, 9.5, 10.0, and 10.5) were investigated by SEM and TEM images, and are shown in Fig. 3 and 4 as well as Table 1. Fig. 3 displays the SEM images of MnFe2O4 prepared at different pH values of 9.0, 9.5, 10.0, and 10.5. The images indicated that synthesized manganese ferrites were composed of agglomerated small particles. The morphology of MnFe2O4 nanoparticles appears to be not-so-hard-grained clusters. These nanoparticles consist of the spherical particles with average diameters of 69, 98, 149, and 247 nm for the preparation at pH values of 9.0, 9.5, 10.0, and 10.5, respectively. Furthermore, TEM images can reveal internal structures, and provide more accurate measurement of particle sizes and morphology. The morphology of MnFe2O4 nanoparticles from TEM images displayed spherical-like shapes. The average particle sizes of MnFe2O4 nanoparticles were 4.4, 4.5, 5.5, and 6.4 nm at the pH values 9.0, 9.5, 10.0, and 10.5, respectively (Fig. 4e–h). Fig. 4a–d show that the agglomerated particles diameter of MnFe2O4 increased as the pH value increased. The increase in the pH of the mixture solution resulted in more agglomeration of particles as the average particle size increased.42,43 The agglomeration of MnFe2O4 nanoparticles affects the BET-specific surface area (SSA) (these results are shown in the Section 3.3 BET-specific surface area and pore size). The corresponding HRTEM images in Fig. 4i–l show lattice spacings of the MnFe2O4 nanoparticles prepared at pH 9.0 to 10.5. The d spacing of approximately 0.25 nm corresponds to the (311) plane of MnFe2O4.
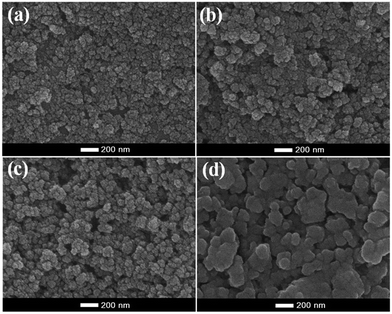 |
| | Fig. 3 SEM images of (a) MnFe2O4-pH 9.0, (b) MnFe2O4-pH 9.5, (c) MnFe2O4-pH 10.0 and (d) MnFe2O4-pH 10.5. | |
 |
| | Fig. 4 TEM images and lattice fringes of MnFe2O4 nanoparticles prepared at the pH values of pH 9.0 (a, e and i), pH 9.5 (b, f and j), pH 10.0 (c, g and k), and pH 10.5 (d, h and l). | |
3.3 BET-specific surface area and pore size
Fig. 5 shows the N2 adsorption–desorption isotherms area and the pore size distribution of the as-prepared MnFe2O4 nanoparticles. The N2 adsorption–desorption isotherm of MnFe2O4 nanoparticles was matched to a type IV hysteresis loop (according to the IUPAC classification) indicating a mesoporous structure. The BET-specific surface areas of the MnFe2O4 nanoparticles prepared at different pH values corresponded to the average pore size diameter as listed in Table 1. The MnFe2O4-pH 9.0 shows a specific surface area of 182.82 m2 g−1 and increasing the pH to 10.5 shows a surface area notably diminished to 53.99 m2 g−1. This is possibly because of the progressive aggregation of small crystallites into larger particles. The average pore size diameter was observed to increase as the pH increased. Furthermore, the most significant increase to a pore size of 5.094 nm was noted at the highest pH of 10.5. This result suggests that the larger pore size is beneficial to an improved ability of RhB to adsorb to the surface of MnFe2O4 nanoparticles. In addition to pore size of the adsorbent, other factors such as initial dye concentration and surface charge of the adsorbent influence the adsorption capacity of adsorbent materials.43–46
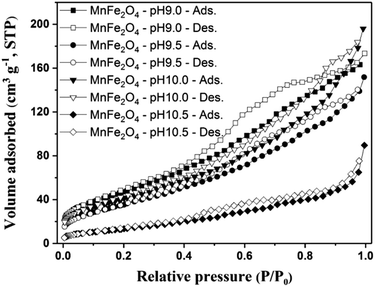 |
| | Fig. 5 N2 adsorption–desorption isotherms for MnFe2O4 nanoparticles prepared at pH 9.0, 9.5, 10.0, and 10.5. | |
3.4 Magnetic properties
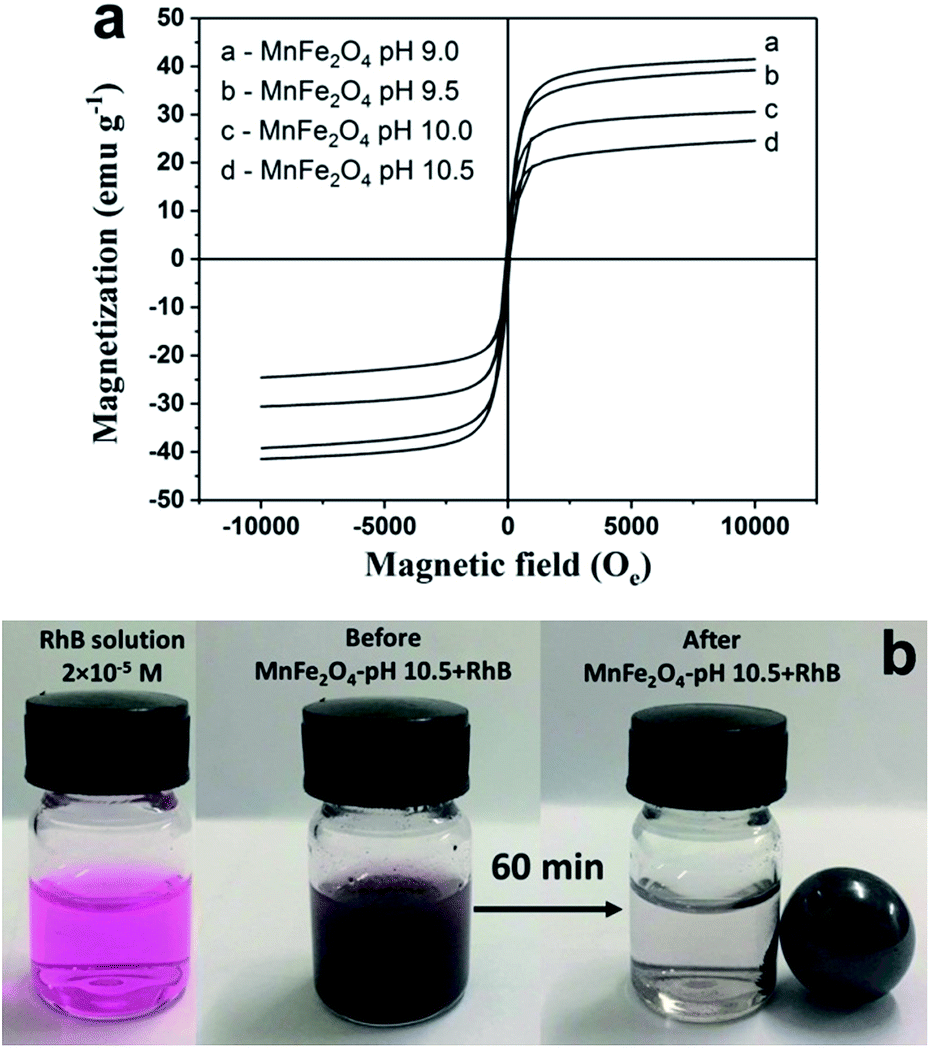
The magnetic properties of MnFe2O4 nanoparticles were investigated by using a vibrating sample magnetometer (VSM) at room temperature under magnetic fields up to ±10 kOe as shown in Fig. 6a. All MnFe2O4 samples exhibited soft magnetic behavior with a narrow hysteresis loop. The values of saturation magnetization (Ms) of MnFe2O4 nanoparticles prepared at pH 9.0, 9.5, 10.0, and 10.5 are shown in Table 1. The saturation magnetization of the MnFe2O4 nanoparticles increased as the increased pH value of the prepared MnFe2O4. MnFe2O4-pH 10.5 showed the highest Ms value (41.48 emu g−1) due to the large magnetic dipole moments from the large particle size and the high crystallinity of the particles. The results also demonstrate a faster magnetic attraction by external magnetic field and probably a more effective removal of the MnFe2O4 particles from the large volume of water. In Fig. 6b, MnFe2O4-pH 10.5 was separated in solution after applying a magnetic field. It can be seen that the magnetic powders of MnFe2O4-pH 10.5 immediately moved towards the magnet and the RhB solution became clear.
 |
| | Fig. 6 (a) M–H curves of MnFe2O4 nanoparticles prepared at different pH values and (b) photograph of MnFe2O4 nanoparticles separation in RhB solution by using a magnet. | |
3.5 Adsorption kinetics
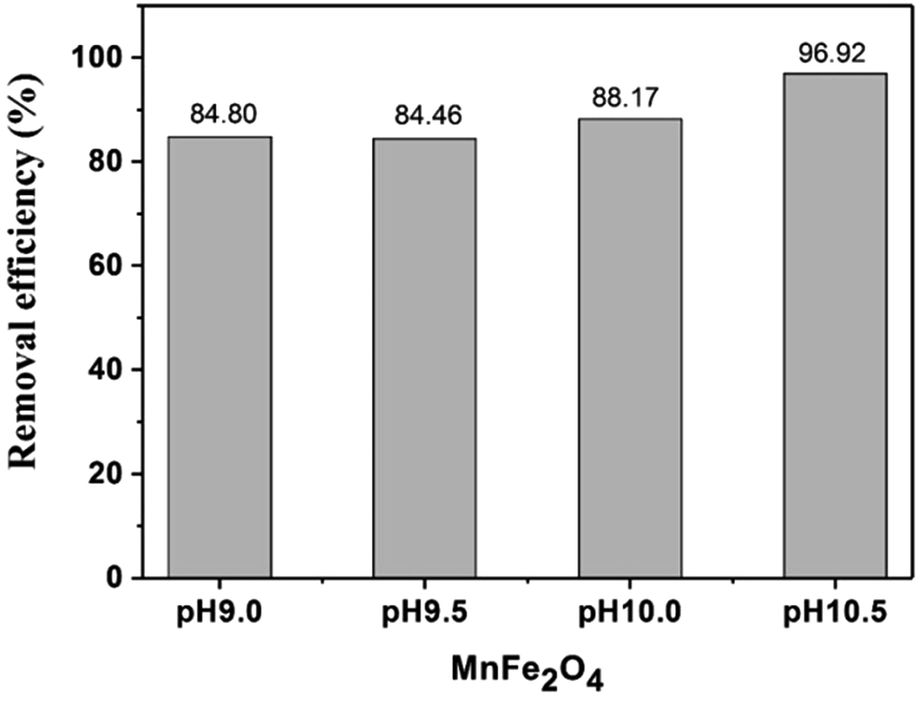
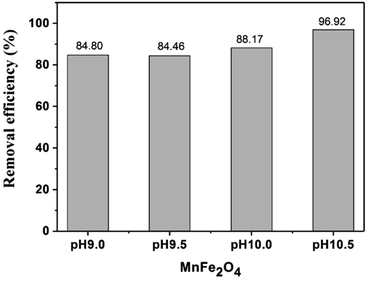
In Fig. 7, the maximum removal percentage of RhB (96.92%) was observed for MnFe2O4-pH 10.5. The adsorption capacity of MnFe2O4 nanoparticles over RhB could be partially explained by the surface charges characterized by zeta potential. The point of zero charge (pzc) values of MnFe2O4 nanoparticles prepared at pH 9.0, 9.5, 10.0, and 10.5 were 5.58, 6.13, 6.69, and 5.18, respectively. The pH value of the suspension of the MnFe2O4 nanoparticles and RhB solution was measured to be approximately 8.8 which explains the negatives charges on the surface of the MnFe2O4. For this reason, the cationic RhB molecules would preferentially adsorb onto the negatively charged MnFe2O4 nanoparticles through electrostatic interaction.47
 |
| | Fig. 7 Removal efficiency of RhB by MnFe2O4 nanoparticles prepared by co-precipitation at different pH values. | |
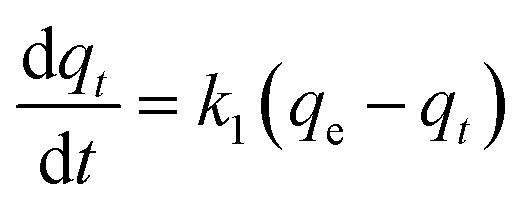
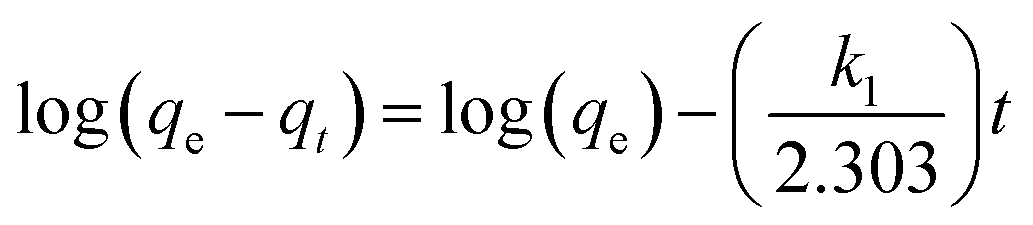
In order to further analyze the adsorption kinetics for removing RhB by MnFe2O4 nanoparticles, two kinetic models, the pseudo-first-order and pseudo-second-order, models, were applied. The adsorption capacities of MnFe2O4 nanoparticles for RhB adsorption are shown in Fig. 8a. The pseudo-first order equation is generally represented according the following equation48,49 (eqn (3)):
| |
 | (3) |
where
k1 and
qt are the rate constant of pseudo-first order kinetics (min
−1) and adsorption capacity at time
t (min), respectively. After integration by applying the conditions,
qt = 0 at
t = 0 and
qt =
qt at
t =
t, the
eqn (3) becomes
| |
 | (4) |
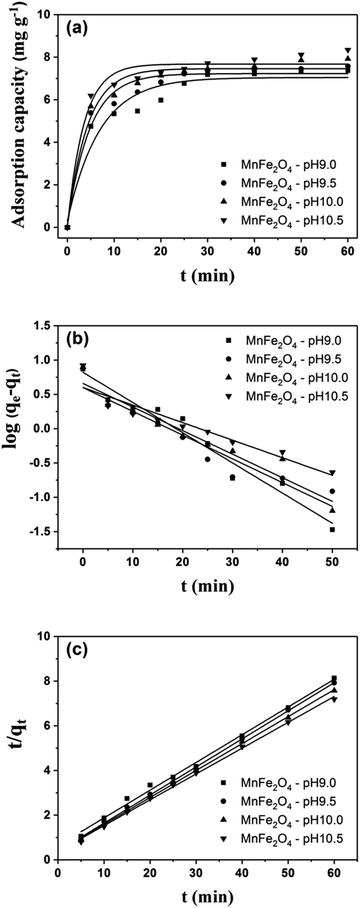 |
| | Fig. 8 Adsorption kinetics of (a) MnFe2O4, the plots of (b) pseudo-first order, and (c) pseudo-second order kinetic models for RhB adsorption onto MnFe2O4 nanoparticles with varying pH preparation values. | |
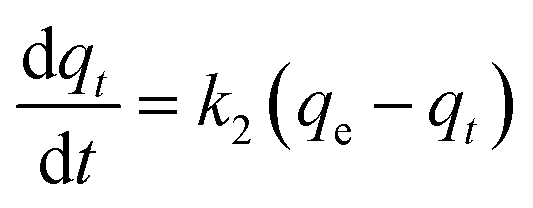
The k1, calculated qe (qe, cal), and correlation coefficients (R2) of MnFe2O4 with varying pH values were determined as shown in Table 2. The plot of log(qe − qt) versus time after fitting the pseudo-first order model is presented in Fig. 8b. The qe, cal values of all samples were calculated from the intercept of the plot of log(qe) versus t. From the obtained data, R2 was relatively low, indicating that the pseudo-first order model was not well suited to predict the kinetic rate constant. Therefore, the pseudo-second order model was applied to determine the suitable kinetic model which is expressed as the following equation:
| |
 | (5) |
where
k2 is the pseudo-second order rate constant (g mg
−1 min
−1). After integrating
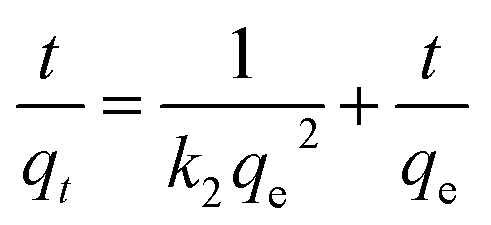
eqn (5), the linear fitting is expressed as the following equation:
| |
 | (6) |
Table 2 Kinetic parameters, qe, qe, cal, k1, k2, and correlation of coefficient R2 for the adsorption of RhB onto MnFe2O4 nanoparticles prepared at varying pH values
| Samples |
qe (mg g−1) |
Pseudo-first order |
Pseudo-second order |
| qe, cal (mg g−1) |
k1 (min−1) |
R2 |
qe, cal (mg g−1) |
k2 (g mg−1 min−1) |
R2 |
| MnFe2O4-pH 9.0 |
7.37 |
6.61 |
0.101 |
0.9587 |
7.76 |
0.283 |
0.9916 |
| MnFe2O4-pH 9.5 |
7.57 |
3.97 |
0.079 |
0.9143 |
7.78 |
0.469 |
0.9975 |
| MnFe2O4-pH 10.0 |
7.92 |
4.55 |
0.078 |
0.9295 |
8.10 |
0.460 |
0.9976 |
| MnFe2O4-pH 10.5 |
8.35 |
3.97 |
0.059 |
0.8975 |
8.45 |
0.443 |
0.9967 |
Fig. 8c shows pseudo-second-order kinetic models for RhB adsorption onto MnFe2O4 nanoparticles with varying pH preparation values. The adsorption kinetics and parameters of k2 and qe, cal from the intercept and slope of the plot of t/qt versus t are shown in Table 2. The R2 values show that the RhB removal kinetics can be approximated using a pseudo-second order model. Thus, the pseudo-second order model is more appropriate for explaining this adsorption process.
3.6 Adsorption isotherms
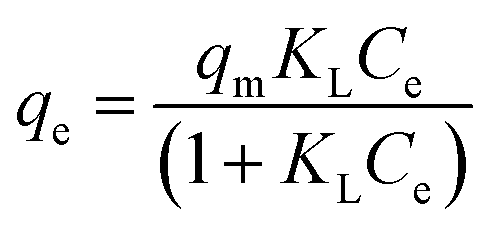
Two adsorption isotherm models, Langmuir and Freundlich equations, were used to further describe the adsorption equilibrium. The Langmuir equation describes monolayer adsorption with limited homogeneous sites. The Langmuir model is given by the following equation:50,51| |
 | (7) |
where Ce, KL, qe, qm, are the concentration of adsorbate at equilibrium (mg L−1), Langmuir constant (L mg−1), the amount of solute adsorbed at the equilibrium of RhB (mg g−1), and the maximum adsorption capacity of RhB (mg g−1), respectively. Eqn (7) can be expressed in a linear form as displayed in the following equation:| |
 | (8) |
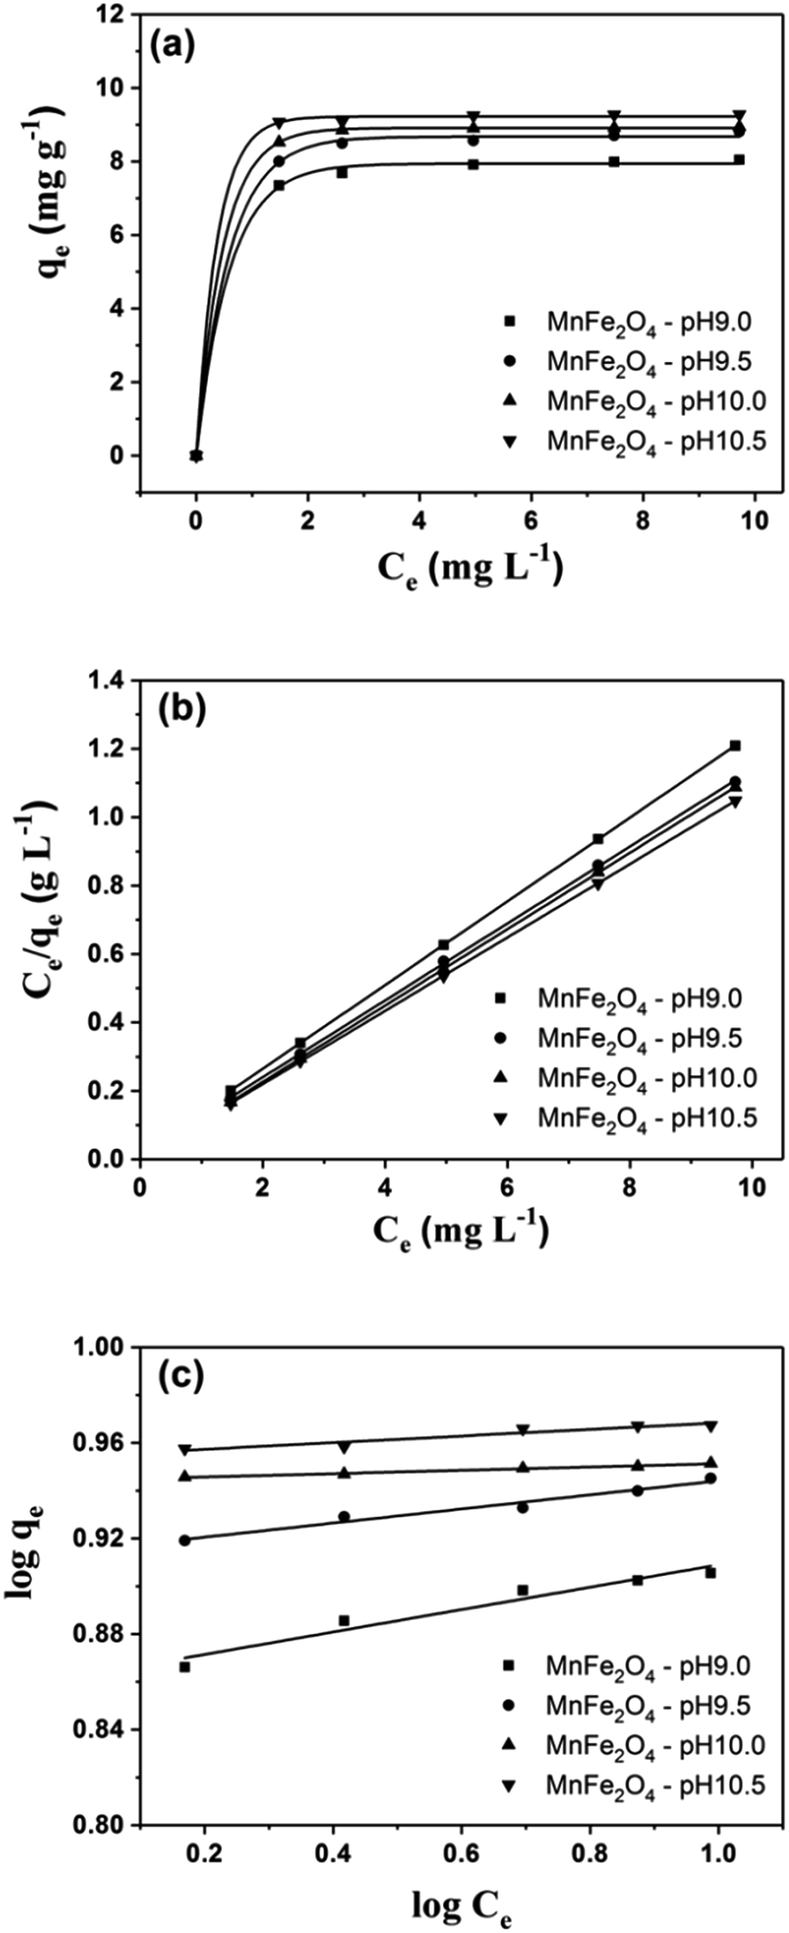
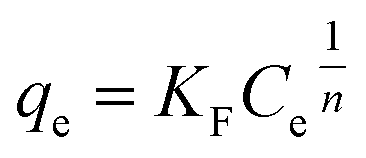
Fig. 9a shows linear forms of the isotherms for representative RhB adsorption by MnFe2O4 nanoparticles with varying preparation of pH values. The Langmuir isotherm for RhB adsorption on MnFe2O4 nanoparticles was examined from a linear plot of Ce/qe versus Ce as presented in Fig. 9b.
 |
| | Fig. 9 (a) Adsorption isotherms, (b) a typical linear Langmuir, and (c) Freundlich isotherms of RhB removal using MnFe2O4 nanoparticles with varying pH preparation values. | |
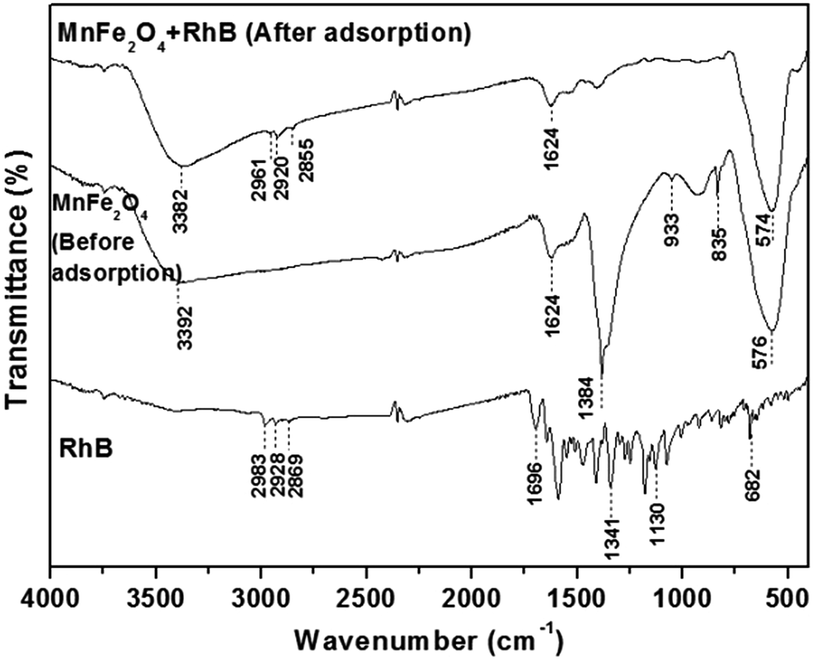
The Freundlich isotherm is one of the applicable models to describe heterogeneous surface adsorption and multilayer adsorption under various non-ideal conditions. The Freundlich isotherm can be shown in the simplest model50,51 as the following:
| |
 | (9) |
where
KF and 1/
n are the adsorption capacity at unit concentration (L mg
−1) and adsorption intensity, respectively. The 1/
n indicates the degree of non-linearity between solution concentration and adsorption, 1/
n = 0 (irreversible), 0 < 1/
n < 1 (favorable), and 1/
n > 1 (unfavorable). The linear form of the Freundlich isotherm can be expressed as the following equation:
| |
 | (10) |
The values of KF, n, and R2 are shown in Table 3. The fitting result of the Freundlich model using eqn (10) for RhB adsorption on MnFe2O4 nanoparticles is shown in Fig. 9c. From the fitting results of the Langmuir and Freundlich models, the experiment isotherm fits quite well with the Langmuir model based on an examination of the values of each model's constant and correlation coefficient (R2). This implies that the RhB adsorption onto MnFe2O4 is monolayer adsorption and the adsorption sites of MnFe2O4 nanoparticles are homogeneous. Moreover, the practical value of the equilibrium adsorption ability is much closer to the theoretical value obtained from the Langmuir model.
Table 3 Extracted values of qm, KL, Kf, and n from RhB adsorption using MnFe2O4 nanoparticles by curve fitting based on Langmuir and Freundlich isotherms
| Samples |
qe (mg g−1) |
Langmuir equation |
Freundlich equation |
| qm (mg g−1) |
KL (L mg−1) |
R2 |
Kf (L mg−1) |
1/n |
R2 |
| MnFe2O4-pH 9.0 |
8.04 |
8.09 |
10.75 |
0.9998 |
7.28 |
0.0469 |
0.9052 |
| MnFe2O4-pH 9.5 |
8.81 |
8.83 |
13.33 |
0.9998 |
8.22 |
0.0295 |
0.9688 |
| MnFe2O4-pH 10.0 |
8.94 |
8.94 |
22.82 |
0.9999 |
8.80 |
0.0170 |
0.9869 |
| MnFe2O4-pH 10.5 |
9.28 |
9.30 |
34.68 |
0.9999 |
9.01 |
0.0139 |
0.9139 |
The adsorption capacity of the as-prepared MnFe2O4 nanoparticles was compared with other reports as shown in Table 4.52–57 It was found that the adsorption capacity of adsorbents depends on several factors such as size, morphology, and specific surface area. Moreover, the extrinsic properties of adsorption capacity such as adsorbent loading and initial dye concentration significantly affected to the removal efficiency. No report has been found for MnFe2O4 reacting with RhB from previous work (Table 5).58–63 It was found that MnFe2O4 nanoparticles can adsorb RhB from water with adsorption capacity of 9.30 mg g−1. This indicates that the prepared MnFe2O4 nanoparticles can be considered as a promising adsorbent for the removal of rhodamine B from aqueous solution.
Table 4 Comparison of the studied dyes with MnFe2O4 and MnFe2O4-based composites as adsorbents based on the removal capacities
| Adsorbent |
Properties |
Adsorption properties |
Reference |
| Size (nm) |
SSA (m2 g−1) |
Ms (emu g−1) |
Dye |
Initial dye concentration (mg L−1) |
Adsorbent loading (g L−1) |
qe (mg g−1) |
| MnFe2O4 |
80–100 |
— |
78.4 |
Congo red |
100 |
0.3 |
92.4 |
52 |
| MnFe2O4 |
200–290 |
155.7 |
18.8 |
Congo red |
150 |
16 |
25.78 |
53 |
| MnFe2O4 |
2470 |
68.6 |
42.8 |
Azo dye acid red B |
100 |
4 |
53.8 |
54 |
| MnFe2O4/bentonite |
300–800 |
130 |
— |
AR138 |
100 |
0.1 g/30 ml |
— |
55 |
| MnFe2O4/PW |
21.1–25.6 |
— |
1.53 |
Congo red |
50–100 |
0.05–0.1 g |
86.96 |
56 |
| MnFe2O4@resin |
<5 (TEM) |
— |
6.2 |
Congo red |
10 |
0.2 |
1000 |
57 |
| MnFe2O4 |
5 |
53.99 |
41.48 |
RhB |
7.5 |
0.1 |
9.30 |
In this study |
Table 5 Comparison of the studied RhB with different types of adsorbents based on the adsorption capacities
| Adsorbent |
Properties |
Adsorption properties |
Reference |
| Size (nm) |
SSA (m2 g−1) |
Ms (emu g−1) |
Dye |
Initial dye concentration (mg L−1) |
Adsorbent loading (g L−1) |
qe (mg g−1) |
| Fly ash |
7500 |
40.16 |
40.16 |
RhB |
5–25 |
20 |
0.193–0.173 |
58 |
| ZnFe2O4 |
4–13 |
139 |
139 |
RhB |
5–25 |
0.15 |
5.02–9.38 |
59 |
| ZnTi0.6Fe1.4O4 |
20 |
— |
— |
RhB |
4–36 |
0.05–2.0 |
∼8–17 |
60 |
| BiFeO3 |
60–80 |
— |
— |
RhB |
25 |
0.5 g |
64.22 |
61 |
| CoFe2O4/graphene oxide |
14.58 |
239.76 |
59.2 |
RhB |
3.75 |
0.25 |
121.8 |
62 |
| Graphene/Fe3O4 |
<50 |
— |
— |
RhB |
20 |
0.6 |
30.211 |
63 |
| MnFe2O4 |
5 |
53.99 |
41.48 |
RhB |
7.5 |
0.1 |
9.30 |
In this study |
3.7 Fourier transform infrared analysis
The FTIR spectroscopy was performed to investigate the possible interactions between MnFe2O4 nanoparticles and RhB as shown in Fig. 10. The MnFe2O4-pH 10.5 exhibits an adsorption peak at 1624 cm−1, corresponding to O–H group due to the adsorbed water or moisture in samples. The broad band at around 3392 cm−1 is attributed to the symmetric vibration of –OH groups of H2O adsorbed by the sample. Meanwhile, the two bands at 576 and 1384 cm−1 can be attributed to the intrinsic vibrations of octahedral coordinated metal ions in the spinel structure and OH bending vibration, respectively. Typically, the metal oxide vibrations occur below 1000 cm−1.64,65 For spectrum of RhB, the weak intensity band at 2983 cm−1 is associated with the aromatic C–H vibrations, which also appear at 1130 cm−1 (plane bending) and at 682 cm−1 (wagging vibrations). Moreover, the vibration bands in 2928–2869 cm−1 is inferred to the presence of RhB. In addition, the band at 1696 cm−1 corresponds to the C![[double bond, length as m-dash]](https://www.rsc.org/images/entities/char_e001.gif) O stretching vibration, while the band at 1341 cm−1 is associated with aromatic skeletal C–C stretch.66–68 The appearances of the three peaks at 2961, 2920, 2855 cm−1 after RhB adsorption could be attributed to the formation of chemical bonds between RhB and MnFe2O4. These peaks shifted after RhB adsorption, confirming the interactions between MnFe2O4 and RhB.32,69
O stretching vibration, while the band at 1341 cm−1 is associated with aromatic skeletal C–C stretch.66–68 The appearances of the three peaks at 2961, 2920, 2855 cm−1 after RhB adsorption could be attributed to the formation of chemical bonds between RhB and MnFe2O4. These peaks shifted after RhB adsorption, confirming the interactions between MnFe2O4 and RhB.32,69
 |
| | Fig. 10 FTIR spectra of RhB and MnFe2O4-pH 10.5 before and after RhB adsorption. | |
3.8 UV-vis and XPS analyses
The adsorption mechanism of the MnFe2O4-pH 10.5 to remove RhB was investigated using UV-vis absorption spectroscopy and X-ray photoelectron spectroscopy (XPS) techniques. From Fig. 11a, the characteristic peak of RhB appeared on the spectrum of MnFe2O4/RhB. This peak signifies that RhB was absorbed on the surface of the MnFe2O4 nanoparticles. In Fig. 11b, the two peaks of Mn 2p, centered at about 641 and 653 eV, correspond to the binding energy for Mn 2p3/2 and Mn 2p1/2, indicating the oxidation state of Mn2+ in MnFe2O4 nanoparticles.70,71 Moreover, the Fe 2p spectra show two main peaks at the binding energies of about 711 and 724 eV, which are assigned to the Fe 2p3/2, and Fe 2p1/2 of Fe3+, respectively (Fig. 11c).72,73 The interaction of RhB and MnFe2O4 nanoparticles at the interface was also determined by XPS technique. The N 1s spectra of MnFe2O4 nanoparticles after RhB adsorption were contributed to the components of –NH2 (∼401 eV) and –NH (∼399 eV) (Fig. 11d).74,75 The N 1s peaks appearing in the spectrum of the MnFe2O4 nanoparticles/RhB while disappearing in the MnFe2O4 nanoparticles. Therefore, this indicates the presence RhB on the surface of the MnFe2O4 nanoparticles. The O 1s deconvoluted spectrum of MnFe2O4 nanoparticles before RhB adsorption (Fig. 11e) presents four Gaussian peaks centered at 529.92, 531.13, 531.98, and 532.99–534.12 eV associated with the binding energies of the lattice oxygen species (O2−), highly oxidative oxygen species (O22−/O−), hydroxyl groups (–OH), and surface adsorbed water molecules (H2O), respectively.69,76,77 The XPS spectrum of the O 1s shows a chemical shift after adsorption of RhB onto the MnFe2O4 surface. This is attributed to the adsorption of RhB on the surface of MnFe2O4 particles.78,79 The significant binding energy shifts observed from XPS study as well as the results from UV-vis and zeta potential analyses suggest there is strong electrostatic and chemical interactions between MnFe2O4 and RhB. These results confirm the adsorption of RhB on the MnFe2O4 surface.
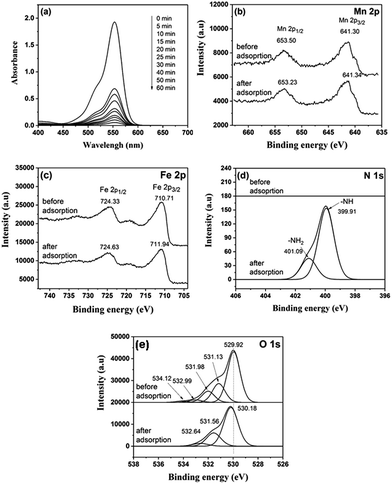 |
| | Fig. 11 (a) UV-visible absorption spectra of MnFe2O4 prepared at pH of 10.5 with different adsorption times of RhB adsorption in aqueous solution. XPS spectra of MnFe2O4 microspheres before and after RhB adsorption. Peak-fitting XPS spectra in the (b) Mn 2p, (c) Fe 2p, (d) N 1s, and (e) O 1s regions of MnFe2O4 nanoparticles and MnFe2O4/RhB. | |
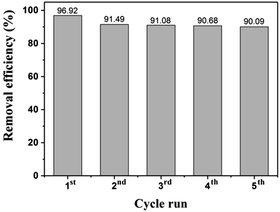
3.9 Reusability of MnFe2O4 nanoparticles
Reusability is one of the prerequisites to verify the practicality of a direct application of adsorbents for dye removal. The stability of the MnFe2O4-pH 10.5 was evaluated by repeating experiments on the RhB adsorption as shown in Fig. 12.
 |
| | Fig. 12 Removal efficiencies of RhB during adsorption cycles for MnFe2O4-pH 10.5. | |
After each run, the MnFe2O4 nanoparticles were collected using a magnetic field and washed by ultrasonic cleaning with deionized water following with absolute ethanol. Then, the separated MnFe2O4 nanoparticles were re-dispersed in fresh RhB solution with the same concentration (2 × 10⁻⁵ M), and next the new adsorption cycle began again. After 5 cycles, the removal efficiency decreased by a small fraction from 96.92% to 90.09%.
4. Conclusions
The magnetically separable MnFe2O4 nanoparticles were successfully prepared by a co-precipitation method with varying pH values. It was found that the physical, magnetic, and adsorption properties of MnFe2O4 nanoparticles were changed by controlling the pH value during MnFe2O4 nanoparticles preparation. The MnFe2O4-pH 10.5 sample exhibited the highest adsorption capacity towards RhB solution. The highest adsorption of RhB on the MnFe2O4-pH 10.5 sample depends on two factors that are large pore size and negative charge surface. Moreover, the reusability of MnFe2O4-pH 10.5 particles can be achieved by an external magnetic field separation with magnetization of 41.48 emu g−1. The experimental results correlated reasonably well with the Langmuir model. The adsorption kinetics of RhB by MnFe2O4 followed the pseudo-second order model. This study concludes that the facile synthesized magnetic MnFe2O4 nanoparticles prove to be effective as a potential adsorbent for the removal of RhB from aqueous solutions and a promising adsorbent for further utilizations in dye removal from colored textile wastewater.
Conflicts of interest
There are no conflicts to declare.
Acknowledgements
We wish to thank the following organizations for financial support: the Thailand Graduate Institute of Science and Technology Development Agency (TGIST), National Science and Technology Development Agency (NSTDA); the Center of Excellence in Materials Science and Technology, Chiang Mai University under the administration of Materials Science Research Center, Faculty of Science and the Graduate School, Chiang Mai University. Finally, we would like to thank Ms. Cythia Bail for her grateful kindness and valuable guidance for manuscript preparation.
References
- S. Zhu, T. Xu, H. Fu, J. Zhao and Y. Zhu, Environ. Sci. Technol., 2007, 41, 6234 CrossRef CAS PubMed.
- P. Saritha, C. Aparna, V. Himabindu and Y. Anjaneyulu, J. Hazard. Mater., 2007, 149, 609 CrossRef CAS PubMed.
- S. C. Jung, Water Sci. Technol., 2011, 63(7), 1491 CrossRef CAS PubMed.
- T. Yao, S. Guo, C. Zeng, C. Wang and L. Zhang, J. Hazard. Mater., 2015, 292, 90 CrossRef CAS PubMed.
- Q. Li, Q. Yue, Y. Su, B. Gao and J. Li, J. Hazard. Mater., 2009, 165, 1170 CrossRef CAS PubMed.
- E. Baldev, D. Mubarakali, A. Ilavarasi, D. Pandiaraj, K. A. Sheik Syed Ishack and N. Thajuddin, Colloids Surf., B, 2013, 105, 207 CrossRef CAS PubMed.
- I. K. Konstantinou and T. A. Albanis, Appl. Catal., B, 2004, 49, 1 CrossRef CAS.
- H. Lee, S. H. Park, Y.-K. Park, B. H. Kim, S.-J. Kim and S.-C. Jung, Chem. Cent. J., 2013, 7(156), 1 Search PubMed.
- C. Galindo, P. Jacques and A. Kalt, Chemosphere, 2001, 45, 997 CrossRef CAS PubMed.
- W. S. Kuo and P. H. Ho, Chemosphere, 2001, 45, 77 CrossRef CAS PubMed.
- A. Y. Zahrim and N. Hilal, Water Resources and Industry, 2014, 3, 23 CrossRef.
- S. A. Avlonitis, I. Poulios, D. Sotiriou, M. Pappas and K. Moutesidis, Desalination, 2008, 221, 259 CrossRef CAS.
- Q. Y. Yue, B. Y. Gao, Y. Wang, H. Zhang, X. Sun, S. G. Wang and R. R. Gu, J. Hazard. Mater., 2008, 152, 221 CrossRef CAS PubMed.
- S. Wang, Dyes Pigm., 2008, 76, 714 CrossRef CAS.
- M. Sundrarajan, G. Vishnu and K. Joseph, Dyes Pigm., 2007, 75, 273 CrossRef CAS.
- J. Liu, S. Ma and L. Zang, Appl. Surf. Sci., 2013, 265, 393 CrossRef CAS.
- H. Tajizadegan, M. Jafari, M. Rashidzadeh and A. Saffar-Teluri, Appl. Surf. Sci., 2013, 276, 317 CrossRef CAS.
- W. Deligeer, Y. W. Gao and S. Asuha, Appl. Surf. Sci., 2011, 257, 3524 CrossRef CAS.
- M. Anbia, S. Asl Hariri and S. N. Ashrafizadeh, Appl. Surf. Sci., 2010, 256, 3228 CrossRef CAS.
- J. Hu, I. M. C. Lo and G. Chen, Langmuir, 2005, 21, 11173 CrossRef CAS PubMed.
- H. F. Liang and Z. C. Wang, Mater. Chem. Phys., 2010, 124, 964 CrossRef CAS.
- S. Zhang, H. Niu, Y. Cai, X. Zhao and Y. Shi, Chem. Eng. J., 2010, 158, 599 CrossRef CAS.
- X. Bao, Z. Qiang, W. Ling and J. Chang, Sep. Purif. Technol., 2013, 117, 104 CrossRef CAS.
- J. G. Parsons, M. L. Lopez, J. R. Peralta-Videa and J. L. Gardea-Torresdey, Microchem. J., 2009, 91, 100 CrossRef CAS.
- J. Dui, G. Zhu and S. Zhou, ACS Appl. Mater. Interfaces, 2013, 5, 10081 CAS.
- I. Ibrahim, I. O. Ali, T. M. Salama, A. A. Bahgat and M. M. Mohamed, Appl. Catal., B, 2016, 181, 389 CrossRef CAS.
- D. Chen, Y. Zhang and Z. Kang, Chem. Eng. J., 2013, 215–216, 235 CrossRef CAS.
- W. Wang, Z. Ding, M. Cai, H. Jian, Z. Zeng, F. Li and J. P. Liu, Appl. Surf. Sci., 2015, 346, 348 CrossRef CAS.
- Y. Ren, N. Li, J. Feng, T. Luan, Q. Wen, Z. Li and M. Zhang, J. Colloid Interface Sci., 2012, 367, 415 CrossRef CAS PubMed.
- X. Hou, J. Feng, X. Xu and M. Zhang, J. Alloys Compd., 2010, 491, 258 CrossRef CAS.
- M. P. Reddy, A. M. A. Mohamed, M. V. Ramana, X. B. Zhou and Q. Huang, J. Magn. Magn. Mater., 2015, 395, 185 CrossRef.
- X. Hou, J. Feng, Y. Ren, Z. Fan and M. Zhang, Colloids Surf., A, 2010, 363, 1 CrossRef CAS.
- M. Augustin and T. Balu, Mater. Today, 2015, 2, 923 CrossRef.
- C. Pereira, A. M. Pereira, C. Fernandes, M. Rocha, R. Mendes, M. P. Fernández-García, A. Guedes, P. B. Tavares, J.-M. Grenèche, J. P. Araújo and C. Freire, Chem. Mater., 2012, 24, 1496 CrossRef CAS.
- M. J. Akhta and M. Younas, Solid State Sci., 2012, 14, 1536 CrossRef.
- N. S. Gajbhiye and G. Balaji, Thermochim. Acta, 2002, 385, 143–151 CrossRef CAS.
- J. Wang, T. Deng, Y. Lin, C. Yang and W. Zhan, J. Alloys Compd., 2008, 450, 532 CrossRef CAS.
- M. Vadivel, R. R. Babu, K. Sethuraman, K. Ramamurthi and M. Arivanandhan, J. Magn. Magn. Mater., 2014, 362, 122 CrossRef CAS.
- Y. Xiao, H. Liang, W. Chen and Z. Wang, Appl. Surf. Sci., 2013, 285, 498 CrossRef CAS.
- X. Fang, J. Xiao, S. Yang, H. He and C. Sun, Appl. Catal., B, 2015, 162, 544 CrossRef CAS.
- T. Huang, S. Mao, J. Yu, Z. Wen, G. Lu and J. Chen, RSC Adv., 2013, 3, 16657 RSC.
- A. Molea, V. Popescu, N. A. Rowson and A. M. Dinescu, Powder Technol., 2014, 253, 22 CrossRef CAS.
- J. Jaramillo, B. A. Garzón and L. TiradoMejía, J. Phys.: Conf. Ser., 2016, 687, 12 CrossRef.
- Q. Hu, Y. Liu, X. Gu and Y. Zhao, Chemosphere, 2017, 181, 328 CrossRef CAS PubMed.
- S. Zhang, H. Niu, Y. Cai, X. Zhao and Y. Shi, Chem. Eng. J., 2010, 158, 599 CrossRef CAS.
- M. Iram, C. Guo, Y. Guan, A. Ishfaq and H. Liu, J. Hazard. Mater., 2010, 181, 1039 CrossRef CAS PubMed.
- S. Wang, X. Zhang, L. Pan, F.-M. Zhao, J.-J. Zou, T. Zhang and L. Wang, Appl. Catal., B, 2015, 64, 234 CrossRef.
- L. Wang, J. Li, Y. Wang, L. Zhao and Q. Jiang, Chem. Eng. J., 2012, 181–182, 72 CrossRef CAS.
- Y.-S. Ho, J. Hazad. Mater., 2006, 136, 681 CrossRef CAS PubMed.
- Y. C. Wong, Y. S. Szeto, W. H. Cheung and G. McKay, Langmuir, 2003, 19, 7888 CrossRef CAS.
- G. A. Sayğili, J. Mol. Liq., 2015, 211, 515 CrossRef.
- L. Wang, J. Li, Y. Wang, L. Zhao and Q. Jiang, Chem. Eng. J., 2012, 181–182, 72 CrossRef CAS.
- L. Yang, Y. Zhang, X. Liu, X. Jiang, Z. Zhang, T. Zhang and L. Zhang, Chem. Eng. J., 2014, 246, 88 CrossRef CAS.
- R. Wu and J. Qu, J. Chem. Technol. Biotechnol., 2005, 80, 20 CrossRef CAS.
- S. Hashemian, Afr. J. Biotechnol., 2010, 9(50), 8667 CAS.
- G. A. Sayğılı, J. Mol. Liq., 2015, 211, 515 CrossRef.
- M. H. Beyki, H. Alijani and Y. Fazli, J. Mol. Liq., 2016, 216, 6 CrossRef CAS.
- T. A. Khan, I. Ali, V. Vati Singh and S. Sharma, J. Environ. Prot., 2009, 3, 11 Search PubMed.
- W. Konicki, D. Siber and U. Narkiewicz, Pol. J. Chem. Technol., 2017, 19(4), 65 CAS.
- J. Feng, Y. Hou, Y. Wang, X. Wang, H. Chen and L. Li, Sci. China: Chem., 2016, 59, 1033 CrossRef CAS.
- T. Soltani and M. H. Entezari, Chem. Eng. J., 2013, 223, 145 CrossRef CAS.
- W. Yin, S. Hao and H. Cao, RSC Adv., 2017, 7, 4062 RSC.
- M. Mehrali, E. Sadeghinezhad, A. R. Akhiani, S. T. Latibari, H. S. C. Metselaar, A. S. Kherbeet and M. Mehrali, Powder Technol., 2017, 308, 149 CrossRef CAS.
- S. Kanagesan, S. B. A. Aziz, M. Hashim, I. Ismail, S. Tamilselvan, N. B. B. M. Alitheen, M. K. Swamy and B. P. C. Rao, Molecules, 2016, 21, 312 CrossRef PubMed.
- P. Iranmanesh, S. Saeednia, M. Mehran and S. Rashidi Dafeh, J. Magn. Magn. Mater., 2017, 425, 31 CrossRef CAS.
- D. Zhao, C. Chen, Y. Wang, W. Ma, J. Zhao, T. Rajh and L. Aang, Environ. Sci. Technol., 2008, 42, 308 CrossRef CAS PubMed.
- Q. He, J. Shi, X. Cui, J. Zhao, Y. Chen and J. Zhou, J. Mater. Chem., 2009, 19, 3395 RSC.
- R. M. Dukali, I. M. Radović, D. B. Stojanović, D. M. Šević, V. J. Radojević, D. M. Jocić and R. R. Aleksić, J. Serb. Chem. Soc., 2014, 79(7), 867 CrossRef CAS.
- J. Fu, Q. Xin, X. Wu, Z. Chen, Y. Yan, S. Liu, M. Wang and Q. Xu, J. Colloid Interface Sci., 2016, 461, 292 CrossRef CAS PubMed.
- Q. Tang, L. Jiang, J. Liu, S. Wang and G. Sun, ACS Catal., 2014, 4, 457 CrossRef CAS.
- J. Chen, W. Wen, L. Kong, S. Tian, F. Ding and Y. Xiong, Ind. Eng. Chem. Res., 2014, 56, 6297 CrossRef.
- Y. Yao, Y. Cai, F. Lu, F. Wei, X. Wang and S. Wang, J. Hazard. Mater., 2014, 270, 61 CrossRef CAS PubMed.
- Z. Zhang, Y. Wang, Q. Tan, Z. Zhong and F. Su, J. Colloid Interface Sci., 2013, 398, 185 CrossRef CAS PubMed.
- J. Zhang, T. Yao, C. Guan, N. Zhang, H. Zhang, X. Zhang and J. Wu, J. Colloid Interface Sci., 2017, 505, 130 CrossRef CAS PubMed.
- L. Chen, F. He, N. Zhao and R. Guo, Appl. Surf. Sci., 2017, 420, 669 CrossRef CAS.
- F.-T. You, G.-W. Yua, Y. Wang, Z.-J. Xing, X.-J. Liu and J. Li, Appl. Surf. Sci., 2017, 413, 387 CrossRef CAS.
- Y. J. Oh, J. J. Yoo, Y. I. Kim, J. K. Yoon, H. N. Yoon, J.-H. Kim and S. B. Park, Electrochim. Acta, 2014, 116, 118 CrossRef CAS.
- T. Serizawa, H. Takeshita and M. Akashi, Langmuir, 1998, 14, 4088 CrossRef CAS.
- S. Banerjee and M. C. Chattopadhyaya, Arabian J. Chem., 2017, 10, S1629 CrossRef CAS.
|
| This journal is © The Royal Society of Chemistry 2018 |
Click here to see how this site uses Cookies. View our privacy policy here. 
 Open Access Article
 This Open Access Article is licensed under a Creative Commons Attribution-Non Commercial 3.0 Unported Licence
 *ae
*ae