 Open Access Article
Efficient electromagnetic interference shielding of lightweight carbon nanotube/polyethylene composites via compression molding plus salt-leaching†
Ling Xua,
Li-Chuan Jiaa,
Ding-Xiang Yan *b,
Peng-Gang Renc,
Jia-Zhuang Xu
 a and
Zhong-Ming Li
 *a
*a
aCollege of Polymer Science and Engineering, State Key Laboratory of Polymer Materials Engineering, Sichuan University, Chengdu, 610065, China. E-mail: zmli@scu.edu.cn
bSchool of Aeronautics and Astronautics, Sichuan University, Chengdu 610065, China. E-mail: yandingxiang@scu.edu.cn
cInstitute of Printing, Packaging Engineering and Digital Media Technology, Xi'an University of Technology, Xi'an, Shaanxi 710048, China
First published on 26th February 2018
Abstract
Carbon nanotube/high density polyethylene (CNT/HDPE) foam composites with high electrical conductivity and electromagnetic interference (EMI) shielding performance were developed by means of compression molding plus salt-leaching. The uniform porous structure and interconnected CNT networks throughout the cell backbones endowed the as-prepared foam composites with a significantly lower electrical percolation threshold (0.22 vol%) than that of the solid composites (0.84 vol%). Owing to the multiple reflections and scattering between the cell–matrix interfaces, the foam composites presented a superior specific EMI shielding effectiveness (EMI SE) of 104.3 dB cm3 g−1, 2.2 times higher than that of their solid counterpart. Besides this, the pore sizes of the CNT/HDPE foam composites could be easily tuned by controlling the particle size of the porogen. Also, the electrical conductivity and specific EMI SE increased with an increase in the cell diameter, which was attributed to the formation of a more perfect conductive network in the cell backbones. Our approach provides a novel idea for fabricating new lightweight EMI shielding materials, especially for aircraft and spacecraft applications.
1 Introduction
Given the rapid development of electronic devices, such as communication facilities, wireless networks, portable digital hardware, etc., electromagnetic pollution poses a serious problem in modern society.1–3 Thus, electromagnetic interference (EMI) shielding materials have drawn extraordinary attention in the academic and industrial fields. Compared to traditional metal-based shielding materials, conductive polymer composites (CPCs) containing carbonous nanofillers have been viewed as advanced candidates for EMI shielding, because they are lightweight, easy to process, and resistant to corrosion, and have tunable electrical conductivity.4–12On the basis of material and energy savings, being as lightweight as possible is especially important for EMI shielding materials if they are to be used in aircraft, spacecraft, automobiles, and household appliances. To this end, great efforts have been devoted to reducing the weight of CPCs by constructing foam structures.13–20 Unfortunately, the formation of cells inevitably impairs the conductive networks of traditionally porous CPCs, resulting in structures which hardly meet the commercial EMI shielding effectiveness (EMI SE) requirement, i.e., 20 dB.21 For instance, Yang et al. reported porous CPCs made of carbon nanotube (CNT)/polystyrene foam for EMI shielding that exhibited an average EMI SE of 19 dB at a density of 0.56 g cm−3.13 Ling et al. explored a water vapor induced phase separation process for preparing a graphene–polyetherimide foam composite with a much lower density of 0.29 g cm−3. Nevertheless, an average EMI SE of only 11 dB was obtained.22 A modified study reported an increased EMI SE of 18.2 dB by introducing ferrosoferric oxide (Fe3O4)-functionalized graphene, while the foam density was 0.4 g cm−3.23 Generally, raising the filler content perfects the conductive networks to improve the EMI SE of CPC foams. However, high nanofiller loading always causes adverse effects on the formation of pore structure, hindering the formation process,23 and so, the simultaneous realization of high EMI SE and low density in CPC foams remains a daunting challenge. To solve this technical issue, our previous work proposed a facile and effective approach based on compression molding and salt-leaching to prepare graphene/polystyrene foam composites, resulting in structures with an EMI SE of 29.0 (17.3) dB with a foam density of 0.45 (0.27) g cm−3, wherein the increased nanofiller loading had a slight effect on the foamability of the foam and a relatively high EMI SE and a low foam density could be achieved simultaneously.17 Regrettably, the comparative study on the EMI shielding performance between the CPC foam and solid is still unavailable, and the contribution of the foam structure to the EMI shielding performance has not been thoroughly investigated, which is of prominent importance to guide the fabrication of efficient low density EMI shielding materials.
Herein, lightweight CNT/high-density polyethylene (HDPE) foam composites with a high EMI SE of 27.1 dB at a density of only 0.26 g cm−3 were easily fabricated using a compression molding plus salt-leaching technique. The resulting foam structure endowed the CNT/HDPE foam composites with a much lower electrical percolation threshold of 0.22 vol% and a significantly higher specific EMI SE (EMI SE divided by density) of 104.3 dB cm3 g−1, compared to those of its solid counterpart which were 0.84 vol% and 48.1 dB cm3 g−1. The effects of the pore size on the electrical conductivity and the EMI shielding performance of the CNT/HDPE foam composites were also investigated.
2 Experimental section
2.1 Materials
HDPE (5000S) with a density of 0.945 g cm−3 was purchased from Daqing petrochemical company, China. CNTs with a density of 2.1 g cm−3, a diameter of 20–40 nm and a length of 50 μm were supplied by the Institute of Organic Chemistry at the Chinese Academy of Science, China. Calcium carbonate (CaCO3) with a density of 2.7 g cm−3 was purchased from Yibang Science and Technology Ltd., China. Three kinds of CaCO3 particles were used in this work to adjust the pore sizes of the foam composites. Ethanol, hydrochloric acid, distilled water and xylene were purchased from Kelong Chemical Incorporated Co. Ltd., China.2.2 Fabrication of CNT/HDPE foam and solid composites
The fabrication of the CNT/HDPE foam composites is schematically illustrated in Fig. 1. Initially, solution mixing and mechanical pulverization were utilized to prepare CNT filled HDPE particles. The CNT/HDPE particles were then mechanically mixed with CaCO3 particles to obtain CNT/HDPE/CaCO3 complex particles. Subsequently, the complex particles were compression molded into sheets under a pressure of 10 MPa and a temperature of 180 °C for 15 min. Finally, the CNT/HDPE foam composites were obtained by leaching CaCO3 out of the sheets using hydrochloric acid (HCl, 10 vol%) and distilled water. The CaCO3 content was fixed at 90 wt% in the CNT/HDPE/CaCO3 sheets. The CNT content in the CNT/HDPE foam composites was 2, 3, 5, 10, 15, and 30 wt%. Detailed information on the CNT/HDPE foam composites is listed in Table 1. For comparison, CNT/HDPE solid composites with the same CNT content were also prepared.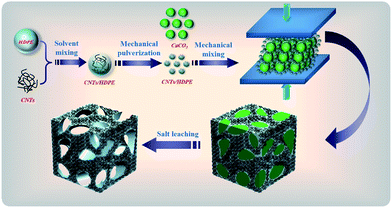 | ||
| Fig. 1 Schematic representation of the fabrication of the CNT/HDPE foam composites using the compression molding plus salt-leaching method. | ||
| CNT content in the solids (wt%) | CNT content in the solids (vol%) | Density of the solids (g cm−3) | CNT content in the foams (vol%) | Density of the foams (g cm−3) | Continuity of the CaCO3 (%) | Porosity (%) |
|---|---|---|---|---|---|---|
| 0 | 0 | 0.95 | 0 | 0.26 | 98.5 | 74.8 |
| 2 | 0.91 | 0.96 | 0.22 | 0.26 | 98.6 | 75.0 |
| 3 | 1.27 | 0.96 | 0.33 | 0.25 | 99.8 | 75.3 |
| 5 | 2.31 | 0.97 | 0.55 | 0.25 | 99.8 | 75.5 |
| 10 | 4.76 | 1.00 | 1.10 | 0.25 | 99.0 | 76.2 |
| 15 | 7.36 | 1.03 | 1.66 | 0.25 | 99.0 | 76.7 |
| 30 | 16.17 | 1.13 | 3.39 | 0.26 | 99.1 | 78.3 |
2.3 Characterization
The morphologies of the foam structures were observed using field-emission scanning electron microscopy (FE-SEM, Inspect-F, FEI, USA) at an accelerating voltage of 20 kV after sputter-coating the specimens with gold. The density of the foam composites was calculated by measuring the weight and apparent volume of the samples. The average density value was evaluated using at least five samples. The electrical conductivities of the composite samples were measured using a Keithley electrometer Model 4200-SCS according to a two-point method. The EMI SE measurements were conducted using an Agilent N5230 vector network analyzer at room temperature, in the frequency range of 8.2–12.4 GHz (X band). Detailed information for the EMI shielding measurements is available in our previous work.243 Results and discussion
The microscopic morphologies of the CNT/HDPE foam composites with various CNT content are shown in Fig. 2, exhibiting typically open-cell structures in the systems regardless of the CNT content. The evolution of such open-cell structures is attributed to the compression molding and salt-leaching method. During the compression molding process, melted CNT/HDPE particles mutually adhere to form a continuous phase in the CNT/HDPE/CaCO3 sheets. The salt-leaching process dissolves the CaCO3, leading to the formation of an open-cell structure with CNT/HDPE as the skeleton. The gravimetric data for the CaCO3 continuity in the CNT/HDPE foam composites are above 98.5%, demonstrating that almost all of the CaCO3 is removed during the salt-leaching process. As a result, the density of the foam composites is as low as ∼0.26 g cm−3 (Table 1). The magnified SEM images in Fig. 2a1–d1 reveal that the CNTs are homogeneously dispersed in the cell skeletons without obvious agglomeration, which is similar to the CNT distribution in the solid composite (Fig. S1†), and the dispersed CNTs become denser as the CNT content increases. When the CNT content is 3.39 vol%, thickly dotted CNTs are observed to construct perfect conductive networks, which engender the foam composite with excellent electrical conductivity and EMI shielding performance. The strategy proposed here is obviously superior to other molding methods, such as phase separation, supercritical carbon dioxide foaming, and other methods,25–31 for preparing low-density foam composites with a high nanofiller content.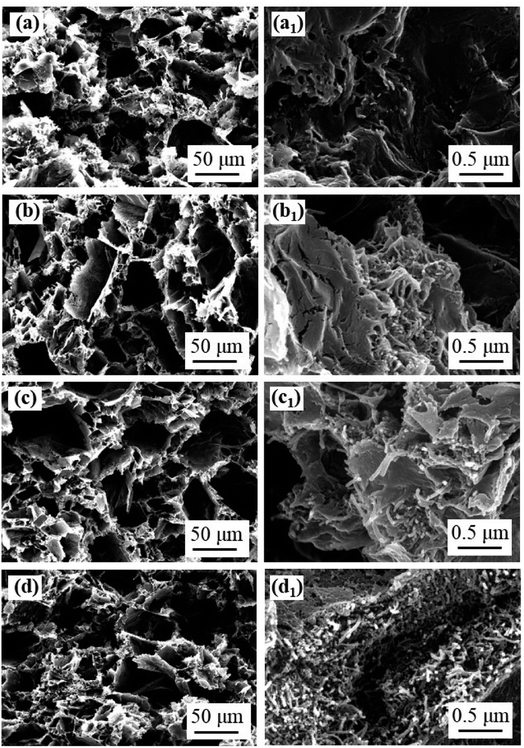 | ||
| Fig. 2 SEM micrographs of the CNT/HDPE foam composites with different CNT content: (a, a1) 0.33 vol%, (b, b1) 0.55 vol%, (c, c1) 1.10 vol%, and (d, d1) 3.39 vol%. | ||
Fig. 3 shows the electrical conductivity as a function of CNT volume fraction in the CNT/HDPE foam composites. For comparison, the electrical conductivity of the CNT/HDPE solid composites is also displayed. A typical percolation behavior is observed for the two composites and the foam composites always exhibit much higher conductivities than their solid counterparts. For instance, the electrical conductivity of the foam composite with only 0.55 vol% CNTs is 3.2 × 10⁻² S m−1, more than one order of magnitude over that of the solid composite with a higher CNT content (2.06 × 10⁻³ S m−1@0.91 vol%). The relationship between the electrical conductivity and the CNT volume fraction is influenced by classical percolation theory σ = σ0(φ − φc)t, where σ stands for the electrical conductivity of the composites; σ0 is a constant related to the inherent electrical conductivity of the CNTs; φ represents the volume fraction of the CNTs; φc is the percolation threshold; and t is the critical index related to the dimension of the conductive networks. The inset in Fig. 3 shows good linear fitting for both the CNT/HDPE foam and solid composites according to the power law equation. The foam composites have a much lower φc value (0.218 vol%) than that of the solid composites (0.840 vol%). The fitted t values are 2.43 and 2.01, indicating the formation of three dimensional conductive networks in both systems.32–34 In comparison to the solid composites, the superior electrical conductivity for the foam composites originates from their unique foam structure, which allows a concentrated amount of CNTs to distribute in the cell skeleton, thus improving the effective CNT concentration in the whole system.
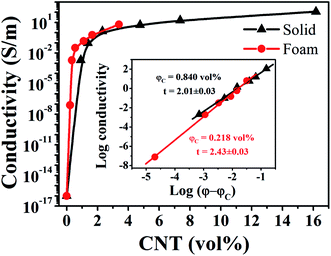 | ||
| Fig. 3 Electrical conductivity versus the CNT volume fraction for the CNT/HDPE foam and solid composites. The inset shows the linear fitting of the data according to the power law equation. | ||
It is well known that EMI shielding performance is closely related to electrical conductivity.35,36 The higher electrical conductivity of the CNT/HDPE foam composites is expected to be beneficial for the EMI shielding performance. Fig. 4 shows the EMI SE of the CNT/HDPE foam and solid composites. The EMI SE of both the foam and solid composites exhibits a weak dependence on frequency and this increases with CNT content. As expected, the EMI SE of the foam composites is higher than that of the solid composites at a given CNT content, in accordance with the electrical conductivity results (Fig. 3). The CNT/HDPE foam composite displays a satisfactory EMI SE 21.2 dB with only 1.66 vol% CNT content, which meets the target requirement for commercial application (20 dB), whereas a higher CNT content (2.31 vol%) is required for the solid composites. Upon increasing the CNT content to 3.39 vol%, the CNT/HDPE foam composite realizes an impressive EMI SE of 27.1 dB, which is superior to those reported in most of the previous work (Table S1†).17,37–43 On the one hand, the excluded volume effect caused by the foam structure can drive randomly distributed CNTs to the cell skeleton and thus promote the construction of more perfect conductive networks. On the other hand, the existence of numerous interfaces between the cell skeleton and cells enhances the multi-reflection and absorption of the electromagnetic waves. The abovementioned effects are conducive to improving the EMI SE of the CNT/HDPE foam composites.
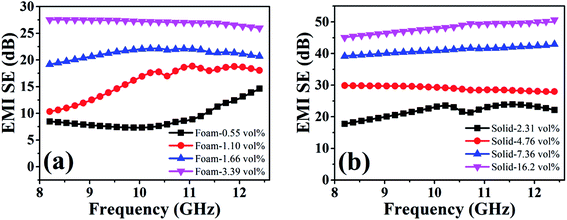 | ||
| Fig. 4 EMI SE as a function of frequency in the X-band range for the CNT/HDPE foam composites (a) and solid composites (b) with different CNT volume fractions. | ||
In the evaluation of the EMI shielding effect of a CPC, the weight content of the electrical filler is also considered in some cases. Fig. 5a shows the average EMI SE of the CNT/HDPE foam and solid composites with CNT weight content. At the same CNT content, the foam composites exhibit a lower EMI SE than the solid composites. This phenomenon is mainly ascribed to the dramatic reduction of effective ingredients, blocking electromagnetic waves by introducing cells in the CNT/HDPE foam composites. Note that the effective thickness of the foam composites interacting with the electromagnetic waves is only 0.58 mm, significantly smaller than that for the solid composites (2.5 mm). Therefore, the specific EMI SE (EMI SE divided by material density) is more appropriate to compare the shielding performance of the foam and solid composites, as proposed by Gupta et al.13 Fig. 5b shows that the average specific EMI SE of the CNT/HDPE foam composites is 1.7–2.2 times that of the solid composites, showing their superior EMI shielding performance once again.
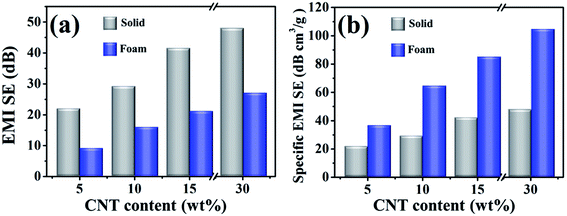 | ||
| Fig. 5 The average EMI SE (a) and specific EMI SE (b) of the CNT/HDPE foam and solid composites with CNT weight content. | ||
Aside from superior EMI shielding performance, the CNT/HDPE foam composites also exhibit stronger microwave absorption. Fig. 6 shows the power reflectivity (R) and absorptivity (A) of the CNT/HDPE foam and solid composites with 30 wt% and 15 wt% CNT content. It is observed that the foam composites show a lower R value but a higher A value in comparison to the solid composites. For instance, at a frequency of 8.2 GHz, the values of R (A) are ∼17.0% (81.8%) and ∼35.0% (64.8%) for the foam composites with 15 and 30 wt% CNT content, respectively, while the corresponding values are ∼54.8% (45.2%) and ∼66.9% (33.1%) for the solid composites. It is well known that the addition of CNTs enhances the dielectric constant of CPCs and intensifies the impedance mismatch between the CPC and air, resulting in increased electromagnetic wave reflection at the CPC surface. Fortunately, the integration of cells into the CNT/HDPE foam composites significantly relieves the impedance mismatch, which is conducive to reducing the wave reflection.44 The low power reflectivity and higher absorptivity in combination with the high EMI SE enable the CNT/HDPE foam composites to be used for potential applications in the field of microwave absorption.
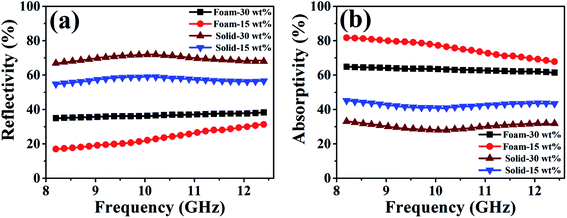 | ||
| Fig. 6 Power reflectivity (a) and absorptivity (b) of the CNT/HDPE foam and solid composites at CNT loadings of 15 and 30 wt%. | ||
The relationship between the EMI shielding performance and the pore size in the CNT/HDPE foam composites was also investigated. At a fixed foam density of 0.26 g cm−3 and a CNT content of 30 wt%, CNT/HDPE foam composites with three kinds of pore sizes were fabricated and their morphological observations are shown in Fig. 7. The pore size gradually decreases with a decrease in the particle size, as shown in Fig. 7a–c. The corresponding foam composites are labeled as L-CNT/HDPE, M-CNT/HDPE, and S-CNT/HDPE, respectively.
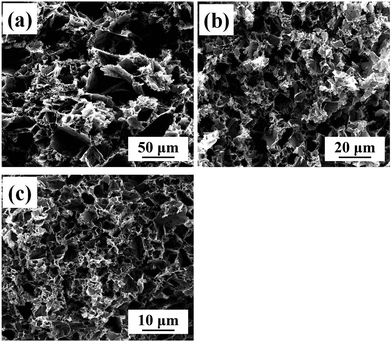 | ||
| Fig. 7 SEM micrographs of the CNT/HDPE foam composites with various pore sizes: large (a), moderate (b), and small (c). | ||
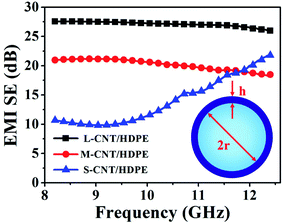
Fig. 8 shows the EMI SE of L-CNT/HDPE, M-CNT/HDPE, and S-CNT/HDPE. It can be seen that the EMI SE of L-CNT/HDPE and M-CNT/HDPE is almost independent of the frequency, while the EMI SE of S-CNT/HDPE strongly interacts with the frequency, especially at high frequencies. As the pore size reduces, the average EMI SE values are 27.1, 20.2, and 13.9 dB for L-CNT/HDPE, M-CNT/HDPE, and S-CNT/HDPE, respectively. As shown in the inset of Fig. 8, the CaCO3 particles are assumed to be ideal spheres with a radius of r and the CNT/HDPE layers are uniformly coated on the CaCO3 surface with a thickness of h. The relationship between h and r can be expressed by the following equation:
4 Conclusions
CNT/HDPE foam composites with a high EMI SE (27.1 dB) and low density (0.26 g cm−3) were easily fabricated using a compression molding and salt-leaching method. The excluded volume effect caused by the foam structure promoted the local concentration of CNTs in the HDPE skeleton, thus leading to a lower percolation threshold and higher electrical conductivity for the CNT/HDPE foam composites compared to those of the solid composites. The superior electrical conductivity endowed the foam composites with a superior EMI shielding performance, with a specific EMI SE of about 2.2 times that of the solid composites. Moreover, the power reflectivity of the electromagnetic waves was significantly reduced from 55% for the solid composites to 17% for the foam composites. The integrated low reflectivity and high EMI SE are conducive to extending the application of the CNT/HDPE foam composites to microwave absorption.Conflicts of interest
There are no conflicts to declare.Acknowledgements
The authors gratefully acknowledge financial support from the National Natural Science Foundation of China (Grant No. 51673134, 21704070, 51721091, 51773167), the Fundamental Research Funds for the Central Universities and the Science and Technology Department of Sichuan Province (Grant No. 2017GZ0412), and the Fundamental Research Funds for the Central Universities (2017SCU04A03, sklpme2017306).References
- F. Shahzad, M. Alhabeb, C. B. Hatter, B. Anasori, S. Man Hong, C. M. Koo and Y. Gogotsi, Science, 2016, 353, 1137–1140 CrossRef CAS PubMed.
- J. Liu, H. B. Zhang, R. Sun, Y. Liu, Z. Liu, A. Zhou and Z. Z. Yu, Adv. Mater., 2017, 29, 1702367 CrossRef PubMed.
- W. L. Song, L. Z. Fan, M. S. Cao, M. M. Lu, C. Y. Wang, J. Wang, T. T. Chen, Y. Li, Z. L. Hou, J. Liu and Y. P. Sun, J. Mater. Chem. A, 2014, 2, 5057–5064 CAS.
- L. C. Jia, D. X. Yan, Y. Yang, D. Zhou, C. H. Cui, E. Bianco, J. Lou, R. Vajtai, B. Li, P. M. Ajayan and Z. M. Li, Adv. Mater. Technol., 2017, 2, 1700078 CrossRef.
- Y. Chen, H. B. Zhang, Y. Yang, M. Wang, A. Cao and Z. Z. Yu, Adv. Funct. Mater., 2016, 26, 447–455 CrossRef CAS.
- L. C. Jia, D. X. Yan, C. H. Cui, X. Jiang, X. Ji and Z. M. Li, J. Mater. Chem. C, 2015, 3, 9369–9378 RSC.
- K. Zhang, H. O. Yu, Y. D. Shi, Y. F. Chen, J. B. Zeng, J. Guo, B. Wang, Z. Guo and M. Wang, J. Mater. Chem. C, 2017, 5, 2807–2817 RSC.
- M. H. Al-Saleh, W. H. Saadeh and U. Sundararaj, Carbon, 2013, 60, 146–156 CrossRef CAS.
- S. T. Hsiao, C. C. M. Ma, H. W. Tien, W. H. Liao, Y. S. Wang, S. M. Li, C. Y. Yang, S. C. Lin and R. B. Yang, ACS Appl. Mater. Interfaces, 2015, 7, 2817–2826 CAS.
- L. C. Jia, Y. K. Li and D. X. Yan, Carbon, 2017, 121, 267–273 CrossRef CAS.
- Q. F. Jing, J. Y. Law, L. P. Tan, V. V. Silberschmidt, L. Li and Z. L. Dong, Composites, Part A, 2015, 70, 8–15 CrossRef CAS.
- L. C. Jia, M. Z. Li, D. X. Yan, C. H. Cui, H. Y. Wu and Z. M. Li, J. Mater. Chem. C, 2017, 5, 8944–8951 RSC.
- Y. Yang, M. C. Gupta, K. L. Dudley and R. W. Lawrence, Nano Lett., 2005, 5, 2131–2134 CrossRef CAS PubMed.
- J. Liu, H. B. Zhang, Y. Liu, Q. Wang, Z. Liu, Y. W. Mai and Z. Z. Yu, Compos. Sci. Technol., 2017, 151, 71–78 CrossRef CAS.
- C. H. Cui, D. X. Yan, H. Pang, L. C. Jia, X. Xu, S. Yang, J. Z. Xu and Z. M. Li, Chem. Eng. J., 2017, 323, 29–36 CrossRef CAS.
- Y. J. Chen, Y. Li, B. T. T. Chu, I. T. Kuo, M. Yip and N. Tai, Composites, Part B, 2015, 70, 231–237 CrossRef CAS.
- D. X. Yan, P. G. Ren, H. Pang, Q. Fu, M. B. Yang and Z. M. Li, J. Mater. Chem., 2012, 22, 18772–18774 RSC.
- J. Li, H. Liu, J. Guo, Z. Hu, Z. Wang, B. Wang, L. Liu, Y. Huang and Z. Guo, J. Mater. Chem. C, 2017, 5, 1095–1105 RSC.
- Z. Chen, C. Xu, C. Ma, W. Ren and H. M. Cheng, Adv. Mater., 2013, 25, 1296–1300 CrossRef CAS PubMed.
- B. Shen, Y. Li, W. Zhai and W. Zheng, ACS Appl. Mater. Interfaces, 2016, 8, 8050–8057 CAS.
- J. M. Thomassin, C. Jérôme, T. Pardoen, C. Bailly, I. Huynen and C. Detrembleur, Mater. Sci. Eng., R, 2013, 74, 211–232 CrossRef.
- J. Ling, W. Zhai, W. Feng, B. Shen, J. Zhang and W. g. Zheng, ACS Appl. Mater. Interfaces, 2013, 5, 2677–2684 CAS.
- B. Shen, W. Zhai, M. Tao, J. Ling and W. Zheng, ACS Appl. Mater. Interfaces, 2013, 5, 11383–11391 CAS.
- D. X. Yan, H. Pang, B. Li, R. Vajtai, L. Xu, P. G. Ren, J. H. Wang and Z. M. Li, Adv. Funct. Mater., 2015, 25, 559–566 CrossRef CAS.
- C. Li, G. Yang, H. Deng, K. Wang, Q. Zhang, F. Chen and Q. Fu, Polym. Int., 2013, 62, 1077–1084 CAS.
- N. Athanasopoulos, A. Baltopoulos, M. Matzakou, A. Vavouliotis and V. Kostopoulos, Polym. Compos., 2012, 33, 1302–1312 CrossRef CAS.
- M. Antunes, M. Mudarra and J. I. Velasco, Carbon, 2011, 49, 708–717 CrossRef CAS.
- A. Fletcher, M. C. Gupta, K. L. Dudley and E. Vedeler, Compos. Sci. Technol., 2010, 70, 953–958 CrossRef CAS.
- V. Eswaraiah, V. Sankaranarayanan and S. Ramaprabhu, Macromol. Mater. Eng., 2011, 296, 894–898 CrossRef CAS.
- J. M. Thomassin, C. Pagnoulle, L. Bednarz, I. Huynen, R. Jerome and C. Detrembleur, J. Mater. Chem. C, 2008, 18, 792–796 RSC.
- D. X. Yan, L. Xu, C. Chen, J. H. Tang, X. Ji and Z. M. Li, Polym. Int., 2012, 61, 1107–1114 CrossRef CAS.
- S. Kirkpatrick, Rev. Mod. Phys., 1973, 45, 574 CrossRef.
- N. Inaba, K. Sato, S. Suzuki and T. Hashimoto, Macromolecules, 1986, 19, 1690–1695 CrossRef CAS.
- I. Balberg, Phys. Rev. Lett., 1987, 59, 1305–1308 CrossRef CAS PubMed.
- Y. Chen, H. B. Zhang, Y. Yang, M. Wang, A. Cao and Z. Z. Yu, Adv. Funct. Mater., 2016, 26, 447–455 CrossRef CAS.
- L. C. Jia, D. X. Yan, C. H. Cui, X. Ji and Z. M. Li, Macromol. Mater. Eng., 2016, 301, 1232–1241 CrossRef CAS.
- Y. Yang, M. C. Gupta, K. L. Dudley and R. W. Lawrence, Nano Lett., 2005, 5, 2131–2134 CrossRef CAS PubMed.
- J. Ling, W. Zhai, W. Feng, B. Shen, J. Zhang and W. g. Zheng, ACS Appl. Mater. Interfaces, 2013, 5, 2677–2684 CAS.
- H. B. Zhang, Q. Yan, W. G. Zheng, Z. He and Z. Z. Yu, ACS Appl. Mater. Interfaces, 2011, 3, 918–924 CAS.
- Y. Li, X. Pei, B. Shen, W. Zhai, L. Zhang and W. Zheng, RSC Adv., 2015, 5, 24342–24351 RSC.
- M. M. Bernal, M. Martin-Gallego, I. Molenberg, I. Huynen, M. A. L. Manchado and R. Verdejo, RSC Adv., 2014, 4, 7911–7918 RSC.
- L. Monnereau, L. Urbanczyk, J. M. Thomassin, T. Pardoen, C. Bailly, I. Huynen, C. Jérôme and C. Detrembleur, Polymer, 2015, 59, 117–123 CrossRef CAS.
- H. Wang, K. Zheng, X. Zhang, X. Ding, Z. Zhang, C. Bao, L. Guo, L. Chen and X. Tian, Compos. Sci. Technol., 2016, 125, 22–29 CrossRef CAS.
- J. M. Thomassin, D. Vuluga, M. Alexandre, C. Jérôme, I. Molenberg, I. Huynen and C. Detrembleur, Polymer, 2012, 53, 169–174 CrossRef CAS.
Footnote |
| † Electronic supplementary information (ESI) available. See DOI: 10.1039/c7ra13453c |
| This journal is © The Royal Society of Chemistry 2018 |


