DOI:
10.1039/C7RA12897E
(Paper)
RSC Adv., 2018,
8, 9564-9573
The synthesis of two-dimensional MoS2 nanosheets with enhanced tribological properties as oil additives†
Received
29th November 2017
, Accepted 1st March 2018
First published on 6th March 2018
Abstract
The use of MoS2 nanosheets as oil additives has been proved effective to reduce friction and wear. Furthermore, it has been suggested that the synthesis of MoS2 nanosheets with an ultrathin structure could benefit the friction and wear reduction, as they would penetrate into the contact area easily. In this paper, two-dimensional MoS2 nanosheets were successfully fabricated by a solvothermal method with the aid of oleylamine. Meanwhile, the synthesized MoS2 nanosheets exhibited perfect dispersing stability in paraffin oil, due to the surface modification by oleylamine molecules. The friction and wear properties of the synthesized MoS2 nanosheets as oil additives were investigated using a ball-on-disk tribotester. The results showed that the two-dimensional MoS2 nanosheets exhibited enhanced friction-reducing and antiwear behaviors as compared to the multilayered MoS2 nanosheets. The prominent tribological performance of the two-dimensional MoS2 nanosheets was attributed to the formation of a thick tribofilm inside the wear tracks, which was confirmed by XPS analyses of the rubbing interfaces.
1. Introduction
The discovery and identification of graphene in 2004 (ref. 1) has evoked an explosion of interest in other two-dimensional (2D) nanomaterials.2 As a typical example, 2D molybdenum disulfide (MoS2) has a structure analogous to graphene, in which two close-packed sulfur atom layers sandwich one molybdenum atom layer and these layers are held together by van der Waals forces.3 Due to their extremely thin structure, the 2D MoS2 nanosheets exhibit unique mechanical, electrical, thermal and optical properties,4 making them significantly different from their bulk counterparts and also resulting in their application in catalysis,5,6 electronics,7 photonics,8 energy storage,9,10 and sensors.11
Over the past few decades, MoS2 nanoparticles with various morphologies, such as nanosheets,12 flower-like structure,13 sphere-like structure14 and fullerene-like structure,15 have been used as oil additives. Meanwhile, the lubrication mechanisms of MoS2 nanoparticle in oils have been extensively studied and suggested as rolling, interlayer sliding and exfoliation–material transferring.16 In particular, the formation of a tribofilm composed of MoS2 molecules has been emphasized as the key mechanism for decreasing the friction and wear.17 In addition, Chen et al.18 recently reported the excellent extreme pressure property of ultrathin MoS2 nanosheets as oil additives. They suggested that the ultrathin shape of MoS2 nanosheets could ensure the entrance of the nanosheets into the rubbing interfaces. Therefore, it is desirable to fabricate 2D MoS2 nanosheets to be used as oil additives, as they could be penetrated into the contact area easily.
According to the relevant literatures, it is found that the existing research on 2D MoS2 nanosheets has largely relied on the exfoliation method,19 chemical vapor deposition method20 or solvothermal route.21 For example, Dong et al.22 fabricated 2D MoS2 nanosheets via the sonication assisted liquid exfoliation in organic solvents. However, the prepared ultrathin MoS2 nanosheets had a large distribution in particle size. Meanwhile, Bang et al.23 proposed that the exfoliation method may induce a phase change of the bulk MoS2. In addition, there are other disadvantages associated with the exfoliation method, such as, the time-consuming process and the aggregation of the exfoliated nanosheets after the solvent being removed.24,25 As to the chemical vapor deposition method, it needs rigorous experimental conditions, such as high temperature, high vacuum and special substrates, which could limit the practical application of 2D MoS2 nanosheets.26 By comparison, the solvothermal method could allow the production of large quantities of 2D MoS2 nanosheets along with the advantages of low cost, simple operation, and minimal environmental impact.27,28
Therefore, the solvothermal method was employed in this work to synthesize 2D MoS2 nanosheets by using heptamolybdate tetrahydrate and thiourea as precursors in oleylamine. The tribological behavior of the 2D MoS2 nanosheets as oil additives was investigated by a ball-on-disk tribotester. This objective of this paper is to explore the potential of 2D MoS2 nanosheets to serve as oil additives.
2. Experimental section
2.1 Materials
Ammonium heptamolybdate tetrahydrate ((NH4)6Mo7O24·4H2O), thiourea ((NH2)2CS) were purchased from Sinopharm Chemical Reagent Co., Ltd. (China). Oleylamine (C18H37N) was purchased from Sigma Aldrich. All chemicals were used as received without further treatment.
2.2 Materials preparation and characterization
Two-dimensional MoS2 nanosheets (2D MoS2) were synthesized through a solvothermal route. In a typical synthesis, 0.618 g heptamolybdate tetrahydrate ((NH4)6Mo7O24·4H2O) and 1.14 g thiourea ((NH2)2CS) were added to 30 mL of oleylamine solution. The mixture was then heated to 130 °C under a N2 flow and held for 30 min, enabling the (NH4)6Mo7O24·4H2O and N2H4CS to be dissolved completely. After that, the solution was transferred into a 50 mL autoclave and kept at 200 °C for 12 h. The black precipitates were collected by centrifugation, washed with hexane and ethanol, and dried in vacuum at 60 °C for 6 h. For comparison purpose, multilayered MoS2 nanosheets (ML MoS2) were obtained via the same procedure, while using pure distilled water, instead of oleylamine, as the reaction solvent. The transmission electron microscopy (TEM, JEM-2010) was used to observe the morphology of the synthesized samples. Power X-ray diffraction (XRD, Thermo Fisher ESCALAB 250Xi Diffractometer with Cu Kα radiation) was employed to identify their phase structures. Raman spectra were collected on a Horiba Jobin Yvon Raman spectrometer with a laser excitation wavelength of 514.5 nm. Fourier transform infrared (FTIR) spectra were obtained on a TGA 2050 infrared spectrometer at a spectral resolution of 4 cm−1. Thermogravimetric analysis (TGA, SDT Q600) was conducted under air flow with a heating rate of 10 °C min−1. X-ray photoelectron spectroscopy (XPS) was carried out on a PHI Quantera X-ray photoelectron spectrometer.
2.3 Friction tests
The synthesized MoS2 samples were distributed into the base oil (liquid paraffin) by 30 min ultrasonication. A ball-on-disk tribotester (Optimal SRV 4) was used to examine the tribological behavior of these oils. The friction tests were conducted at stroke of 2 mm and frequency of 50 Hz. Each friction test lasted for 1 hour and was repeated three times. A commercially available AISI-52100 steel ball with diameter of 10 mm, hardness of 61–63 HRC and surface roughness of 25 nm was chosen as the upper specimen. The counterpart was an AISI-52100 steel disk with diameter of 24 mm, height of 7.88 mm and surface roughness of 50 nm. After friction tests, the topographies of the wear tracks on the disks were examined by SEM. Meanwhile, the depth of the wear tracks on the disks was measured using a white-light interference profilometer (Phase Shift MicroXAM-3D). The XPS technique was also used to investigate the tribo-reaction film inside the wear tracks.
3. Results and discussion
3.1 Characterizations of the synthesized samples
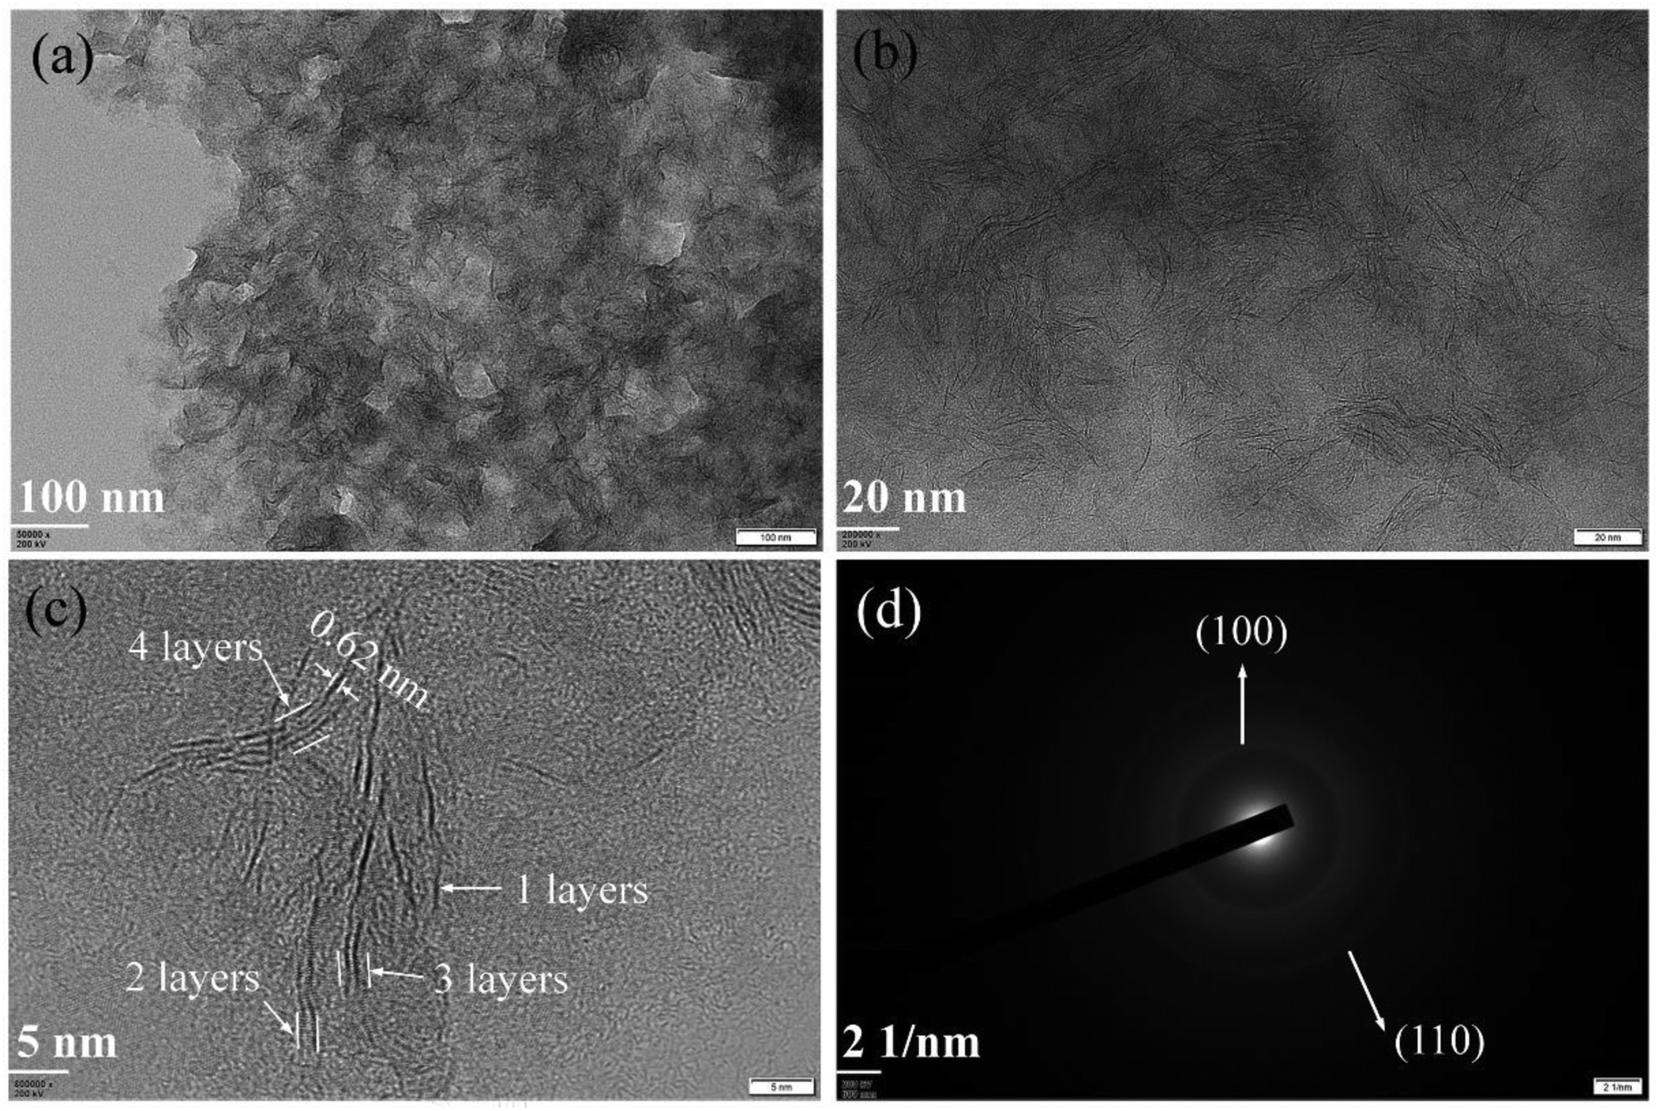
The morphologies of synthesized samples were observed by TEM. As Fig. 1a and b shown, the multilayered MoS2 nanosheets (ML MoS2) present a cluster-like shape and consist of accumulated nanosheets. It is also found that the nanosheets in the ML MoS2 are stacked densely with an interlayer separation of 0.62 nm (Fig. 1c). The SAED pattern of the ML MoS2 (Fig. 1d) consists of four diffraction rings that could be indexed to the (002), (100), (103) and (110) planes of MoS2.29 The morphology of the two-dimensional MoS2 nanosheets (2D MoS2) was also examined by TEM (Fig. 2). As Fig. 2a and b shown, the obtained 2D MoS2 is comprised of ultrathin nanosheets with lateral size ranging from 20 nm to 30 nm. It is also found that a fraction of the nanosheets are slightly curved, similar to the phenomenon reported by Savjani et al.30 The reason is that such ultrathin nanosheets are unstable and easy to form closed structures by rolling up to eliminate dangling bonds at the edges.31 The extremely thin structure of the 2D MoS2 is clearly shown in Fig. 2c, as it observes that each nanosheet is composed of one to four layers. The interlayer distance measured from Fig. 2c is 0.62 nm, consistent with the (002) d-spacing for the hexagonal MoS2. The SAED pattern illustrates the polycrystalline nature of the 2D MoS2, as no clear spots corresponding to the (100) and (110) planes of MoS2 observed, only highly diffused bands (Fig. 2d).
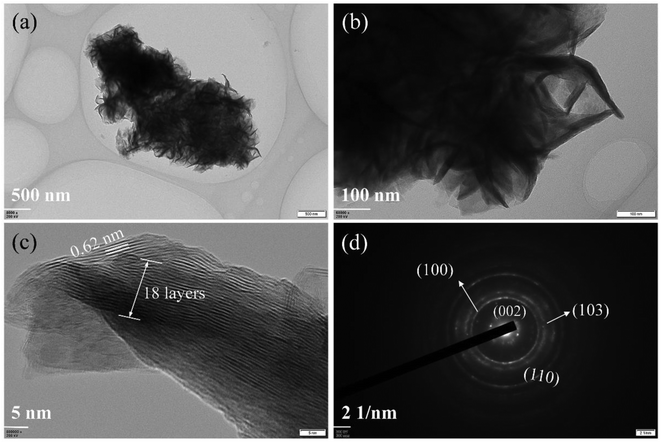 |
| | Fig. 1 (a and b)TEM images, (c) HRTEM image and (d) SAED pattern of the synthesized ML MoS2. | |
 |
| | Fig. 2 (a and b)TEM images, (c) HRTEM image and (d) SAED pattern of the synthesized 2D MoS2. | |
The phase structures of the synthesized samples were investigated by the XRD. As Fig. 3a shown, all the diffraction peaks of the two samples can be indexed to the hexagonal MoS2 (JCPDS no. 37-1492). Meanwhile, the ML MoS2 displays a strong and sharp (002) diffraction peak, suggesting the well-layered structure of this sample. However, there is no (002) diffraction peak detected in the 2D MoS2. It indicates that the stacking of the (002) plane in the 2D MoS2 is significantly inhibited and extremely thin MoS2 nanosheets were obtained. In addition, according to the Bragg's equation, the d-spacing for the (002) plane in the ML MoS2 is calculated to be 0.62 nm, consistent with the TEM analysis (Fig. 1c). Fig. 3b showed the Raman spectra of the two samples. The Raman test of MoS2 should presents two kinds of optical phonon modes (E12g and A1g), where E12g is the in-plane sulfur–molybdenum vibrations and A1g corresponds to the out-plane sulfur vibrations. As Fig. 3b shown, the E12g and A1g modes of the ML MoS2 are detected at 381.9 and 402.7 cm−1, respectively. For the 2D MoS2, the frequencies of the E12g and A1g modes are found at the positions of 379.6 cm−1 and 408.4 cm−1, respectively. It has been reported before that the space between the Raman modes of E12g and A1g could decrease as the layer number of MoS2 nanosheets decreases.32 From Fig. 3b, it is observed that the ML MoS2 exhibits a separation of 26.5 cm−1 between the Raman modes of E12g and A1g. While the 2D MoS2 shows the two Raman modes separated by 23.1 cm−1. This indicates that the numbers of layers in the 2D MoS2 have a reduction as compared with the ML MoS2. In addition, the value of 23.1 cm−1 conforms to the peak separation observed for tri-layered MoS2 nanosheets.32
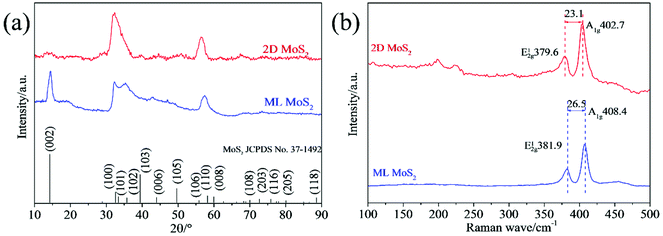 |
| | Fig. 3 (a) XRD patterns and (b) Raman spectra of the synthesized MoS2 samples. | |
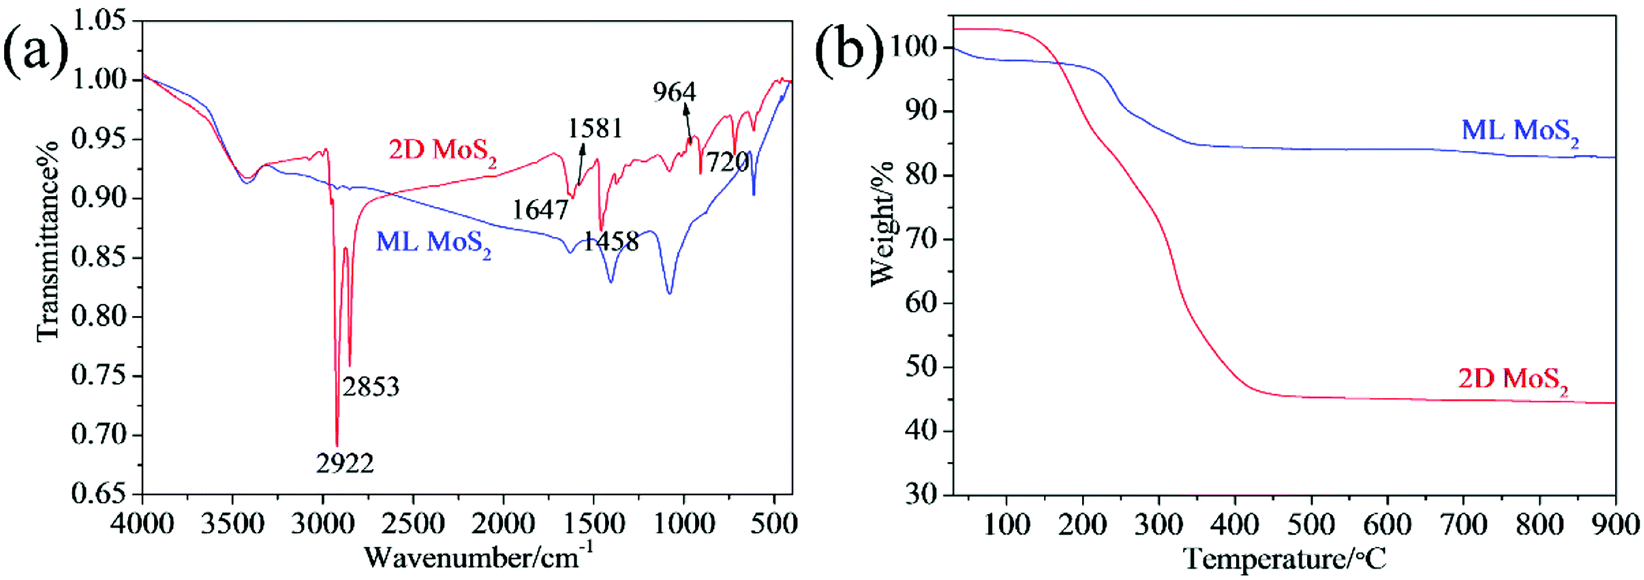
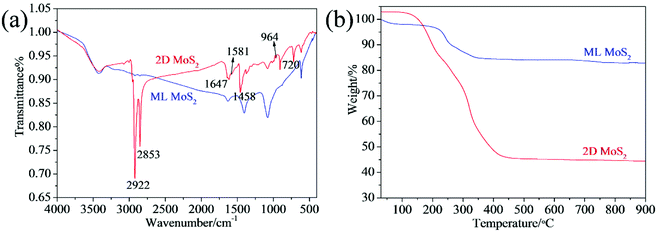
Fig. 4a presents the FTIR spectra of the two MoS2 samples. The absorptions at 1402, 1080, 875 and 607 cm−1 can be attributed to the MoS2.33 Comparing with the ML MoS2, several new bands are observed in the FTIR spectrum for the 2D MoS2. The bands at 2922 cm−1 and 2853 cm−1 can be assigned, respectively, to the asymmetric and symmetric vibrations of the C–H in oleylamine. The band at around 1647 cm−1 can be attributed to the stretching vibration of the C![[double bond, length as m-dash]](https://www.rsc.org/images/entities/char_e001.gif) C present in oleylamine.34 The peaks at 1458 cm−1 and 722 cm−1 can be assigned to the bending vibrations of the C–H and C–C from oleylamine. In addition, there is characteristics signal of the amine group: the peak at 1581 cm−1 due to the –NH2 scissoring mode and the peak due to –NH2 bending mode at 964 cm−1.28 The FTIR results confirm that the surfaces of the 2D MoS2 were attached by oleylamine molecules. Thermogravimetric analysis (TGA) was further carried out to determine the amount of oleylamine present in the 2D MoS2 (Fig. 4b). For the ML MoS2, the main weight loss (11.2 wt%) takes place around the temperature range of 200 to 380 °C, due to the oxidation of MoS2 into MoO3 in air. There is also a weight loss (2 wt%) below 100 °C, which can be attributed to the removal of absorbed water. For the 2D MoS2, after oleylamine molecules attached onto their surfaces, the total weight loss increases to 56.2 wt%. From Fig. 4b, it can be estimated that the amount of oleylamine attached onto the surfaces of the 2D MoS2 is about 51.2 wt%.
C present in oleylamine.34 The peaks at 1458 cm−1 and 722 cm−1 can be assigned to the bending vibrations of the C–H and C–C from oleylamine. In addition, there is characteristics signal of the amine group: the peak at 1581 cm−1 due to the –NH2 scissoring mode and the peak due to –NH2 bending mode at 964 cm−1.28 The FTIR results confirm that the surfaces of the 2D MoS2 were attached by oleylamine molecules. Thermogravimetric analysis (TGA) was further carried out to determine the amount of oleylamine present in the 2D MoS2 (Fig. 4b). For the ML MoS2, the main weight loss (11.2 wt%) takes place around the temperature range of 200 to 380 °C, due to the oxidation of MoS2 into MoO3 in air. There is also a weight loss (2 wt%) below 100 °C, which can be attributed to the removal of absorbed water. For the 2D MoS2, after oleylamine molecules attached onto their surfaces, the total weight loss increases to 56.2 wt%. From Fig. 4b, it can be estimated that the amount of oleylamine attached onto the surfaces of the 2D MoS2 is about 51.2 wt%.
 |
| | Fig. 4 (a) FTIR spectra; (b) TGA results of the synthesized MoS2 samples. | |
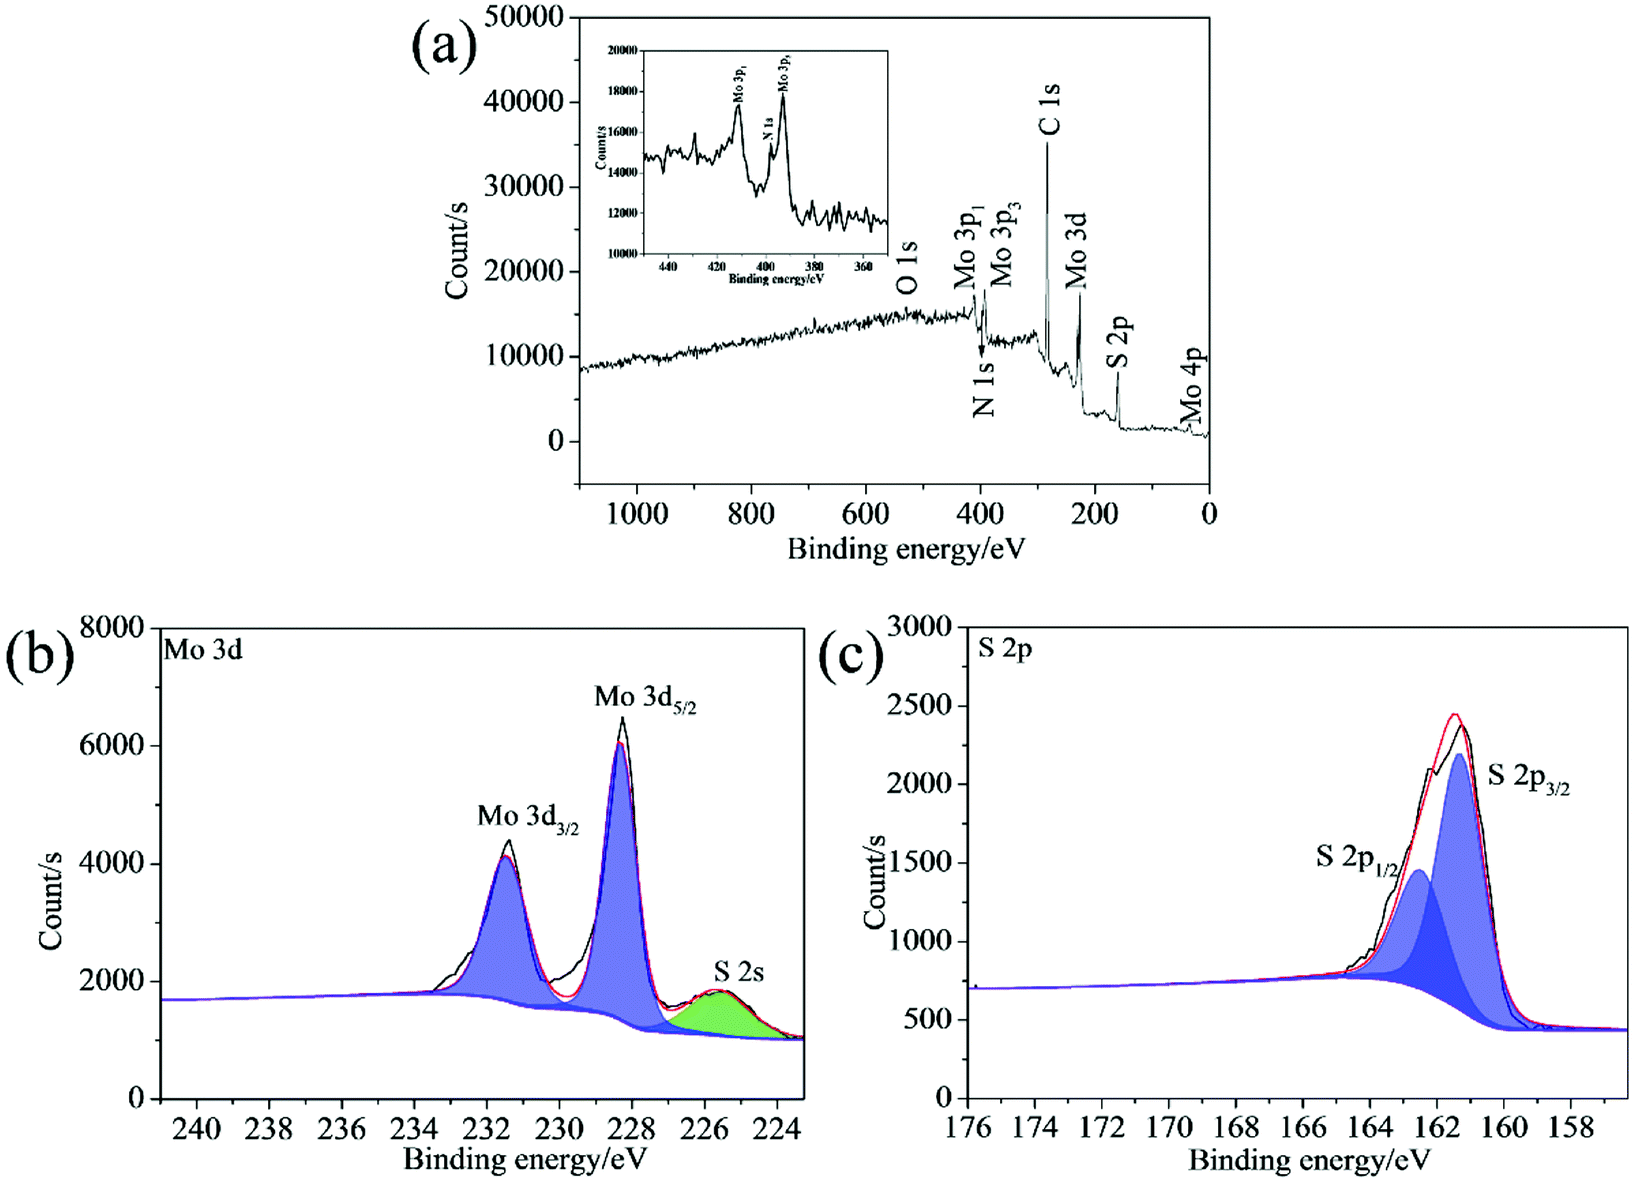
The chemical composition of the synthesized samples was investigated using the XPS. The survey spectrum indicates the coexistence of C, Mo, S and N elements in the 2D MoS2 (Fig. 5a). The N element could come from oleylamine molecules attached onto the surfaces of the 2D MoS2. The high resolution of Mo 3d displays two peaks at 231.27 and 228.13 eV, which can be ascribed to the Mo 3d3/2 and Mo 3d5/2 doublet (Fig. 5b). The peak at the position of about 225.41 eV in the Mo 3d spectrum belongs to the S 2s. The S 2p spectrum can be deconvoluted into two peaks at 162.28 and 161.09 eV, corresponding to the S 2p1/2 and S 2p3/2 orbital (Fig. 5c). The binding energies of the Mo 3d and S 2p are consistent with the reported values for the MoS2 particles prepared by other researchers,35,36 confirming the expected chemical states of Mo4+ and S2− in the 2D MoS2. The binding energies of the Mo 3d and S 2p in the ML MoS2 also correspond to the expected values for MoS2 particles (Fig. S1†).
 |
| | Fig. 5 (a) XPS survey spectrum and high-resolution XPS spectra of (b) Mo 3d; (c) S 2p for the synthesized 2D MoS2. | |
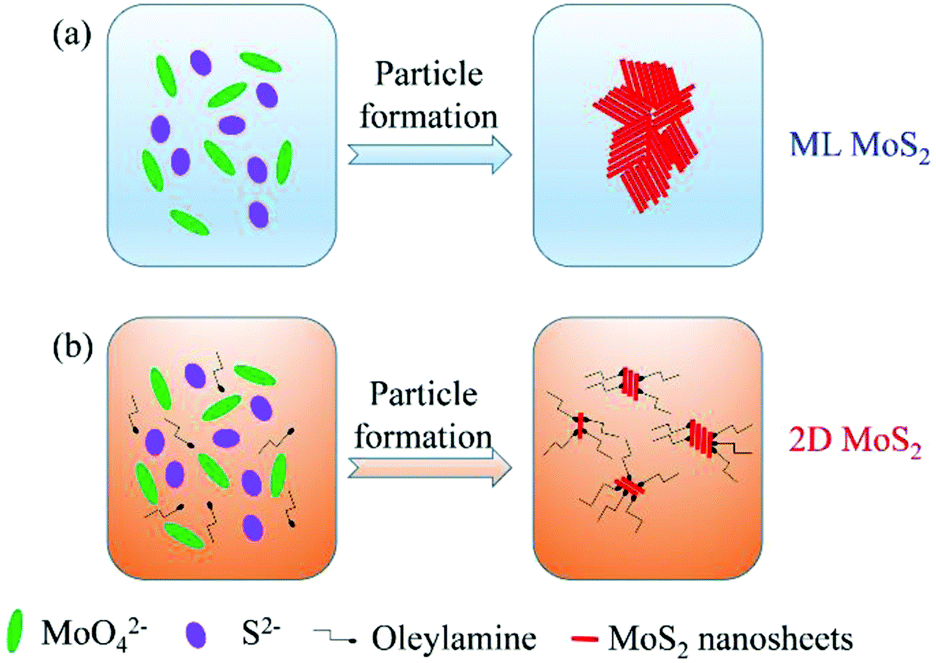
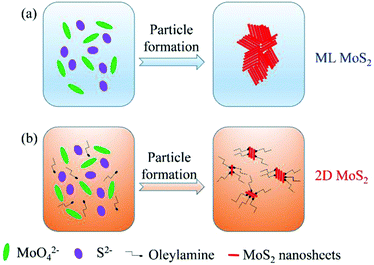
Based on the above results, the reasonable formation procedure for the 2D MoS2 is shown in Fig. 6. When using the pure distilled water as the reaction solvent, the MoS2 nanosheets could aggregate together to form cluster-like structures. In this case, multilayered MoS2 nanosheets (ML MoS2) were obtained. While in the case of employing oleylamine as the reaction solvent, the growth of MoS2 grains were wrapped around by oleylamine molecules. Oleylamine is known as a ligand that binds tightly to the metal nanoparticles surfaces.34 Therefore, oleylamine molecules were attached onto the surfaces of MoS2 nanosheets to inhibit the growth of the nanosheets in the synthetic route. In addition, the long carbon chain of oleylamine can provide great steric hindrance to prevent the aggregation of the MoS2 nanosheets. As a result, oleylamine-modified MoS2 nanosheets with single or few layers were obtained.
 |
| | Fig. 6 The reasonable formation procedure for the 2D MoS2. | |
3.2 Tribological property
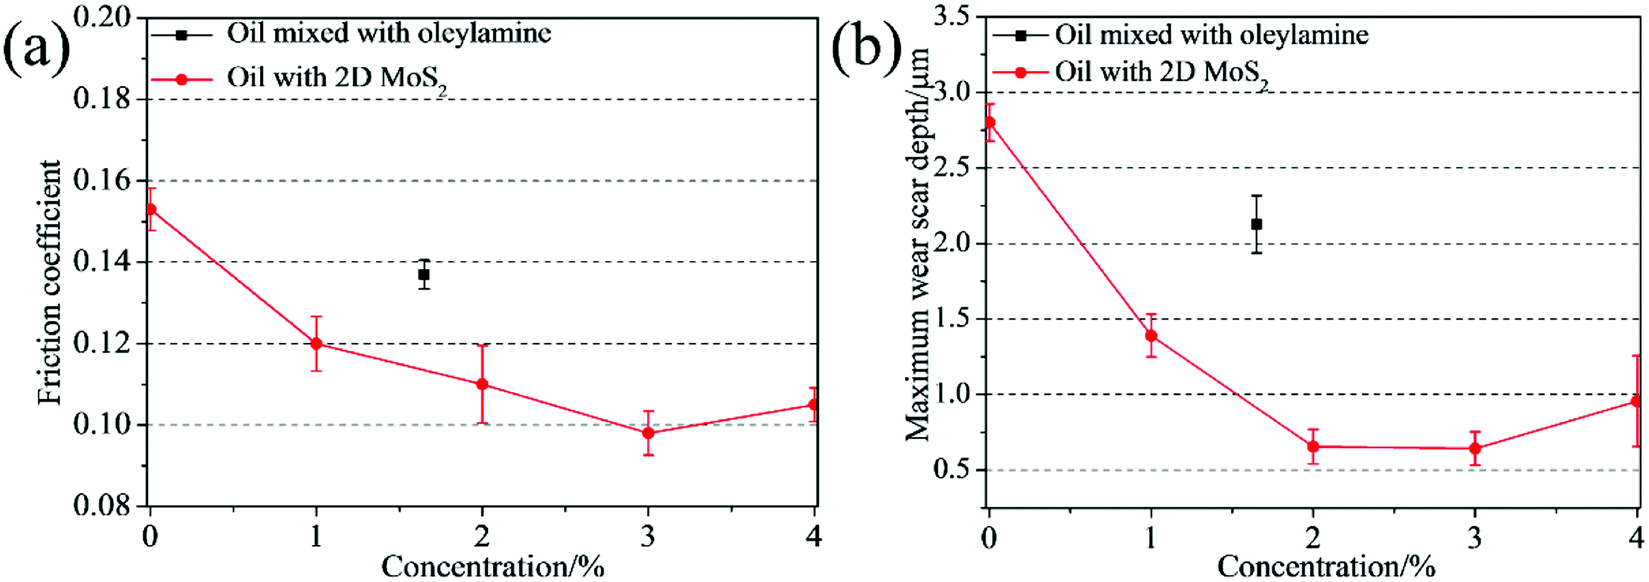
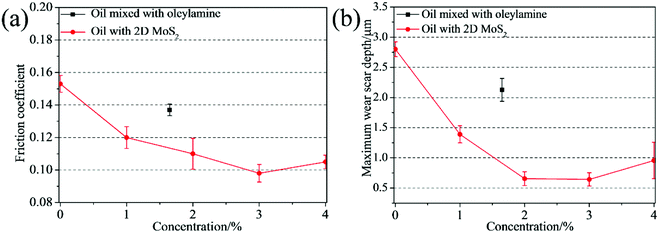
In order to confirm the merits of the 2D MoS2 as oil additives, the tribological behaviors of the oils dispersed with 2D MoS2 or ML MoS2 were investigated. Fig. 7a shows the friction coefficient of the oils with different 2D MoS2 concentrations at the load of 100 N (corresponding to the initial maximum Hertz contact pressure of 2.32 GPa). It is observed that there is an obvious reduction in the friction coefficient when the oil with 2D MoS2 was used for lubrication. Meanwhile, it is found that the friction coefficient first decreases quickly and then rises slightly as the concentration of the 2D MoS2 increasing. The lowest friction coefficient (0.098) is obtained at the 2D MoS2 concentration of 3 wt%. In addition, the amount of oleylamine in the oil sample with 3 wt% 2D MoS2 is about 1.5 wt% through the TGA result (Fig. 4b). Therefore, the tribological behavior of the oil mixed with 1.5 wt% oleylamine was also tested. In this case, a friction coefficient of 0.137 is obtained and this value has no obvious variation from that of the base oil (0.153). This finding confirms that the excellent friction-reduction effect of the 2D MoS2 comes from the MoS2 nanosheets, instead of oleylamine. The antiwear property of these oil samples was analyzed using the maximum wear scar depth on the lower disks (Fig. 7b). The result is similar to the relationship between the friction coefficient and the 2D MoS2 concentration. The minimal wear can be found at the 2D MoS2 concentration of 3 wt%, and beyond this concentration the wear slightly rise. Fig. S2† shows the friction coefficient and maximum wear scar depth measured under the lubrication of the oil with ML MoS2. The friction coefficient and wear could decrease to some extent after adding the ML MoS2 into the base oil. However, the extent of decline in the friction coefficient and wear is far less than that lubricated with the 2D MoS2. It has been known that one of the key prerequisites for using nanoparticles as oil additives is their dispersing stability in oils. Fig. S3† shows the photos of the oil dispersed with 1.5 wt% ML MoS2 or 3 wt% 2D MoS2 after standing 7 days. No obvious precipitate is observed in the photo of the oil with 2D MoS2 (Fig. S3b†). This can be attributed to the surface modification of the 2D MoS2 by oleylamine molecules (Fig. 4). The result indicates that 2D MoS2 can be used as oil additives without the obstacle of poor dispersing stability in oils.
 |
| | Fig. 7 (a) Friction coefficients and (b) maximum wear scar depth as functions of the 2D MoS2 concentration in oils. | |
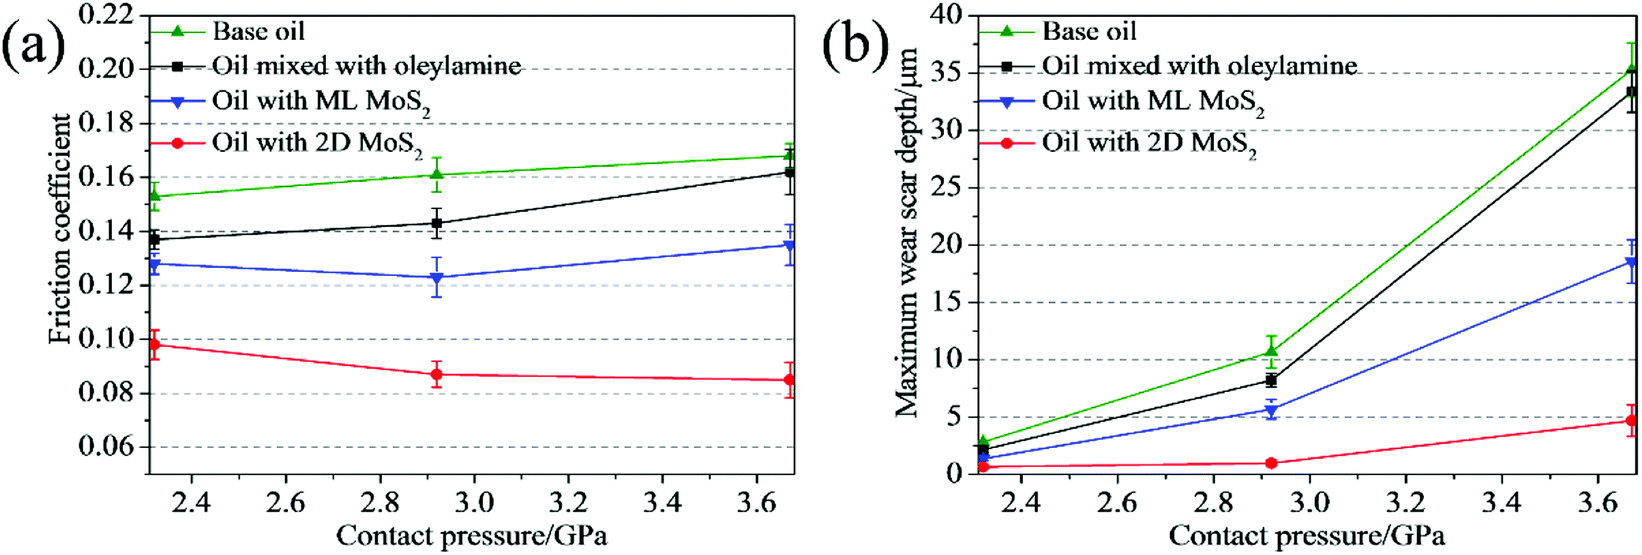
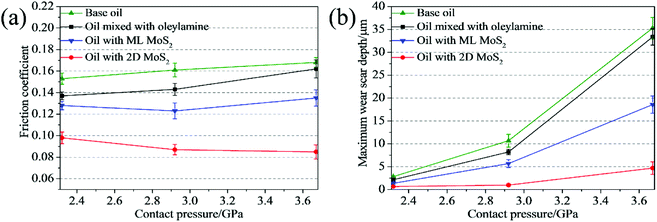
The effect of the load on the tribological behaviors of the oils was also investigated under the different loads of 100, 200 and 400 N, corresponding to initial maximum Hertz contact pressures of 2.32, 2.92 and 3.67 GPa, respectively. The oils with 3 wt% 2D MoS2 or 1.5 wt% ML MoS2 were selected as testing samples. From Fig. 8a, it is observed that the oil with 2D MoS2 exhibits a relatively smaller friction coefficient than the others under all testing loads. In addition, the friction-reducing behavior of the oil with 2D MoS2 gradually strengthens with the increasing contact pressure. Specially, comparing with the base oil, the friction coefficient of the oil with 2D MoS2 decreases 35.95% at the relatively low contact pressure of 2.32 GPa. Whereas its friction coefficient becomes much lower than that of the base oil when the contact pressure increases to 2.92 GPa (45.96%) and 3.67 GPa (49.40%). Meanwhile, it is observed that there is a reduction in the wear scar depth after the addition of MoS2 nanosheets into the base oil at any given load (Fig. 8b). While the wear reduction for the oil with 2D MoS2 is more remarkable as compared to the oil with ML MoS2. Further, it is also observed that wear resistance ability of the oil with 2D MoS2 enhances with the increasing contact pressure. As Fig. 8b shown, the maximum wear scar depth for the oil with 2D MoS2 is reduced by 3 times with respect to the base oil at lower contact pressure of 2.32 GPa. However, this behavior is amplified at higher contact pressure (2.92 or 3.67 GPa), where the maximum wear scar depth is at least reduced by 6 times.
 |
| | Fig. 8 (a) Friction coefficients and (b) maximum wear scar depth as functions of the contact pressure. | |
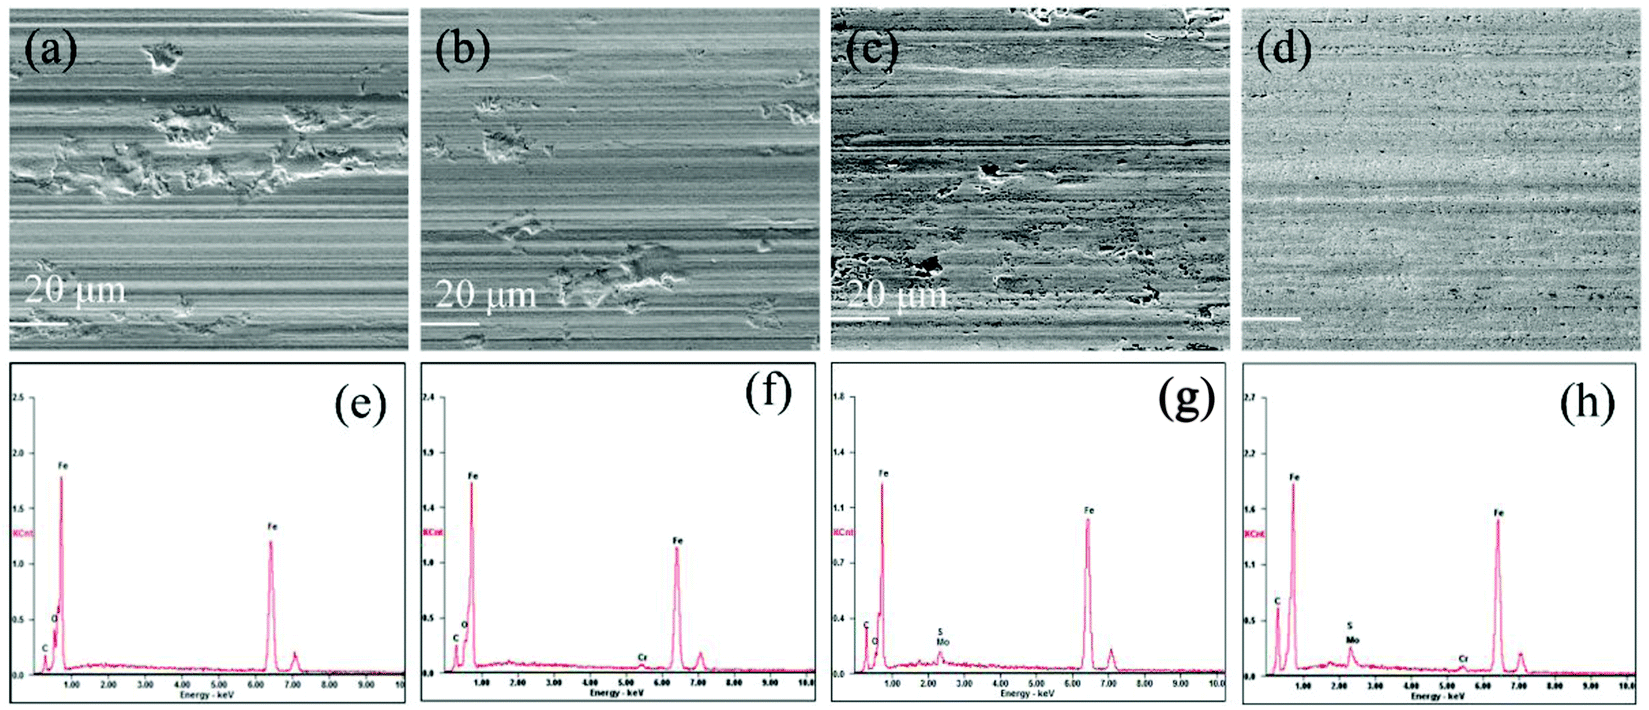
After friction tests (at 2.92 GPa), the topographies of the wear tracks on the lower disks were analyzed by the SEM. As shown in Fig. 9a, the surface of the wear track lubricated by the base oil is evidently rough and dominated by severe abrasion. This attributes to the poor antiwear property of the pure paraffin oil. For the wear track lubricated with oleylamine in the base oil, the worn surface is as well very rough and displays many deep furrows (Fig. 9b). This suggests that oleylamine has no obvious function in improving the antiwear property of the base oil. Similarly, there are obvious scratches and deep grooves observed on the surface lubricated with the ML MoS2 (Fig. 9c). However, a relatively uniform and smooth worn surface was obtained when the oil with 2D MoS2 was used (Fig. 9d). In addition, only minor pits instead of scratched furrows are observed inside the wear track. These results indicate that the 2D MoS2 performs more excellent in improving the antiwear ability of the base oil as compared to the ML MoS2. Meanwhile, the peaks from Mo and S atoms in the EDS spectrum (Fig. 9g and h) indicate the formation of a MoS2-based tribofilm inside the wear track lubricated with MoS2 particles.
 |
| | Fig. 9 SEM and EDS analyses of the wear tracks lubricated by: (a and e) base oil; (b and f) oil mixed with oleylamine; (c and g) oil with ML MoS2; (d and h) oil with 2D MoS2. | |
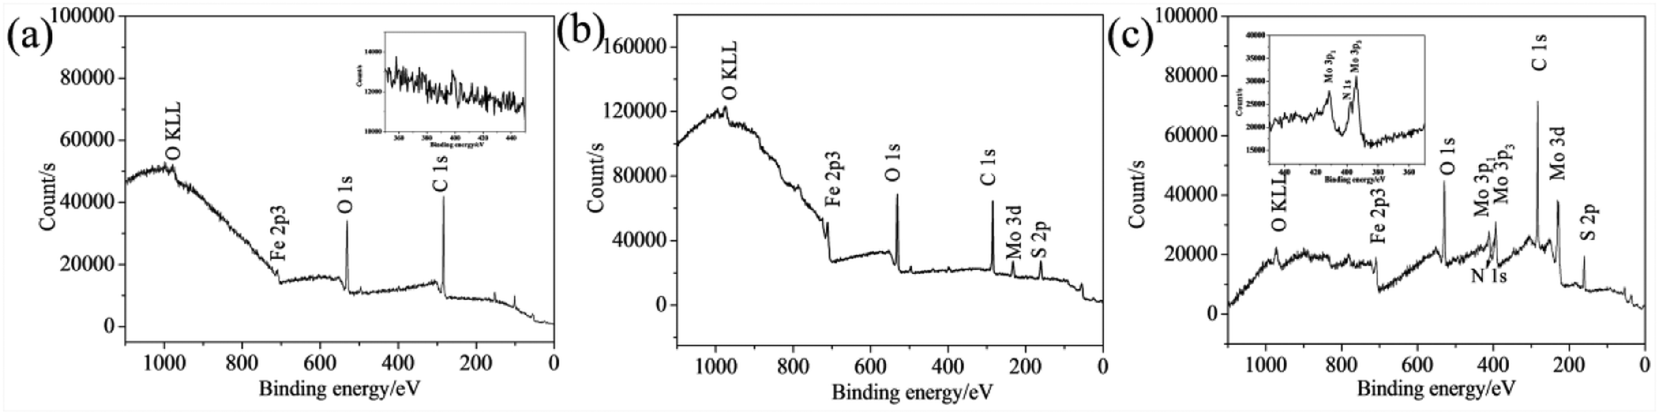
In order to confirm the formation of tribofilm inside the wear tracks and its composition, the XPS analyses were carried out. The elements of C, O, Fe are detected inside the wear track lubricated with oleylamine in the base oil (Fig. 10a). It can be seen that oleylamine cannot tightly adsorbed onto the rubbing surfaces, as no N element detected inside the wear track. For the wear track lubricated with the ML MoS2, the observed elements include C, O, Fe, and a trace amount of Mo and S (Fig. 10b). As to the wear track lubricated with the 2D MoS2, the elements including C, O, Fe, Mo, S as well as N are detected (Fig. 10c). The N element could from oleylamine molecules attached onto the surfaces of the 2D MoS2. The high-resolution spectra of Mo 3d and S 2p recorded from the wear track lubricated with the 2D MoS2 are shown in Fig. 11. The Mo 3d5/2 is composed of a main peak at 228.61 eV corresponding to the MoS2, a small peak at 229.60 eV corresponding to the Mo–O species, which suggests that the 2D MoS2 was transferred into contact surfaces and part of them was oxidized. As to the S 2p3/2 peak, a peak at 161.88 eV can be assigned to MoS2 and another peak at 161.11 eV can be attributed to the S–Fe species. The presence of the S–Fe species illustrates that the MoS2 adhered onto the rubbing surfaces through the Fe–S covalent bond. Meanwhile, the O 1s and Fe 2p3 peaks (Fig. S4†) suggests the presence of the oxide species (O–Fe and O–Mo) inside the tribofilm. The Mo 3d and S 2p XPS spectra recorded from the wear track lubricated with the ML MoS2 are shown in Fig. S5,† which are similar to those lubricated with the 2D MoS2.
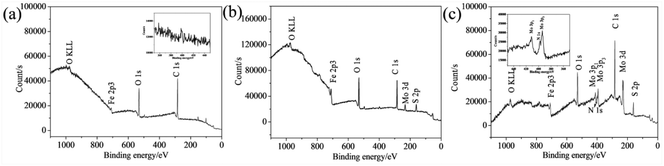 |
| | Fig. 10 XPS survey spectrum for the wear tracks lubricated by: (a) oil mixed with oleylamine; (b) oil with ML-MoS2; (c) oil with 2D MoS2. | |
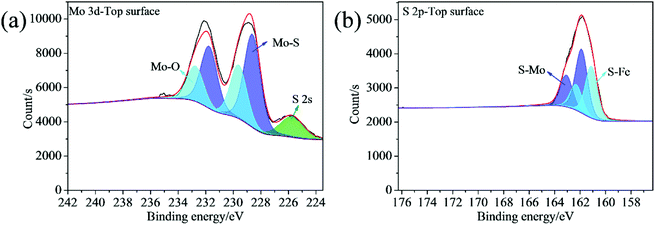 |
| | Fig. 11 XPS spectra of (a) Mo 3d and (b) S 2p for the wear track lubricated with the 2D MoS2. | |
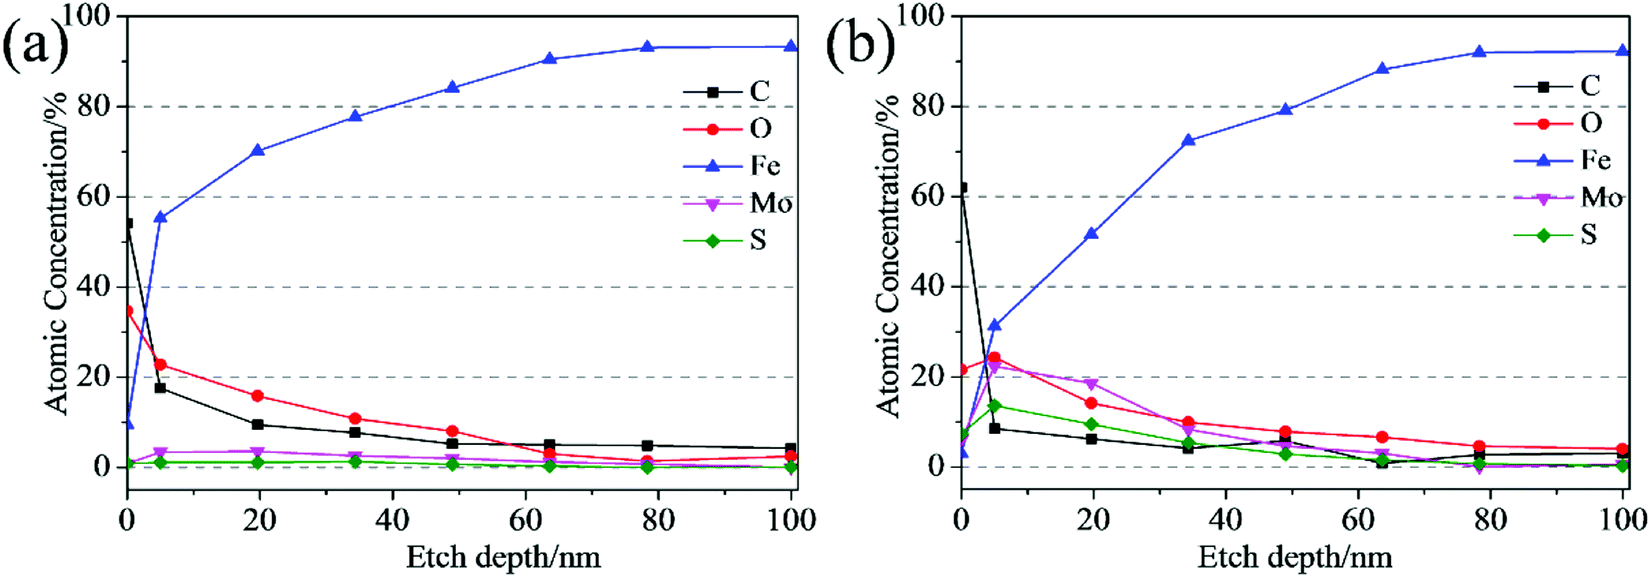
The XPS depth-profiling technique using argon ion sputtering was employed to analyze the thickness of the tribofilm. Fig. 12 shows the depth profiles of all elements detected inside the tribofilm. As Fig. 12 shown, the iron signal is very weak at the top surface of the tribofilm, and then increases with the etch depth increasing. Finally, the iron content remains stable, which means the tribofilm was sputtered out completely and the steel substrate was reached. For the wear track lubricated with the ML MoS2 (Fig. 12a), the concentrations of Mo and S elements on the top surface are quite low (0.8 at% and 0.9 at%, respectively), which implies that the MoS2 tribofilm did not completely covered the wear track. Meanwhile, it is observed that the concentrations of Mo and S elements inside the tribofilm formed from the oil with ML MoS2 are very low throughout the etch depth and decrease fast during the initial 19 nm. As to the tribofilm formed from the oil with 2D MoS2 (Fig. 12b), the Mo and S elements on the top surface of the wear track are in relatively high concentration (6.0 at% and 7.3 at%, respectively). Moreover, it is observed that there is a significant increase in the concentrations of Mo and S elements (22.3 at%, 13.6 at%, respectively) after 5 nm depth of etching. From Fig. 12b, it can be estimated that the thickness of the tribofilm formed from the oil with 2D MoS2 is about 78 nm. Meanwhile, the Mo element inside the tribofilm is found to exist in two forms: the MoS2 and the Mo–O species (Fig. S6a†). The S element inside the tribofilm is presented by the two chemical states of the MoS2 and the S–Fe species (Fig. S6b†). It can be seen that the tribofilm formed from the oil with 2D MoS2 appears much thicker with higher concentrations of Mo and S, comparable to that lubricated with the ML MoS2.
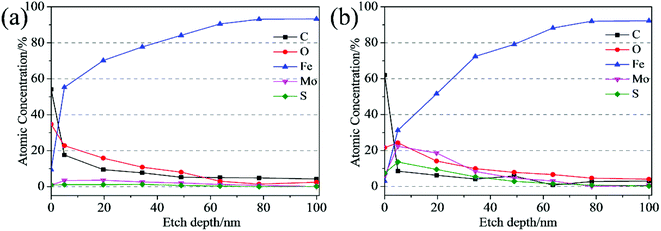 |
| | Fig. 12 XPS depth profile of the wear track lubricated by: (a) oil with ML MoS2; (b) oil with 2D MoS2. | |
4. Discussion
The minimum oil film thickness can be predicted via the Hamrock–Dowson equation:37| |
 | (1) |
| |
 | (2) |
| | |
G* = αE′, U* = η0U/(E′R′), W* = W/(E′R′2)
| (3) |
where hmin is the minimum oil film thickness, α is the pressure–viscosity of the lubricant (2.0 × 10⁻⁸ m2 N−1), E′ is the effective modulus of elasticity (208 GPa), U is the entrainment velocity (0.1 m s−1), η0 is the ambient viscosity of the lubricant (0.024 Pa s), R′ is the effective radius, k = 1.03.
It can be seen from Table 1, at the beginning of the test, the minimum oil film thickness in the contact area is 14.64, 13.92 and 13.23 nm, respectively, for the tested loads of 100, 200 and 400 N. The surface roughness of the ball and disk is 25 nm and 50 nm, respectively. It can be deduced that the sliding surfaces are running in the boundary lubrication region. With the process of the tests, wear occurred both on the ball and the disk, could result an increase in the contact area as compared to the initial contact area, which accordingly lead to the reduction of the contact pressure. According to the diameter of the wear scar on the ball, the average contact pressure and the corresponding minimum oil film thickness in the contact region have been calculated (see Table 1). It can be seen that the oil film thickness is less than or close to 50 nm under all tested loads. Meanwhile, the surface roughness of the disk increased to larger than 300 nm after tests, which is much larger than the calculated film thickness. Therefore, it can be deduced that the friction pairs are still in the boundary lubrication region at the end of tests. The small distance between the friction pair could restrict the entry of the MoS2 nanoparticles into the contact area in boundary lubrication region. In this case, the ability of MoS2 nanoparticles to enter and stay in the contact area is the key factor to improve the tribological property of the oils. From Fig. 8, it is observed that the oil with 2D MoS2 presented better lubrication performance than the oils with ML MoS2. This could be attributed the extremely thin structure of the 2D MoS2, which benefits their transfer into the contact area in the boundary lubrication region and promotes the formation of a MoS2-based tribofilm inside the wear track.
Table 1 The calculated oil film thickness under different lubricating conditions
| Lubricating conditions |
Oil with ML MoS2 |
Oil with 2D MoS2 |
| Load/N |
100 |
200 |
400 |
100 |
200 |
400 |
| Initial maximum Hertz contact/GPa |
2.32 |
2.92 |
3.67 |
2.32 |
2.92 |
3.67 |
| Oil film thickness (beginning)/nm |
14.64 |
13.92 |
13.23 |
14.64 |
13.92 |
13.23 |
| Wear scar diameter of upper balls/μm |
428 |
602 |
1026 |
388 |
501 |
603 |
| Average contact pressure/MPa |
695 |
703 |
484 |
846 |
1015 |
1401 |
| Oil film thickness/nm |
34.04 |
37.75 |
54.74 |
29.68 |
29.20 |
26.04 |
5. Conclusions
In summary, two-dimensional MoS2 nanosheets (2D MoS2) were obtained via a solvothermal method by using heptamolybdate tetrahydrate and thiourea as precursors in oleylamine. Because of its coating characteristics, oleylamine led to the formation of 2D MoS2 with single or few layers. Moreover, the surfaces of the 2D MoS2 were attached by oleylamine molecules, which ensured their perfect dispersing stability in oils. The friction reduction and wear resistance properties of the paraffin oil could be improved with the addition of multilayered or two-dimensional MoS2 nanosheets. However, the 2D MoS2 exhibited enhanced tribological property as compared to the multilayered MoS2 nanosheets, resulting in the reduction of friction coefficient and wear by 49.4% and 91.0%, respectively. The significantly better tribological property of the oil with 2D MoS2 was attributed to the formation of a thick MoS2-based tribofilm on the lubricated metal surfaces, as the extremely thin structure of the 2D MoS2 greatly benefited their transfer into the contact area. These results significantly contributed to the commercial utilization of 2D MoS2 as oil additives.
Conflicts of interest
We declare that we do not have any commercial or associative interest that represents a conflict of interest in connection with the work submitted.
Acknowledgements
The work was financially supported by National Natural Science Foundation of China (51335005, 51527901).
References
- K. S. Novoselov, A. K. Geim, S. V. Morozov, D. Jiang, Y. Zhang, S. V. Dubonos, I. V. Grigorieva and A. A. Firsov, Electric field effect in atomically thin carbon films, Science, 2004, 306, 666–669 CrossRef CAS PubMed.
- W. Choi, N. Choudhary, G. H. Han, J. Park, D. Akinwande and Y. H. Lee, Recent development of two-dimensional transition metal dichalcogenides and their applications, Mater. Today, 2017, 20, 116–130 CrossRef CAS.
- L. Ma, L. M. Xu, X. Y. Xu, X. P. Zhou and L. I. Zhang, Facile preparation of graphene-like and expanded molybdenum disulfide/graphene via a polyquaternium-assisted method and their electrochemical Na-storage performance, Colloids Surf., A, 2016, 504, 182–189 CrossRef CAS.
- J. Li, C. L. Hu, H. Wu, Z. X. Liu, S. Cheng, W. F. Zhang, H. B. Shu and H. X. Chang, Facile preparation of single MoS2 atomic crystals with highly tunable photoluminescence by morphology and atomic structure, Cryst. Growth Des., 2016, 16, 7094–7101 CAS.
- J. Benson, M. X. Li, S. B. Wang, P. Wang and P. Papakonstantinou, Electrocatalytic hydrogen evolution reaction on edges of a few Layer molybdenum disulfide nanodots, ACS Appl. Mater. Interfaces, 2015, 7, 14113–14122 CAS.
- G. B. De-Mello, L. Smith, S. J. Rowley-Neale, J. Gruber, S. J. Hutton and C. E. Banks, Surfactant-exfoliated 2D molybdenum disulphide (2D-MoS2): the role of surfactant upon the hydrogen evolution reaction, RSC Adv., 2017, 7, 36208–36213 RSC.
- Y. R. An, X. L. Fan, Z. F. Luo and W. M. Lau, Nanopolygons of monolayer MS2: best morphology and size for HER catalysis, Nano Lett., 2017, 17, 368–376 CrossRef CAS PubMed.
- O. Salehzadeh, N. H. Tran, X. Liu, I. Shih and Z. Mi, Exciton kinetics, quantum efficiency, and efficiency droop of monolayer MoS2 light-emitting devices, Nano Lett., 2014, 14, 4125–4130 CrossRef CAS PubMed.
- Q. H. Wang, K. Kalantar-Zadeh, A. Kis, J. N. Coleman and M. S. Strano, Electronics and optoelectronics of two-dimensional transition metal dichalcogenides, Nat. Nanotechnol., 2012, 7, 699–712 CrossRef CAS PubMed.
- X. Zhu, X. Liang, X. Fan and X. Su, Fabrication of flower-like MoS2/TiO2 hybrid as an anode material for lithium ion batteries, RSC Adv., 2017, 7, 38119–38124 RSC.
- A. Shokri and N. Salami, Gas sensor based on MoS2 monolayer, Sens. Actuators, B, 2016, 236, 378–385 CrossRef CAS.
- M. R. Yi and C. H. Zhang, The synthesis of MoS2 particles with different morphologies for tribological applications, Tribol. Int., 2017, 116, 285–294 CrossRef CAS.
- G. G. Tang, J. Zhang, C. C. Liu, D. Zhang, Y. Q. Wang, H. Tang and C. Li, Synthesis and tribological properties of flower-like MoS2 microspheres, Ceram. Int., 2014, 40, 11575–11580 CrossRef CAS.
- S. V. Prabhakar, C. Byon, C. V. Reddy, B. Venkatesh and J. Shim, Synthesis and structural characterization of MoS2 nanospheres and nanosheets using solvothermal method, J. Mater. Sci., 2015, 50, 5024–5038 CrossRef.
- R. Rosentsveig, A. Gorodnev, N. Feuerstein, H. Friedman, A. Zak, N. Fleischer, J. Tannous, F. Dassenoy and R. Tenne, Fullerene-like MoS2 nanoparticles and their tribological behavior, Tribol. Lett., 2009, 36, 175–182 CrossRef CAS.
- J. C. Spear, B. W. Ewers and J. D. Batteas, 2D-nanomaterials for controlling friction and wear at interfaces, Nano Today, 2015, 10, 301–314 CrossRef CAS.
- M. Kalin, J. Kogovsek and M. Remskar, Mechanisms and improvements in the friction and wear behavior using MoS2 nanotubes as potential oil additives, Wear, 2012, 280–281, 36–45 CrossRef CAS.
- Z. Chen, X. W. Liu, Y. H. Liu, S. Gunsel and J. B. Luo, Ultrathin MoS2 nanosheets with superior extreme pressure property as boundary lubricants, Sci. Rep., 2015, 5, 12869 CrossRef CAS PubMed.
- E. Benavente, M. A. Santa Ana, F. Mendizabal and G. Gonzalez, Intercalation chemistry of molybdenum disulfide, Coord. Chem. Rev., 2002, 224, 87–109 CrossRef CAS.
- Y. Lee, X. Zhang, W. Zhang, M. Chang, C. Lin, K. Chang, Y. Yu, J. T. Wang, C. Chang, L. Li and T. Lin, Synthesis of large-area MoS2 atomic layers with chemical vapor deposition, Adv. Mater., 2012, 24, 2320–2325 CrossRef CAS PubMed.
- J. F. Xie, H. Zhang, S. Li, R. X. Wang, X. Sun, M. Zhou, J. F. Zhou, X. W. Lou and Y. Xie, Defect-Rich MoS2 ultrathin nanosheets with additional active edge sites for enhanced electrocatalytic hydrogen evolution, Adv. Mater., 2013, 25, 5807–5813 CrossRef CAS PubMed.
- L. Dong, S. Lin, L. Yang, J. J. Zhang, C. Yang, D. Yang and H. B. Lu, Spontaneous exfoliation and tailoring of MoS2 in mixed solvents, Chem. Commun., 2014, 50, 15936–15939 RSC.
- G. S. Bang, K. W. Nam, J. Y. Kim, J. Shin, J. W. Choi and S. Choi, Effective liquid-phase exfoliation and sodium ion battery application of MoS2 nanosheets, ACS Appl. Mater. Interfaces, 2014, 6, 7084–7089 CAS.
- A. Schlierf, H. F. Yang, E. Gebremedhn, E. Treossi, L. Ortolani, L. P. Chen, A. Minoia, V. Morandi, P. Samor, C. Casiraghi, D. Beljonne and V. Palermo, Nanoscale insight into the exfoliation mechanism of graphene with organic dyes: effect of charge, dipole and molecular structure, Nanoscale, 2013, 5, 205 RSC.
- K. Manna, C. Y. Hsieh, S. C. Lo, Y. S. Li, H. N. Huang and W. H. Chiang, Graphene and graphene-analogue nanosheets produced by efficient water-assisted liquid exfoliation of layered materials, Carbon, 2016, 105, 51–555 CrossRef.
- Y. J. Zhan, Z. Liu, S. Najmaei, P. M. Ajayan and J. Lou, Large-area vapor-phase growth and characterization of MoS2 atomic layers on a SiO2 substrate, Small, 2012, 8, 966–971 CrossRef CAS PubMed.
- X. Zhang, Z. C. Lai, C. L. Tan and H. Zhang, Solution-processed two-dimensional MoS2 nanosheets: preparation, hybridization, and applications, Angew. Chem., Int. Ed., 2016, 128, 8960–8984 CrossRef.
- C. Altavilla, M. Sarno and P. Ciambelli, A novel wet chemistry approach for the synthesis of hybrid 2D free-floating single or multilayer nanosheets of MS2@oleylamine (M = Mo, W), Chem. Mater., 2011, 23, 3879–3885 CrossRef CAS.
- X. H. Zhang, H. Tang, M. Q. Xue and C. S. Li, Facile synthesis and characterization of ultrathin MoS2 nanosheets, Mater. Lett., 2014, 130, 83–86 CrossRef CAS.
- N. Savjani, E. A. Lewis, M. A. Bissett, J. R. Brent, R. A. W. Dryfe, S. J. Haigh and P. O'Brien, Synthesis of lateral size-controlled monolayer 1H-MoS2@oleylamine as supercapacitor electrodes, Chem. Mater., 2016, 28, 657–664 CrossRef CAS.
- X. H. Zhang, H. X. Xu, J. T. Wang, X. Ye, W. N. Lei, M. Q. Xue, H. Tang and C. S. Li, Synthesis of ultrathin WS2 nanosheets and their tribological properties as lubricant additives, Nanoscale Res. Lett., 2016, 11, 442 CrossRef PubMed.
- H. Li, Q. Zhang, C. Yap, B. K. Tay, T. Edwin, A. Olivier and D. Baillargeat, From bulk to monolayer MoS2: Evolution of Raman scattering, Adv. Funct. Mater., 2012, 22, 1385–1390 CrossRef CAS.
- W. Feng, L. Chen, M. Qin, X. J. Zhou, Q. Q. Zhang, Y. K. Miao, K. X. Qiu, Y. Z. Zhang and C. L. He, Flower-like PEGylated MoS2 nanoflakes for near-infrared photothermal cancer therapy, Sci. Rep., 2015, 5, 17422 CrossRef CAS PubMed.
- S. Mourdikoudis and L. M. Liz-Marzan, Oleylamine in nanoparticle synthesis, Chem. Mater., 2013, 25, 1465–1476 CrossRef CAS.
- H. Y. Wang, B. Y. Wang, D. Wang, L. Lu, J. G. Wang and Q. C. Jiang, Facile synthesis of hierarchical worm-like MoS2 structures assembled with nanosheets as anode for lithium ion batteries, RSC Adv., 2015, 5, 58084–58090 RSC.
- C. B. Ma, X. Y. Qi, B. Chen, S. Y. Bao, Z. Y. Yin, X. J. Wu, Z. M. Luo, J. Wei, H. L. Zhang and H. Zhang, MoS2 nanoflower-decorated reduced graphene oxide paper for high-performance hydrogen evolution reaction, Nanoscale, 2014, 6, 5624–5629 RSC.
- S. Z. Wen and P. Huang, Principles of Tribology, Tsinghua University Press, Beijing, 4th edn, 2012 Search PubMed.
Footnote |
| † Electronic supplementary information (ESI) available. See DOI: 10.1039/c7ra12897e |
|
| This journal is © The Royal Society of Chemistry 2018 |
Click here to see how this site uses Cookies. View our privacy policy here. 
 Open Access Article
 This Open Access Article is licensed under a
  *
*