DOI:
10.1039/C7RA12827D
(Paper)
RSC Adv., 2018,
8, 3099-3107
Critical phenomena and estimation of the spontaneous magnetization from a mean field analysis of the magnetic entropy change in La0.7Ca0.1Pb0.2Mn0.95Al0.025Sn0.025O3
Received
27th November 2017
, Accepted 8th January 2018
First published on 15th January 2018
Abstract
In the present work, we have studied the universal critical behavior in the perovskite-manganite compound La0.7Ca0.1Pb0.2Mn0.95Al0.025Sn0.025O3. Experimental results revealed that all samples exhibit a second-order magnetic phase transition. To study the critical behavior of the paramagnetic–ferromagnetic transition, various techniques such as modified Arrott plots, the Kouvel–Fisher method and critical isotherm analysis were used to determine the values of the Curie temperature TC, as well as the critical exponents β (corresponding to the spontaneous magnetization), γ (corresponding to the initial susceptibility) and δ (corresponding to the critical magnetization isotherm). The critical exponent values for our sample are consistent with the prediction of the mean field model (β = 0.46, γ = 1.0, and δ = 2.94 at an average TC = 302.12 K), indicating that the magnetic interactions are long-range. The reliability of the critical exponent values was confirmed by the Widom scaling relation (WSR) and the universal scaling hypothesis. Moreover, to estimate the spontaneous magnetization of La0.7Ca0.1Pb0.2Mn0.95Al0.025Sn0.025O3 perovskite, we used the magnetic entropy change (ΔSM), obtained from isothermal magnetization. The results obtained through this approach are compared to those obtained from classical analysis using Arrott curves. An excellent agreement is found between this approach and the one obtained from the extrapolation of the Arrott curves.
1. Introduction
Over the past few years, magnetic materials have had potential applications in information storage and magnetic sensors, these materials have been also found to exhibit a large magnetocaloric effect (MCE), revealing that they can be considered as promising magnetic refrigerants.1,2 The MCE, which is an intrinsic property of magnetic materials, is defined as the thermal response (heating or cooling) of magnetic solids during the application or removal of an external magnetic field. Nowadays, the majority of research in this area is to develop suitable materials that are cost effective and exhibit large MCEs (large isothermal magnetic entropy change ΔSM or large adiabatic temperature change ΔTad) over a wide temperature range. These materials exhibit a rich variety of physical properties. The most accepted interpretations for the cause of these properties are the double exchange model3 and the Jahn–Teller effect.4,5 Both of these mechanisms are used to identify the magnetic phase transition (FM–PM). However, the perovskite manganites with mixed valence are intrinsically inhomogenous, both above and below the Curie temperature. In this context, a detailed investigation of the critical exponents in this region is needed to give an idea about the order of the phase transition and the common universality class. For this object, it is required to investigate in details the critical exponents at the region of the PM–FM transition. Historically, the critical behavior in the DE model was first described by long-range mean-field theory. Sequentially, depending on the computational technology for the colossal magnetoresistance (CMR) manganites, many works suggested that the critical behavior should be attributed to short-range Heisenberg model6,7 with only a nearest neighbor exchange coupling assuming a short-range interaction between localized spins. Based on the study of dc magnetization, Ghosh et al.8 reported that the critical exponent β is equal to 0.37 for the ferromagnet manganite La0.7Sr0.3MnO3. Nevertheless, a relative high value of β = 0.5 obtained in the polycrystalline La0.8Sr0.2MnO3 is in good agreement with that in mean-field model.9 Other critical behavior studies in manganites10–12 have been carried out on the vicinity of the magnetic phase transition by using a variety of techniques have yielded a wide range of values for the critical parameters β of the magnetization. The values range, from about 0.3 to 0.5, includes the mean-field (β = 0.5), the 3D isotropic nearest-neighbor Heisenberg (β = 0.365) and the 3D-Ising (β = 0.325) estimates and those that cannot be classified into any universality class ever known.13
In this paper, we propose to present a detailed analysis of the critical phenomena in the perovskite. We demonstrate that the values of critical exponents β, γ, and δ of our sample are close to the theoretical prediction of the mean-field model indicating the existence of a long-range ferromagnetic interaction. Moreover, we utilize the isothermal magnetic entropy change (−ΔSM) obtained from isothermal magnetization measurements, in mean-field model, to estimate the spontaneous magnetization for our system and then compared to results obtained from Arrott curves.14
2. Experimental details
La0.7Ca0.1Pb0.2Mn0.95Al0.025Sn0.025O3 polycrystalline has been synthesized by sol–gel method that details was described in our previous work.15 The variations of the magnetization as a function of magnetic field at different temperatures have been measured between 0 and 5 T and in a temperature range around the TC using BS1 and BS2 magnetometers developed in Louis Neel Laboratory at Grenoble. To extract the critical exponents of the sample accurately, the magnetic isotherms were measured in the range of 0–5 T and with a temperature interval of 3 K in the vicinity of its Curie temperatures (TC).
3. Results and discussion
3.1. Magnetic and magnetocaloric effect properties
Fig. 1 displays the zero field cooled (ZFC) and field-cooled (FC) magnetization evolution versus temperature taken at an applied field of μ0H = 0.05 T for La0.7Ca0.1Pb0.2Mn0.95Al0.025Sn0.025O3 compound. It is observed from Fig. 1 that the M(T) curve exhibits a single magnetic transition from paramagnetic (PM) to ferromagnetic (FM) behavior as the temperature decreases. The transition temperature TC for our sample (inset Fig. 1), determined from the critical point in the derivative dM/dT curves, is found to be 300 K.15 This deduced value is equal to room temperature, which is quite suitable for magnetic refrigeration technology. Furthermore, we have also notice from M–T curves that the ZFC and FC curves coincide above TC as expected in the paramagnetic state, while they slightly split below TC suggesting the existence of a multi-domain magnetic state.16,17
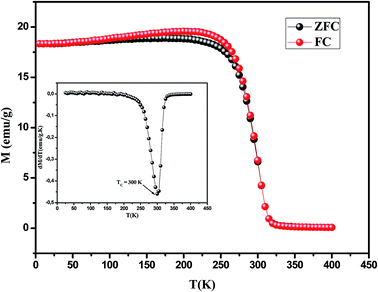 |
| | Fig. 1 ZFC and FC magnetization as a function of temperature and inset shows the corresponding dM/dT versus T. | |
Following the magnetic properties, we measured magnetic-field dependences of the initial magnetization, M(H), for La0.7Ca0.1Pb0.2Mn0.95Al0.025Sn0.025O3 sample around their FM–PM phase transition. Fig. 2 represents the magnetic field dependence of magnetization at various temperatures between 240 and 342 K under magnetic field μ0H ranging between 1 and 5 T. Characteristic M(H) curves of manganites usually exhibit a very high increase in M at low fields and then a gradual saturation at high fields, as expected for a ferromagnetic material. The saturated magnetization (MS) can be estimated from an extrapolation of the high field M–μ0H curve to μ0H = 0, and the obtained MS is 44 emu g−1 at T = 240 K. According to the Maxwell relations based on the thermodynamical theory, the magnetic entropy change (|ΔSM|), an important thermodynamic parameter characteristic of the disorder of magnetic moments can be evaluated from the temperature and field dependent magnetization curves, using a numerical approximation as follows:
| |
 | (1) |
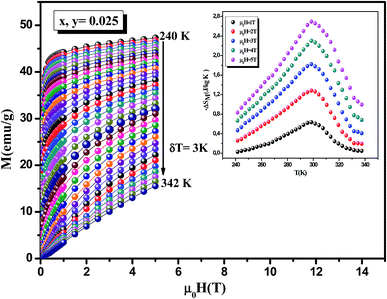 |
| | Fig. 2 Magnetic field dependence of magnetization at several temperatures for La0.7Ca0.1Pb0.2Mn0.95Al0.025Sn0.025O3 sample, the inset: temperature dependence of the magnetic entropy change (−ΔSM) at different applied magnetic field change intervals. | |
The magnetic entropy change between 0 and μ0H magnetic applied field, can be basically obtained by:
| |
 | (2) |
The obtained magnetic entropy change has been plotted as a function of temperature in the inset of Fig. 2. One can notice that the maximum in magnetic entropy change (|ΔSmaxM|) exhibits a peak around TC and increases with increasing of applied magnetic field. The maximum value of ΔSM observed for the sample under an applied magnetic field of 5 T was found to be about 2.7 J kg−1 K−1, which is comparable to some typical manganites (Table 1). Besides magnetic entropy change, there is another important parameter that measures the cooling efficiency of the refrigerant is the relative cooling power (RCP), which can be evaluated by considering the magnitude of |ΔSmaxM| and its full width at half maximum (δTFWHM) and it corresponds to the amount of heat transferred between the cold and hot sides in an ideal refrigeration cycle. The obtained value of RCP in an applied field of 5 T is given in Table 1. For comparison purposes, we gathered in Table 1 the values of the (−ΔSmaxM) and RCP for our sample under a magnetic applied field of 5 T and several others results reported in the literature.18–24 As we can see through this assessment, our material can be a leader system in the magnetic refrigeration offering the opportunity to use it in a broad temperature range.
Table 1 Maximum entropy change |ΔSmaxM| and relative cooling power (RCP), for La0.7Ca0.1Pb0.2Mn0.95Al0.025Sn0.025O3, occurring at the Curie temperature (TC) and under magnetic field variations, ΔH = 1 T, 3 T or ΔH = 5 T, compared to several materials considered for magnetic refrigeration
| Sample |
TC (K) |
ΔH (T) |
−ΔSmaxM (J kg−1 K−1) |
RCP(Jkg−1) |
References |
| Gd |
293 |
5 |
9.5 |
410 |
18 |
| Gd5Si2Ge2 |
275 |
5 |
18.5 |
535 |
19 |
| La0.67Ba0.33MnO3 |
292 |
5 |
1.48 |
161 |
20 |
| La0.7Sr0.3Mn0.9Al0.1O3 |
310 |
5 |
2.6 |
109 |
21 |
| La0.67Ca0.33MnO3 |
252 |
5 |
2.06 |
175 |
19 |
| La2/3(Ca,Pb)1/3MnO3 |
290 |
7 |
7.5 |
375 |
22 |
| La0.65Ca0.35Ti0.4Mn0.6O3 |
42 |
3 |
0.6 |
55 |
23 |
| La0.7Pb0.3MnO3 |
358 |
1.35 |
1.53 |
53 |
24 |
| La0.7Ca0.1Pb0.2Mn0.95Al0.025Sn0.025O3 |
300 |
5 |
2.7 |
137 |
This work |
3.2. Critical behavior
Generally, to further understand the nature of the ferromagnetic–paramagnetic (FM–PM) phase transition (first or second order), the Arrott plots M1/β vs. (H/M)1/γ following mean-field theory β = 0.5 and γ = 1 are presented in Fig. 3. Based on the criterion proposed by Banerjee,25 the magnetic transition is of second order if all the H/M vs. M2 curves have a positive slope while the negative slope of M2 vs. H/M reflects that the magnetic system exhibits a first order transition. In agreement with Mira et al.,26 it can be observed from these curves that the H/M vs. M2 curves of our sample exhibit a positive slope and we analyze our data assuming the PM–FM transition to be of second order in this compound according to Banerjee's criteria. According to the mean field model, such curves should reveal a linear behavior in the high field region at different temperatures and the line at T = TC should just pass through the origin.27 It is evident in Fig. 3 that the line of M2 vs. H/M crosses the origin at TC = 300 K, suggesting that the mean-field theory can describe the critical behavior of this sample.
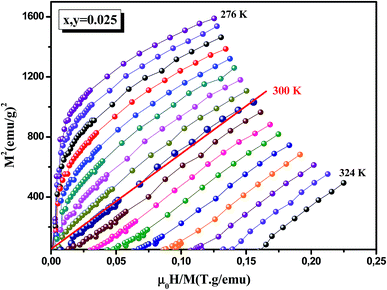 |
| | Fig. 3 Arrott plots (M2 versus μ0H/M) of La0.7Ca0.1Pb0.2Mn0.95Al0.025Sn0.025O3 compound at different temperatures around TC. | |
A deeper insight into the magnetic phase transition may be obtained by analyzing the critical phenomena. Generally, at high field region, the effect of charge, lattice, and orbital degrees of freedom are suppressed in a ferromagnet and the order parameter can be identified with the macroscopic magnetization. In the present case and in order to seek adequate model leading to a set of reasonably good parallel straight lines and the correct β and γ exponents, the data was analyzed using a modified Arrott-plot expression (M1/β vs. (H/M)1/γ), based on the so-called Arrott–Noakes equation of state:28
| | |
(H/M)1/γ = a(T − TC)/T + bM1/β
| (3) |
where
a and
b are considered to be constants.
The MAP isotherms of M1/β versus (H/M)1/γ are plotted for La0.7Ca0.1Pb0.2Mn0.95Al0.025Sn0.025O3 at different temperatures by using four models of critical exponents. Fig. 4a demonstrates the tricritical mean-field model (β = 0.25, γ = 1), Fig. 4b illustrates the 3D-Heisenberg model (β = 0.365, γ = 1.336) and Fig. 4c shows the 3D-Ising model (β = 0.325, γ = 1.24).27–30
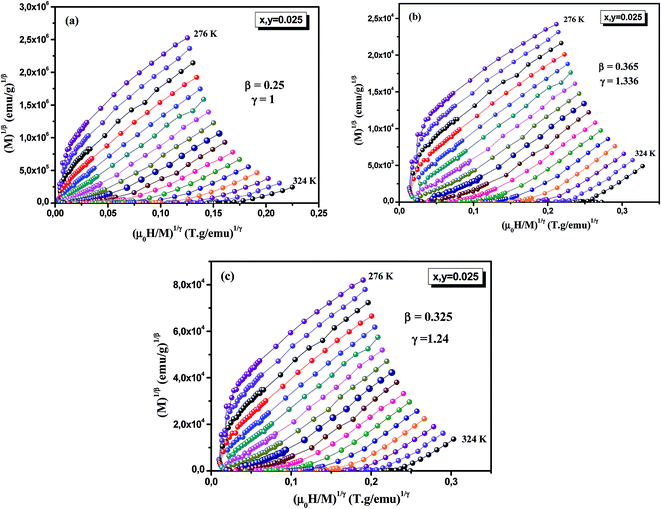 |
| | Fig. 4 Modified Arrott plots: isotherms of M1/β vs. μ0H/M1/γ with (a) tricritical mean-field model, (b) 3D-Heisenberg model, (c) 3D-Ising model. | |
According to the scaling hypothesis, the second-order magnetic phase transition is characterized by a set of critical exponents β (associated with the spontaneous magnetization M (H = 0) below TC), γ (related to the initial susceptibility χ0−1 above TC) and δ (related to the critical magnetization at TC).31,32 They are defined as follows:
| | |
MS(T) = M0(−ε)β, ε < 0
| (4) |
| | |
χ0−1(T) = (h0/M0)εγ, ε > 0
| (5) |
where
ε is the reduced temperature
ε =
T −
TC/
TC, and
M0,
h0/
M0, and
D are the critical amplitudes.
Following a standard procedure, we could calculate the values of the spontaneous magnetization MS(T) as well as the inverse susceptibility χ0−1(T) from a linear extrapolation in the high fields to the intercepts with the axes M1/β and (H/M)1/γ, respectively. The MS(T) and χ0−1(T) are displayed in Fig. 5. By fitting the MS(T) and χ0−1(T) data to eqn (4) and (5), respectively, new values of β, γ and TC will be achieved and listed in Table 2.
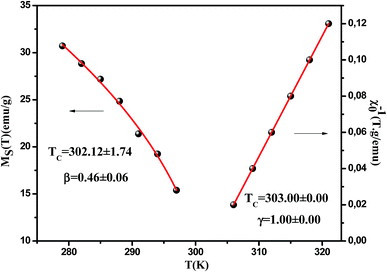 |
| | Fig. 5 The spontaneous magnetization MS(T) and the inverse initial susceptibility χ0−1(T) along with the fitting curves. | |
Table 2 Comparison of critical exponents of La0.7Ca0.1Pb0.2Mn0.95Al0.025Sn0.025O3 with other reports and various theoretical models
| Samples |
Techniques |
TC (K) |
β |
γ |
δ |
Ref. |
| La0.7Ca0.1Pb0.2Mn0.85Al0.075Sn0.075O3 |
MAP |
302.12 ± 1.74 |
0.46 ± 0.06 |
1.00 ± 0.00 |
2.94 |
This work |
| KF |
301.86 ± 0.0 |
0.44 ± 0.04 |
1.0 ± 0.0 |
| Mean field model |
Theory |
— |
0.5 |
1 |
3 |
43 |
| 3D-Ising mode |
Theory |
— |
0.325 |
1.24 |
4.82 |
43 |
| Tricritical mean field model |
Theory |
— |
0.25 |
1 |
5 |
44 |
| 3D-Heseinberg model |
Theory |
— |
0.365 |
1.336 |
4.8 |
45 |
| Pr0.67Ba0.33Mn0.95Fe0.05O3 |
|
128 |
0.5 ± 0.026 |
1.007 ± 0.002 |
2.920 |
37 |
| La0.7Ca0.2Sr0.1MnO3 |
|
289 |
0.26 |
1.06 |
5.1 |
38 |
| La0.67Pb0.33MnO3 |
|
360.41 |
0.367 |
1.22 |
4.29 |
35 |
| LaMn0.9Ti0.1O3 |
|
145.3 ± 0.1 |
0.375 ± 0.00 |
1.25 ± 0.02 |
4.11 |
39 |
| Nd0.7Pb0.3MnO3 |
|
148 |
0.361 ± 0.001 |
1.325 ± 0.001 |
4.62 |
40 |
| La0.7Sr0.3Mn0.98Ni0.02O3 |
|
352.6 |
0.400 ± 0.017 |
1.082 ± 0.032 |
3.79 |
41 |
| La0.7Sr0.3MnO3 |
|
360 |
0.45 ± 0.02 |
1.08 ± 0.04 |
3.04 |
42 |
In addition, for comparison with the critical exponents previously calculated, these exponents can also be determined more accurately according to the Kouvel–Fisher (KF) method. This method is an alternative analytical expression of the power law defined as:33
| |
 | (7) |
| |
 | (8) |
According to this later equation, the plots of MS(T)(dMS(T)/dT)−1 vs. T and χ0−1(T)(dχ0−1(T)/dT)−1 vs. T (Fig. 6) yield straight lines with slopes 1/β and 1/γ, respectively and the intercepts on T axes are equal to Curie temperature (TC). From the fitted straight line in KF plots, we have obtained the critical exponents which are in agreement with those deduced from the previous calculations in allowable error. Besides, the final parameter delta ‘δ’ can be determined directly from the critical isotherm M(TC,μ0H). Fig. 7 shows the magnetic field dependence of magnetization at T = TC for our sample and in the inset we presented the same plot in log–log scale. According to eqn (6), log(M) vs. log(H) plot would give a straight line with slope 1/δ, δ is yielded as 2.94.
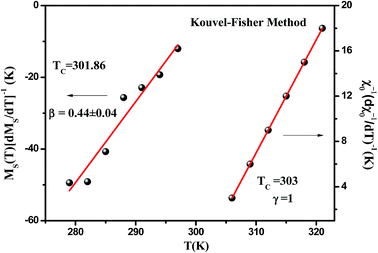 |
| | Fig. 6 Kouvel–Fisher plots for La0.7Ca0.1Pb0.2Mn0.95Al0.025Sn0.025O3 manganite. The solid lines are the linear fits of the symbols. | |
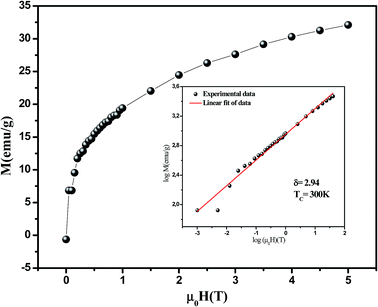 |
| | Fig. 7 Critical isotherms of M vs. μ0H for La0.7Ca0.1Pb0.2Mn0.95Al0.025Sn0.025O3. The inset shows the ln–ln scale for M vs. μ0H. | |
Another way to estimate the critical component δ, from β and γ, is possible by using the Widom scaling relation shown in eqn (9):31,34
| |
 | (9) |
Using this relation and the obtained values of β and γ from the mean-field method, we obtain δ = 3.2. One can see that the parameter δ obtained from the scaling relation is relatively close to the estimated δ = 2.94 value from the critical isotherms at TC = 300 K. As consequence, Widom scaling relation is a good tool for checking the reasonability of the critical exponents obtained from the experimental data. The Widom relationship has been tested by plotting M(TC) versus (μ0H)β/(β+γ) and checking the linearity of the curve as shown in Fig. 8.
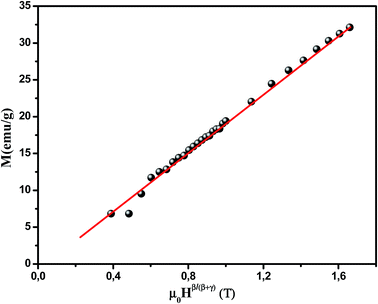 |
| | Fig. 8 The linearity of the M(T = TC) versus μ0Hβ/(β+γ) curves validates the value of δ calculated using the Widom relationship with the experimental data. | |
The reliability of the obtained values could be tested according to the prediction of the scaling hypothesis, which suggests that in the critical region the isothermal magnetization M is a function of ε and μ0H:35,36
| | |
M(μ0H,ε) = εβf±(μ0H/εβ+γ)
| (10) |
where
f+ for
T >
TC and
f− for
T <
TC, are regular analytical functions.
Eqn (10) implies that
M/
εβ vs. H/
εβ+γ falls on two universal curves: one for temperatures
T >
TC (
ε > 0) and the other for
T <
TC (
ε < 0). Using the values of
β and
γ obtained by the KF method, the scaled data are plotted in
Fig. 9 and the inset shows the same data in a logarithmic scale. The experimental data reveal that all points fall on two curves, one for
T <
TC and the other for
T >
TC. This proves the validity of these critical parameters and
TC temperature and the good accordance with the scaling hypothesis.
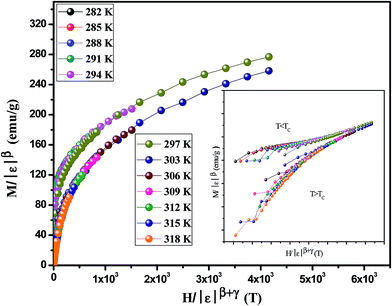 |
| | Fig. 9 Scaling plots indicating two universal curves below and above TC. Inset shows the same plots on a log–log scale. | |
To put our obtained results in the context of previous works, we have listed the critical exponents of La0.7Ca0.1Pb0.2Mn0.95Al0.025Sn0.025O3, those of some manganites available in the literature35,37–42 and the theoretical values based on the standard models43–45 in Table 2. As mentioned above, it can be clearly seen that these exponents are quite close to those expected for the mean field theory (β = 0.5, γ = 1, and δ = 3).9 This means that there exists long-range FM order in the La0.7Ca0.1Pb0.2Mn0.95Al0.025Sn0.025O3. However, all the β values obtained are smaller than 0.5, indicating the existence of magnetic inhomogeneities and/or AFM phase on the surface layers of our sample.
In order to manifest the influence of critical exponents on MCE, the field dependence of the entropy change was also analyzed. According to Oesterreicher et al., for a material exhibiting a second order phase transition, the field dependence of the peak magnetic entropy change ΔSpkM can be expressed as:46
where the exponent
n is a local exponent related to magnetic order and depends on temperature and magnetic field. It can be locally calculated as follows:
Furthermore, at T = TC, the exponent n becomes field independent and is given by:47
| |
 | (12) |
where
β,
γ and
δ are the critical exponents. Through the Widom relation (
δ = 1 +
γ/
β),
eqn (12) becomes:
| |
 | (13) |
Using the order parameters β, γ and δ at T = 300 K, obtained from the KF method, the value of n calculated from the above relation is found to be 0.61. This value is in good agreement with the predicted value of 2/3 in the mean field approach.48 In order to check the validity of n value, the experimental data of field dependence of ΔSM at transition temperature for the La0.7Ca0.1Pb0.2Mn0.95Al0.025Sn0.025O3 sample is plotted in Fig. 10. The fitting of full square points (ΔSmaxM), according to eqn (11), gives n(TC) = 0.7, which is higher than those calculated from eqn (13). The deviation from the mean field behavior is due to the presence of local inhomogeneities around the Curie temperature.
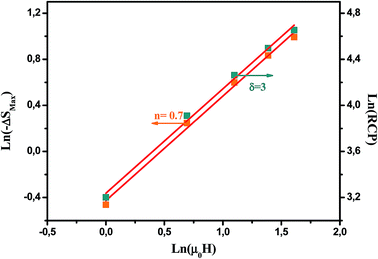 |
| | Fig. 10 Field dependence of the −ΔSmaxM and the RCP calculated from the magnetic data, with the calculated n and δ for both slopes. | |
On the other hand, the field dependence of the relative cooling power (RCP) for La0.7Ca0.1Pb0.2Mn0.95Al0.025Sn0.025O3 was also analyzed and shown in Fig. 10. The RCP, defined as the product of the peak entropy change times the full width at half maximum, should scale with field as a power law, with an exponent 1 + 1/δ. The field dependence of the RCP is analyzed using the following relation:
where
δ is the critical exponent of the magnetic transition. The value
δ calculated from the slope is 3, which is in agreement with those obtained using the critical isotherms analysis (CIA), modified Arrott plots (MAP) and Kouvel–Fisher method (KF). This confirms the good correlation between critical behavior and magnetocaloric effect.
Franco and co-workers used the scaled equation of state31,49 and the critical exponents, which is written as  , to scaling ΔS in the critical region (around TC). By using the scaled magnetic equation of state and eqn (1), Franco et al. were capable of showing that:50
| |
 | (15) |
where
α and
Δ are the usual critical exponents. We calculated
Δ and
α using the relations
51 Δ =
β +
γ and
α + 2
β +
γ = 2. Thus, according to

(
ref. 15) and using the appropriate values for the critical exponents and the Curie temperature, Franco
et al. plotted their experimental data as

and found that all the data for all temperatures and fields collapse on a single curve, which proves the validity of
eqn (18). Using the values of
β,
γ, and
TC obtained from the modified Arrott plots method, the scaled data are plotted in
Fig. 11. All data for our sample collapse on a single master curve for all measured fields and temperatures. The excellent overlap of the experimental data points clearly indicates that the obtained values of
β,
γ, and
TC for this compound is in agreement with the scaling hypothesis near magnetic transition.
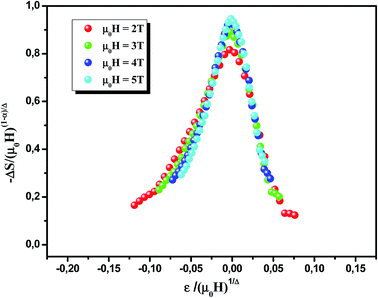 |
| | Fig. 11 Scaled magnetic entropy change vs. scaled temperature using critical exponents. | |
In addition, in homogeneous magnets the university class of the magnetic phase transition deduced from the normalization group analysis depends strongly on the range of the exchange interaction as it is described by this equation:
| |
 | (16) |
where
d is the space dimensionality,
σ is the range of interaction and
r determines the range of exchange interaction.
52 For a three-dimensional material (
d = 3), the relationship is
j(
r) = 1/
r3+σ with 3/2 ≤
σ ≤ 2. Generally, the MF-theory (
β = 0.5,
γ = 1.0 and
δ = 3.0) exponents are valid for
σ < 1/2, which indicates
j(
r) decreases with “long-range” distance slower than
r−4.5, while the Heisenberg ones are for
σ > 2. In the intermediate range, if 1/2 <
σ < 2, the exponents belong to other universality classes (such as the TMF theory and 3D-Ising model). In the case of our samples, the values of the critical exponents are in agreement with the mean-field model. Consequently (
d +
σ) will be smaller than 4.5, and the exchange interaction
j(
r) drops slower than
r−4.5 for our sample.
Moreover, the influence of disorder on the critical behavior of magnetic systems whose pure version undergoes a second order phase transition is predicted by the criterion of Harris.53 In this context, Harris asserts that if the critical exponent αpure of the pure system is positive, the disorder changes the critical exponents. While, if αpure is negative, the disorder is irrelevant. The αpure exponent for the pure system is calculated using the Rushbrooke scaling relation given by:
Based on this relation, the exponent αpure is found to be positive which implies that the disorder is relevant.
In the following section, we will use the obtained magnetic entropy change to study the spontaneous magnetization (M) in our material. A general result issued from a mean-field theory reveals the dependence of the magnetic entropy on the relative magnetization can be described as:54–57
| |
 | (17) |
where
σ =
M/
gμβJN,
M is the magnetization,
N is the number of spins,
J is the spin value,
kB and
BJ are the Boltzmann constant and the Brillouin function respectively.
From a power expansion of eqn (17), ΔSM is proportional to M2 and, from the mean-field model, for small M values:48,56
| |
 | (18) |
However, in the ferromagnetic state (below TC) the sample indicates a spontaneous magnetization and the σ = 0 state is never attained. Explicitly, and considering only the first term of the expansion of eqn (18), the magnetic entropy change may be written as:58
| |
 | (19) |
The mathematical analysis of this equation shows that the isotherms of the variation of the magnetic entropy (−ΔS) with the square of the magnetization (M2) in the ferromagnetic region (FM) have a linear variation. The curves constructed in Fig. 12 in the temperature range between 279 K and 297 K confirms clearly the former suggestion with an approximately constant slope throughout the FM region. Moreover, which results in a shift of the isothermal ΔSM vs. M2 plots in the ferromagnetic region, with an horizontal drift from the origin corresponding to the value of Mspont2(T), whereas for T > TC the ΔSM vs. M2 plots start at a null M value. The spontaneous magnetization (M(T)) is then estimated, and compared to the results obtained from the Arrott curves, as shown in the inset of Fig. 12.
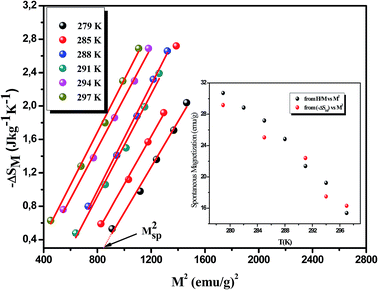 |
| | Fig. 12 Isothermal −ΔSM vs. M2 curves (the solid lines are linear fits to the data). The inset: spontaneous magnetization of La0.7Ca0.1Pb0.2Mn0.95Al0.025Sn0.025O3 deduced from the extrapolation of the isothermal −ΔSM vs. M2 curves and from the Arrott plots μ0H/M vs. M2. | |
Using eqn (4) and after many repetitions of the analysis fits, the critical exponent β determined by the Landau model is found to be 0.52 ± 0.41. The good agreement between the two methods allows to prove the validity of this recipe to estimate the spontaneous magnetization using a mean-field analysis of the magnetic entropy change in our sample.
4. Conclusion
To summarize, we have investigated the critical behavior and spontaneous magnetization in La0.7Ca0.1Pb0.2Mn0.95Al0.025Sn0.025O3 sample. The reliable exponents (TC, β, γ and δ) are obtained based on various research techniques including modified Arrott plot, Kouvel–Fisher method, and critical isotherm analysis. It is found that the estimated critical exponents confirm that the experimental data agree well with the theoretical prediction of the mean-field model, and are dominated by a long range interactions around TC. Moreover, a perfect agreement was gained between two different techniques for determining the spontaneous magnetization by modeling the magnetic entropy change of second order magnetic phase transitions.
Conflicts of interest
There are no conflicts to declare.
References
- M. H. Phan and S. C. Yu, J. Magn. Magn. Mater., 2007, 308, 325 CrossRef CAS.
- A. Kitanovski and P. W. Egolf, J. Magn. Magn. Mater., 2009, 321, 777 CrossRef CAS.
- J. B. Goodenough, J. Appl. Phys., 1997, 81, 5330 CrossRef CAS.
- A. J. Millis, B. I. Shraiman and R. Mueller, Phys. Rev. Lett., 1996, 77, 175 CrossRef CAS PubMed.
- C. Zener, Phys. Rev., 1951, 82, 403 CrossRef CAS.
- Y. Motome and N. Furulawa, J. Phys. Soc. Jpn., 2000, 69, 3785 CrossRef CAS.
- Y. Motome and N. Furulawa, J. Phys. Soc. Jpn., 2001, 70, 1487 CrossRef CAS.
- K. Ghosh, C. J. Lobb, R. L. Greene, S. G. Karabashev, D. A. Shulyatev, A. A. Arsenov and Y. Mukovskii, Phys. Rev. Lett., 1998, 81, 4740 CrossRef CAS.
- C. V. Mohan, M. Seeger, H. Kronmüller, P. Murugaraj and J. Maier, J. Magn. Magn. Mater., 1998, 183, 348 CrossRef CAS.
- A. Omri, A. Tozri, M. Bejar, E. Dhahri and E. K. Hlil, J. Magn. Magn. Mater., 2012, 324, 3122 CrossRef CAS.
- D. Ginting, D. Nanto, Y. D. Zhang, S. C. Yu and T. L. Phan, Phys. B, 2013, 421, 17 CrossRef.
- L. Chen, J. H. He, Y. Mei, Y. Z. Cao, W. W. Xi, H. F. Xu, Z. W. Zhu and Z. A. Xu, Phys. B, 2009, 404, 1879–1882 CrossRef CAS.
- J. Fan, L. Ling, B. Hong, L. Zhang, L. Pi and Y. Zhang, Phys. Rev. B: Condens. Matter Mater. Phys., 2010, 81, 144426 CrossRef.
- K. Dhahri, N. Dhahri, J. Dhahri, K. Taibi, E. K. Hlil, H. Belmabrouk and M. Zaidi, RSC Adv., 2017, 7, 43410–43423 RSC.
- K. Dhahri, N. Dhahri, J. Dhahri, K. Taibi and E. K. Hlil, J. Alloys Compd., 2017, 699, 619–626 CrossRef CAS.
- C. Vazquez-Vazquez, M. C. Blanco, M. A. Lopez-Quintela, R. D. Sanchez, J. Rivas and S. B. Oseroff, J. Mater. Chem., 1998, 8(4), 991 RSC.
- H. L. Ju and H. Sohn, J. Magn. Magn. Mater, 1997, 167, 200 CrossRef CAS.
- K. A. Gschneidner, V. K. Pecharsky and A. O. Tsokol, Rep. Prog. Phys., 2005, 68, 1479 CrossRef CAS.
- D. T. Morelli, A. M. Mance, J. V. Mantese and A. L. Micheli, J. Appl. Phys., 1996, 79, 373 CrossRef CAS.
- V. K. Pecharsky and K. A. Gschneidner Jr, Phys. Rev. Lett., 1997, 78, 4494 CrossRef CAS.
- D. N. H. Nam, N. V. Dai, L. V. Hong, N. X. Phuc, S. C. Yu, M. Tachibana and E. Takayama-Muromachi, J. Appl. Phys., 2008, 103, 043905 CrossRef.
- Y. Sun, M. B. Salamon and S. H. Chun, J. Appl. Phys., 2002, 92, 3235 CrossRef CAS.
- X. Bohigas, J. Tejada, E. Del Barco, X. X. Zhang and M. Sales, Appl. Phys. Lett., 1998, 73, 390 CrossRef CAS.
- N. Chau, H. N. Nhat, N. H. Luong, D. L. Minh, N. D. Tho and N. N. Chau, Phys. B, 2003, 327, 270 CrossRef CAS.
- B. K. Banerjee, Phys. Lett., 1964, 12, 16 CrossRef.
- J. Mira, J. Rivas, F. Rivadulla, C. Vazquez and M. A. Lopez-Quintela, Phys. Rev. B: Condens. Matter Mater. Phys., 1999, 60, 2998–3001 CrossRef CAS.
- H. E. Stanley, Introduction to Phase Transitions and Critical Phenomena, Oxford University Press, London, 1971 Search PubMed.
- A. Arrott and J. E. Noakes, Phys. Rev. Lett., 1967, 19, 786 CrossRef CAS.
- H. E. Stanley, Rev. Mod. Phys., 1999, 71, S358 CrossRef CAS.
- H. S. Shin, J. E. Lee, Y. S. Nam, H. L. Ju and C. W. Park, Solid State Commun., 2001, 118, 377 CrossRef CAS.
- B. Widom, J. Chem. Phys., 1965, 43, 3898 CrossRef.
- C. V. Mohan, M. Seeger, H. Kronmüller, P. Murugaraj and J. Maier, J. Magn. Magn. Mater., 1998, 183, 348 CrossRef CAS.
- J. S. Kouvel and M. E. Fisher, Phys. Rev., 1964, 136, A1626 CrossRef.
- B. Yu, W. Sun, J. Fan, X. Lan, W. Zhang, Y. Zhu, H. Han, L. Zhang, L. Ling and H. Yang, Mater. Res. Bull., 2018, 99, 393–397 CrossRef CAS.
- N. Dhahri, J. Dhahri, E. K. Hlil and E. Dhahri, J. Magn. Magn. Mater., 2012, 324, 806–811 CrossRef CAS.
- L. Xu, J. Fan, W. Sun, Y. Zhu, D. Hu, J. Liu, Y. Ji, D. Shi and J. Hao Yang, Appl. Phys. Lett., 2017, 111(5), 052406 CrossRef.
- M. Baazaoui, S. Hcini, M. Boudard, S. Zemni and M. Oumezzine, J. Magn. Magn. Mater., 2016, 401, 323–332 CrossRef CAS.
- M. H. Phan, V. Franco, N. S. Bingham, H. Srikanth, N. H. Hur and S. C. Yu, J. Alloys Compd., 2010, 508, 238 CrossRef CAS.
- J. Yang and Y. P. Lee, Appl. Phys. Lett., 2007, 91, 142512 CrossRef.
- N. Ghosh, S. Rößler, U. K. Rößler, K. Nenkov, S. Elizabeth, H. L. Bhat, K. Dörr and K. H. Müller, J. Phys.: Condens. Matter, 2006, 18, 557 CrossRef CAS.
- D. Ginting, D. Nanto, Y. D. Zhang, S. C. Yu and T. L. Phan, Phys. B, 2013, 412, 17 CrossRef CAS.
- M. Ziese, J. Phys.: Condens. Matter, 2001, 13, 2919 CrossRef CAS.
- S. N. Kaul, J. Magn. Magn. Mater., 1985, 53, 5 CrossRef CAS.
- K. Huang, Statistical Mechanics, Wiley, New York, 2nd edn, 1987 Search PubMed.
- J. L. Alonso, L. A. Fernández, F. Guinea, V. Laliena and V. Martín-Mayor, Nucl. Phys. B, 2001, 596, 587 CrossRef.
- H. Oesterreicher and F. T. Parker, Magnetic cooling near Curie temperatures above 300 K, J. Appl. Phys., 1984, 55, 4334 CrossRef CAS.
- J. Fan, L. Pi, L. Zhang, W. Tong, L. Ling, B. Hong, Y. Shi, W. Zhang, Di Lu and Y. Zhang, Appl. Phys. Lett., 2011, 98(7), 072508 CrossRef.
- M. Pekala, J. Appl. Phys., 2010, 108, 113913 CrossRef.
- R. B. Griffiths, Phys. Rev., 1967, 158, 176 CrossRef.
- V. Franco, J. S. Blázquez and A. Conde, J. Appl. Phys., 2008, 103, 07B316 CrossRef.
- A. Hankey and H. E. Stanley, Phys. Rev. B: Solid State, 1972, 6, 3515 CrossRef.
- A. K. Pramanik and A. Banerjee, Phys. Rev. B: Condens. Matter Mater. Phys., 2009, 79, 214426 CrossRef.
- A. B. Harris, J. Phys. C: Solid State Phys., 1974, 7, 1671 CrossRef.
- K. Huang, Statistical Mechanics, Wiley, New York, 2nd edn, 1987 Search PubMed.
- J. S. Amaral and V. S. Amaral, J. Magn. Magn. Mater., 2010, 322, 1552 CrossRef CAS.
- G. J. Liu, J. R. Sun, J. Lin, Y. W. Xie, T. Y. Zhao, H. W. Zhang and B. G. Shen, Appl. Phys. Lett., 2006, 88(21), 212505 CrossRef.
- L. Xu, J. Fan, Y. Zhu, Y. Shi, L. Zhang, L. Pi, Y. Zhang and D. Shi, Mater. Res. Bull., 2016, 73, 187–191 CrossRef CAS.
- X. Zhang, J. Fann, L. Xu, D. Hu, W. Zhang and Y. Zhu, Ceram. Int., 2016, 42(1), 1476–1481 CrossRef CAS.
|
| This journal is © The Royal Society of Chemistry 2018 |
Click here to see how this site uses Cookies. View our privacy policy here.  Open Access Article
 *a,
N. Dhahria,
J. Dhahri
 a,
K. Taibib and
E. K. Hlilc


 , to scaling ΔS in the critical region (around TC). By using the scaled magnetic equation of state and eqn (1), Franco et al. were capable of showing that:50
 (ref. 15) and using the appropriate values for the critical exponents and the Curie temperature, Franco et al. plotted their experimental data as
  and found that all the data for all temperatures and fields collapse on a single curve, which proves the validity of eqn (18). Using the values of β, γ, and TC obtained from the modified Arrott plots method, the scaled data are plotted in Fig. 11. All data for our sample collapse on a single master curve for all measured fields and temperatures. The excellent overlap of the experimental data points clearly indicates that the obtained values of β, γ, and TC for this compound is in agreement with the scaling hypothesis near magnetic transition.


