
 Open Access Article
 This Open Access Article is licensed under a Creative Commons Attribution-Non Commercial 3.0 Unported Licence
Photocatalytic activity of Ag/Al2O3–Gd2O3 photocatalysts prepared by the sol–gel method in the degradation of 4-chlorophenol†
A. Barrera *a,
F. Tzompantzi*b,
J. Campa-Molinac,
J. E. Casillasa,
R. Pérez-Hernándezd,
S. Ulloa-Godinezc,
C. Velásqueze and
J. Arenas-Alatorref
*a,
F. Tzompantzi*b,
J. Campa-Molinac,
J. E. Casillasa,
R. Pérez-Hernándezd,
S. Ulloa-Godinezc,
C. Velásqueze and
J. Arenas-Alatorref
aLaboratorio de Nanomateriales Catalíticos, Centro Universitario de la Ciénega, Universidad de Guadalajara, Av. Universidad, No. 1115, Col. Linda Vista, C.P. 47820, Ocotlán, Jalisco, México. E-mail: arturo.barrera@cuci.udg.mx; arturobr2003@yahoo.com.mx; Tel: +52 392 92 594 00
bDepto. de Química, Área de Catálisis, Universidad Autónoma Metropolitana – Iztapalapa, Av. San Rafael Atlixco 189, C.P. 09340, Cd. de México, México. E-mail: fjtz@xanum.uam.mx
cLaboratorio de Materiales Avanzados, Universidad de Guadalajara Depto. De Electrónica, Blvd. Marcelino García Barragán 1422 esq. Calzada Olímpica, Col. Olímpica 44430, Guadalajara, Jalisco, México
dLaboratorio de Nanocatálisis, Depto. de Tecnología de Materiales, Instituto Nacional de Investigaciones Nucleares, Carr. México-Toluca S/N, La Marquesa, Ocoyoacac, Edo. De México C.P. 52750, México
eCentro de Investigación en Nanociencia y Nanotecnología, Centro Universitario de los Valles, Universidad de Guadalajara, Ameca, Jalisco 46600, México
fUniversidad Nacional Autónoma de México, Instituto de Física, México D.F., México
First published on 15th January 2018
Abstract
The photocatalytic activity in the degradation of 4-chlorophenol (4-ClPh) in aqueous medium (80 ppm) using 2.0 wt% Ag/Al2O3–Gd2O3 (Ag/Al–Gd-x; where x = 2.0, 5.0, 15.0, 25.0 and 50.0 wt% of Gd2O3) photocatalysts prepared by the sol–gel method was studied under UV light irradiation. The photocatalysts were characterized by N2 physisorption, X-ray diffraction, SEM, HRTEM, UV-Vis, XPS, FTIR and fluorescence spectroscopy. About 67.0% of 4-ClPh was photoconverted after 4 h of UV light irradiation using Ag/γ-–Al2O3. When Ag/Al–Gd-x photocatalysts were tested, the 4-ClPh photoconversion was improved and more than 90.0% of 4-ClPh was photoconverted after 3 h of UV light irradiation in the materials containing 15.0 and 25.0 wt% of Gd2O3. Ag/Al–Gd-25 was the material with the highest efficacy to mineralize dissolved organic carbon, mineralizing more than 85.0% after 4 h of UV light irradiation. Silver nanoparticles and micro-particles of irregular pentagonal shape intersected by plane nanobelts of Al2O3–Gd2O3 composite oxide were detected in the Ag/Al–Gd-25 photocatalyst. This material is characterized by a lowest recombination rate of electron–hole pairs. The low recombination rate of photo-induced electron–hole pairs in the Ag/Al–Gd-x photocatalysts with high Gd2O3 contents (≥15.0 wt%) confirmes that the presence of silver nanoparticles and microparticles interacting with Al2O3–Gd2O3 composite oxide entities favors the separation of photo-induced charges (e− and h+). These materials could be appropriate to be used as highly efficient photocatalysts to eliminate high concentrations of 4-ClPh in aqueous medium.
Introduction
Nowadays, environmental pollution caused by hazardous substances from wastewater of industrial processes is a worldwide problem. As an example, the emission of phenolic compounds to the wastewater is among the most critical. These contaminant organic compounds are considered to be hazardous wastes, which are highly toxic and difficult to degrade biologically. Among these contaminants, 4-chlorophenol (4-ClPh) is a recalcitrant organic compound and it plays a main role due to its extensive use. The source of these phenolic compound include the wastewater of many industrial processes such as petroleum refining, plastic, resins, textile and pesticide production, paper processing, and carbon liquefaction among others.1–3 4-ClPh released to the environment is very stable and persistent for which it has no capability of assimilation requiring a very long time for its natural degradation, therefore it is necessary to find efficient methods for its rapid degradation. It has been attempted to eliminate these recalcitrant organic compounds by physicochemical and biological methods; however, these treatments are not very effective due to their high chemical stability and low biodegradability.2 Among the new technologies, increased attention has been paid in the last years to the application of photo-catalytic methods as highly efficient advanced oxidation processes (AOP) for eliminating organic pollutants in aqueous wastes.1–3 The elimination of recalcitrant organic pollutants in aqueous medium is assured since these methods decompose contaminant molecules into harmless compounds. The photo-catalytic method is based on the use of semiconductor materials as photocatalysts and UV or visible light as irradiation source. Among the photocatalytic materials, TiO2,4–6 Bi2O4 and Bi2O7,7 and layered double hydroxides8,9 have been tested for the photodegradation of phenolic compounds in aqueous medium. Alternative, it has been demonstrated in earlier work that in spite that γ-Al2O3 is considered as an isolating material, it exhibits high photocatalytic activity in the degradation of contaminant organic molecules in aqueous medium.10 However, it is necessary to improve the photocatalytic activity of γ-Al2O3 because it needs relatively long reaction times to reach a high photoconversion of contaminant organic molecules. One way in order to improve the photocatalytic activity of γ-Al2O3 is by addition of rare earth oxides and by coupling the Al2O3–Ln2O3 composite oxides with noble metal oxides.11,12 Regarding to it, we have reported in earlier works the use of noble metal oxides such as PdO supported on Al2O3–Nd2O3 binary oxides prepared by the sol–gel method as interesting co-catalysts for the photodegradation of 2, 4-D and phenol molecules in aqueous medium.11,12 Concerning to it, it is known that the coupling of semiconductor oxides with noble metals increase their photocatalytic response by reducing the recombination rate of the photogenerated charge carriers.13–22 In this sense one very attractive noble metal to be used as photocatalytic component is silver due to its remarkable activity and optical properties dependent on its particle size.23–30 Gadolinium oxide (Gd2O3) is another interesting lanthanide oxide which has been used as doping agent of TiO2 and ZnO semiconductors in order to improve their photocatalytic properties.31 Gd2O3 is attractive due to its high chemical durability although it absorbs UV light in the same region as that of γ-Al2O3 and its band gap energy ranges from 3.8 eV to 5.4 eV depending of its structure.32,33 Although γ-Al2O3 is considered as an insulating material it would be very interesting to investigate the influence of Gd2O3 addition to γ-Al2O3 and the coupling with silver in order to improve the photocatalytic activity of γ-Al2O3. In the present work, silver was deposited by impregnation onto Al2O3–Gd2O3 composite oxides prepared by the sol–gel method to obtain Ag/Al2O3–Gd2O3 photocatalysts. We assume that the preparation of Al2O3–Gd2O3 composite oxides by the sol–gel method might result in the obtention of well mixed homogeneous supports with a uniform dispersion of Al2O3 and Gd2O3 phases and a major interaction with silver species in order to produce the separation of photoinduced (e−, h+) charges. The purpose of the present work is the study of the photocatalytic performance of Ag/Al2O3–Gd2O3 co-catalysts prepared by the sol–gel method in the photodegradation of 4-chlorophenol (4-ClPh) in aqueous medium. The influence of the textural, structural, optical and surface properties of the Ag/Al2O3–Gd2O3 photocatalysts on their photocatalytic activity in the photodegradation of 4-chlorophenol were studied.Experimental
Synthesis of Ag/Al–Gd-x photocatalysts
Al2O3–Gd2O3 mixed oxides with different concentration of Gd2O3 (Al–Gd-x, where x = 2.0, 5.0, 15.0, 25.0, 50.0 wt% of Gd2O3) were synthesized by the standard sol–gel method using organic precursors, in brief: a required volume of aluminum tri-sec-butoxide, Al(sec-but.)3, (Aldrich) was dissolved in a three mouth glass flask containing 10 mL of 2-methylpentane 2,4-diol (JT Baker) as a complexing agent. The precursor solution was heated at 70 °C under continuous stirring for 1 h. After that, the solution was cooled down to 50 °C and then a required amount of gadolinium acetyl-acetonate, Gd(AcAc)3, (Aldrich) previously dissolved in acetone at 40 °C was added. The precursor solution was kept at 50 °C being continuously stirred for 1 h. Then, a volume of 10 mL of deionised water was added to the solution drop wise. The obtained gels were aged at 50 °C for 4 h and then aged again now at 70 °C during 16 h. After that, the solids were dried at 110 °C for 12 h followed by calcination under static air at 650 °C for 4 h to obtain Al2O3–Gd2O3 composite oxides. Pure Al2O3 (Al) was prepared the same method as described above but without the addition of gadolinium acetyl-acetonate. Also, pure Gd2O3 (Gd) was prepared by calcination of gadolinium acetyl-acetonate powder at 800 °C by 5 h. Calcined Al2O3, Gd2O3 and Al–Gd-x mixed oxides were impregnated with silver acetyl-acetonate, Ag(AcAc)2 (Aldrich) dissolved in toluene in appropriated amounts to obtain photocatalysts with theoretically 2.0 wt% of Ag2O. Finally, the impregnated solids were dried at 110 °C for 12 h followed by calcination in an oven at 500 °C for 3 h.Characterization of Ag/Al–Gd-x photocatalysts
Textural properties of Ag/Al and Ag/Al–Gd-x photocatalysts were studied by nitrogen physisorption at the saturation temperature of liquid nitrogen (−195.6 °C) by using an Autosorb gas sorption system (IQ model from Quantachrome). Samples were outgassed with He flow at 300 °C for 5 h previous to the measurements. Specific surface area was calculated by using the Brunauer–Emmet–Teller (BET) equation. Pore size distributions were calculated by applying the Barrett, Joyner and Halenda (BJH) method to the desorption branch of nitrogen isotherms.Structure properties of Ag/Al and Ag/Al–Gd-x photocatalysts were studied by X-ray diffraction by using a Theta–Theta model X-ray diffractometer (STOE Gmbh, Germany). X-ray diffraction patterns were recorded at room temperature in the 2θ angle range between 5° and 70°, with a 2θ step of 0.02° and 1s per step point and using a Cu Kα (λ = 0.154 nm) electromagnetic radiation source. Identification of the diffraction peaks from the XRD patterns was carried out using the JCPDS database included in the software of the equipment. Structural properties of Ag/Al and Ag/Al2O3–Gd-x photocatalysts were also studied by scanning electron microscopy. SEM images of Ag/Al and Ag/Al–Gd-25 photocatalysts were obtained using a scanning electron microscope, HRSEM Jeol 7600F, with a power of 30 kV and a resolution of 1 nm.
TEM images of Ag/Al–Gd-25 sample were also obtained using a TEM JEM2010FEG microscope with a special resolution of 0.19 nm. The sample microstructure of Ag/Al–Gd-25 sample was imaged through high-resolution transmission electron microscopy (TEM) using a Jeol JEM-2010 FEG at 200 or scanning transmission electron microscopy—high angle annular dark field (STEM-HAADF). For TEM observation, the samples were crushed in ethanol and the solution was ultrasonically stirred before dropping it on a holey carbon-covered copper TEM grid, followed by drying. In order to elucidate the nature of the Ag and Al2O3–Gd2O3 composite oxide, we perform HAADF analysis (high-angle annular dark-field microscopy) which depends on the atomic numbers of the elements (Z contrast). In the case of Ag/Al2O3–Gd2O3 catalysts, the difference among the atomic number of the elements makes it possible to observe notable differences in the contrast of the image.
Optical properties of Ag/Al and Ag/Al–Gd-x photocatalysts were studied by UV-Vis diffuse reflectance spectroscopy by using an UV-Vis CARY 300 SCAN spectrophotometer in the wavelength range of 190–800 nm with a scan speed of 600 nm min−1; intervals of data collection of 1 nm and a change of the light source at a wavelength of 350 nm.
Surface properties of Ag/Al and Ag/Al–Gd-x photocatalysts were studied by XPS. The XPS spectra were recorded on a VG ESCALAB 250 apparatus after excitation with a monochromatic Al Kα radiation (hν = 1486.6 eV). Samples were embedded onto indium foils which were pressed manually and placed to a holder. Calibration of the energy position of an XPS peak was performed by using the binding energy of carbon 1s peak at 284.8 eV. The unresolved XP spectra for the Gd 3d transition were deconvoluted with two doublets by using a standard Gaussian function. The binding energies values were assigned to the corresponding oxidation state according to literature data. Fluorescence experiments of Al2O3, Ag/Al, Ag/Gd and Ag/Al–Gd-x photocatalysts were carried out using a Fluorescence Varian Cary eclipse spectrophotometer using an excitation wavelength of 250 nm.
Photocatalytic degradation of 4-chlorophenol
The 4-chlorophenol (4-ClPh) photo-catalytic degradation was carried out using a 1 L batch-type round bottom cylindrical glass photo-reactor surrounded by a double-wall glass jacket. Previous to photo-degradation experiments, an aqueous solution of 4-ClPh (Aldrich) with a concentration of 80 ppm was bubbled with air during 2 h. After that, 200 mL of the 4-ClPh dissolution was put into the glass photo-reactor followed by the addition of 200 mg of either Ag/Al or Ag/Al–Gd photocatalysts to give a concentration of 1 mg of photo-catalyst per mL of 4-ClPh solution. Under continuous aeration (1 mL s−1) and stirring, the 4ClPh dissolution was irradiated using a protected quartz tube with a Pen-Ray UV power supply lamp (UVP products) of a typical wavelength of 254 nm and an intensity of 4400 μW cm−2, immersed into the solution. Prior to the photo-catalytic experiments, the 4-ClPh solution and the photocatalyst were kept in contact for 1 h without irradiation in order to determine the adsorption capacity of the solids. Then, the UV lamp was turned on. To follow the photo-degradation of 4-ClPh as a function of time, samples of the irradiated solution were taken each hour from the photo-reactor using a filter for a period of 5 h. The 4-ClPh degradation was followed by UV-Vis spectroscopy, employing a CARY 100 spectrophotometer measuring the absorbance at λ = 279 nm and using the Lambert and Beer equation for the calculation of the concentration of photo-converted 4-ClPh. The relative concentration (C/C0) data of photo-converted 4-ClPh were adjusted to a first order kinetics of Langmuir–Hinshelwood model type. The total organic carbon (TOC) was followed using a TOC-VCEN Shimadzu 5000 analyzer (catalytic oxidation on Pt at 680 °C). Calibration runs were performed injecting known amounts of potassium phthalate.Results and discussion
Textural properties of Ag/Al–Gd-x photocatalysts
Fig. 1A shows the N2 adsorption–desorption isotherms of Ag/Al and Ag/Al–Gd-x photocatalysts. The isotherms are of the type IV corresponding to mesoporous materials according to the IUPAC classification.34 The hysteresis loop is changing from the H1-type at low Gd2O3 concentration to the H2-type at high Gd2O3 concentration in the Ag/Al–Gd-x materials.35 The maximum of the modal peak of the pore size distributions of Ag/Al–Gd-x photocatalysts is shifted to a less pore size with the increase in the Gd2O3 concentration (Fig. 1B). | ||
| Fig. 1 (A) Nitrogen adsorption–desorption isotherms of Ag/Al–Gd-x photocatalysts; (B) pore size distributions of Ag/Al–Gd-x photocatalysts. | ||
The SBET of Ag/Al (261.0 m2 g−1) is improved with addition of a low concentration of Gd2O3 to obtain a maximum (SBET = 270.0 m2 g−1) in the Ag/Al–Gd-5 photocatalyst (Table 1). At higher concentration of Gd2O3, the SBET of the materials decreased to a minimum SBET as observed in the bare Ag/Gd2O3 (SBET = 2.0). Such improvement in the SBET at low concentration of Gd2O3 in the Ag/Al–Gd-x photocatalysts indicates that Gd2O3 acts as a textural promoter of γ-Al2O3.
| Co-catalyst | SBET (m2 g−1) | VPT (cm3 g−1) | APD (nm) |
|---|---|---|---|
| Ag/Al2O3 | 261.0 | 0.85 | 13.0 |
| Ag/Al–Gd-2 | 268.7 | 1.24 | 18.4 |
| Ag/Al–Gd-5 | 270.4 | 0.96 | 14.1 |
| Ag/Al–Gd-15 | 192.0 | 0.37 | 7.7 |
| Ag/Al–Gd-25 | 101.0 | 0.19 | 7.6 |
| Ag/Al–Gd-50 | 112.0 | 0.23 | 8.2 |
| Ag/Gd2O3 | 0.6 | 0.004 | 25.0 |
The total specific pore volume of Ag/Al (VPT = 0.85 m2 g−1) is also improved with addition of a low concentration of Gd2O3 with the maximum (VPT = 1.24 cm3 g−1) observed in Ag/Al–Gd-2. At higher Gd2O3 concentrations the VPT decreased to a minimum value (VPT = 0.001 cm3 g−1) observed in the bare Ag/Gd2O3.
The average pore diameter of Ag/Al (APD = 13.0 nm) is also increased with addition of a low concentration of Gd2O3 obtaining a largest APD in Ag/Al–Gd-2 (APD = 18.2 nm) corroborating the highest VPT observed for this material (Table 1). At higher Gd2O3 content the APD decreased to 7.6–8.2 nm observed in silver photocatalysts containing 15.0–50.0 wt% of Gd2O3.
The tendency in the decrease of average pore diameter for high Gd2O3 concentration corroborates the shift in the decrease in the maximum of the modal peak of pore size distributions.
Structural properties of Ag/Al–Gd-x photocatalysts
XRD patterns of Ag/Al–Gd-x photocatalysts prepared by the sol–gel method are shown in Fig. 2. XRD pattern of pure Ag/Al shows diffraction peaks at 2θ = 33.1, 37.6, 46.3, and 66.7° corresponding to crystalline planes of γ-Al2O3 phase (JCPDS card: 10-0425). Whereas the XRD pattern of pure Ag/Gd shows diffraction peaks corresponding to crystalline planes of Gd2O3 with a cubic structure (JCPDS 12-0797). The diffraction peaks of γ-Al2O3 are also observed in the XRD patterns of Ag/Al–Gd-x photocatalysts, however, their intensities decrease with the increase in the Gd2O3 concentration. When the concentration of Gd2O3 is higher than 15.0 wt%, the diffraction peaks of γ-Al2O3 are almost planes and the XRD patterns being nearly similar to those shown by the disordered materials showing a lack of structural periodicity of long-range order. Not any diffraction peak corresponding to Gd2O3 phase is observed in the XRD patterns of Ag/Al–Gd-x photo-catalysts suggesting that amorphous Gd2O3 particles are homogeneously well mixed with the γ-Al2O3 agglomerates. | ||
| Fig. 2 X-ray diffraction patterns of the Ag/Al–Gd-x photocatalysts: (a) Ag/Al2O3; (b) Ag/Al–Gd-2; (c) Ag/Al–Gd-5; (d) Ag/Al–Gd-15; (e) Ag/Al–Gd-25; (f) Ag/Al–Gd-50; (g) Ag/Gd2O3. | ||
Moreover, it is observed a slight shifting in the diffraction peaks of γ-Al2O3 to lower 2θ angles in the XRD patterns of Ag/Al–Gd-x photocatalysts with 5.0 and 15.0 wt% of Gd2O3 indicating the incorporation of silver in the Al–Gd-x composite lattice. On the other hand, not any diffraction peak corresponding to silver phases were observed in the XRD patterns of either Ag/Al or Ag/Al–Gd-x photocatalysts which could be due to either the low concentration of silver (2.0 wt%), which is below of the limit of detection of the equipment, or to that small silver nanoparticles are present in the materials. This is confirmed by Z-contrast STEM image obtained by HAADF of Ag/Al–Gd-25 sample (Fig. 3A) showing a high dispersion of silver nanoparticles with sizes between 2.0 and 7.0 nm that are deposited on strongly scattering Al2O3–Gd2O3 composite oxide. Whereas, HRTEM micrograph of Ag/Al–Gd-25 sample shows that silver nanoparticles of spherical and irregular pentagonal shapes of approximately 6.0 nm in size are formed which are deposited on the surface of the amorphous Al2O3–Gd2O3 composite oxide (Fig. 3B). The magnification of the region of one nanoparticle depicted by the square in Fig. 3B shows the presence of rows of diffraction points, which are characteristic of the crystalline lattice planes. The measurement of the lattice distances in the region limited by the square indicates that they have d-spacings of 0.2016 and 0.2170 nm. These interplanar distances correspond to the hkl(200) and hkl(111) planes of the FCC structure of silver nanoparticles (JCPDS card: 04-0783). Furthermore, SEM micrograph of Ag/Al sample (Fig. 4) shows that silver micro-particles are also deposited on the surface of amorphous γ-Al2O3 agglomerates as observed by the bright white spots of approximately 1.0–3.0 μm in size. A linear scanning by element through the bright white spots indicates that they are composed mostly by metallic silver since the maximum of the linear scanning at about 15.0 μm denoted in color red (Fig. 4a) corresponding to silver coincides with the minimum of the linear scanning at about 15.0 μm in color green corresponding to oxygen (Fig. 4b). Therefore, it is inferred that metallic silver micro-particles are also present on the surface of pure Ag/Al2O3. This assumption is also inferred because the maximum of the linear scanning at about 4.0, 12.0 and 18.0 μm in color green belonging to oxygen (Fig. 4b) coincides with the maximum of the linear scanning at the same position in color blue corresponding to aluminum of γ-Al2O3 (Fig. 4c).
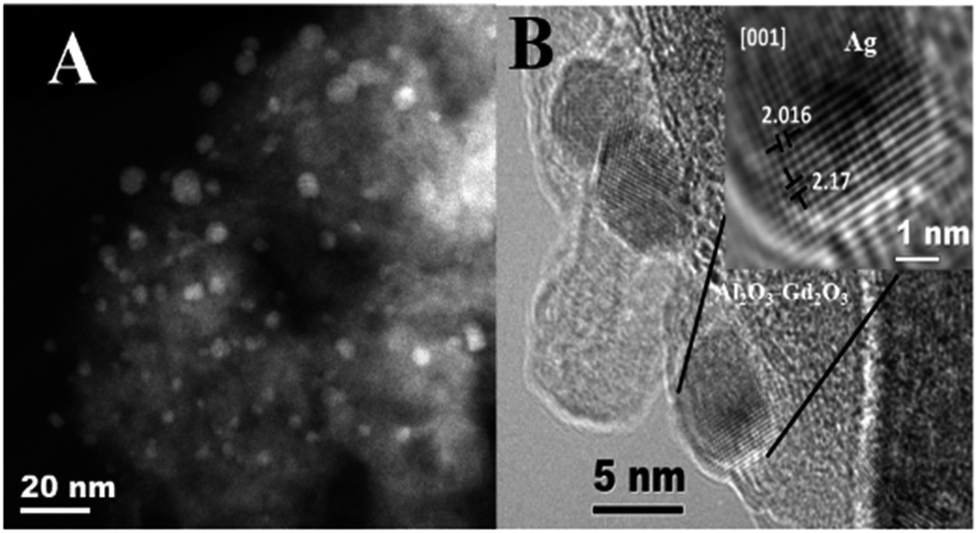 | ||
| Fig. 3 (A) HAADF STEM image of Ag/Al–Gd-25 photocatalyst; (B) HRTEM image of Ag/Al–Gd-25 photocatalyst. | ||
 | ||
| Fig. 4 SEM micrograph of the Ag/Al photocatalyst with linear scanning by element: (a) silver La1; (b) oxygen Ka1; (c) aluminum Ka1. | ||
On the other hand, SEM micrographs of Ag/Al–Gd-25 sample (Fig. 5A and B) show a high dispersion of silver particles. Furthermore, these SEM micrographs show that plane nano-belts of approximately 2.5 μm in length are formed which are oriented and intersected with silver micro-particles of approximately 0.6 μm in size. Moreover, the magnification of one of the regions in the SEM micrograph of Fig. 5A and B shows that some amorphous particles and some quasi-crystalline micro-particles of irregular pentagonal shape are formed which are intersected by the plane nano-belts (Fig. 5C and D). It seems that the plane nano-belts are formed by stacking of tiny material blocks that are self-assembled and oriented to the particles of pentagonal shape, some of which are found still in an amorphous state just in the process of formation. Therefore, it can be inferred that the pentagonal particles might be the seed of nucleation for the self-assembled plane nano-belts or that the stacking and orientation of plane nano-belts intersecting the micro-particles would produce their pentagonal shapes. The EDS elemental composition from the region shown in the SEM micrograph of Fig. 5D indicates that the bright pentagonal particles are composed mostly by a rich content of silver (16.42 wt%). Whereas, the plane nano-belts formed by stacking of material are composed mainly by 72.9 wt% of Al2O3 and 21.7 wt% of Gd2O3.
 | ||
Fig. 5 SEM micrographs of Ag/Al–Gd-25 photocatalyst: (A) ×11![[thin space (1/6-em)]](https://www.rsc.org/images/entities/char_2009.gif) 000; (B) ×11000; (C) ×37000; (D) ×60000. 000; (B) ×11000; (C) ×37000; (D) ×60000. | ||
Optical properties of Ag/Al–Gd-x photocatalysts
Fig. S1† shows the UV-Vis spectra of γ-Al2O3 and Al–Gd-x composite oxides, whereas inset the UV-Vis spectra of bare Gd2O3. UV-Vis spectrum of γ-Al2O3 shows a broad absorption band at about 264.0 nm with an absorption edge located at wavelengths between 290.0 and 350.0 nm that is attributed to charge transfer or the presence of a high density of defects in the structure of γ-Al2O3.36 Whereas, the UV-Vis spectrum of Gd2O3 exhibits an intense and broad absorption band at about 232.0 nm and two small sharp peaks located at 277.0 nm and 313.0 nm. The sharp peak at about 277 nm is assigned to the 8S7/2 to 6IJ Gd3+ transition of Gd2O3.37 Similar to γ-Al2O3, UV-Vis spectra of Al–Gd composite oxides also show a broad absorption band in the UV region with an absorption edge located between 290.0 and 350.0 nm whose intensity increases due to the overlap with the absorption bands of Gd2O3. UV-Vis spectra of Ag/Al, Ag/Al–Gd-x and Ag/Gd photocatalysts are shown in Fig. 6. These spectra also show absorption bands in the same UV region as γ-Al2O3 and Al–Gd-x composite oxides, however the absorption bands are located at about 219.0 and 255.0 nm due to the presence of silver species (Fig. 6). The high energy absorption band located at about 219.0 nm is assigned to the electronic transition from 4d10 to 4d9 5s1 orbital of Ag0 nanoparticles.38,39 Whereas, the absorption band at about 255.0 nm is attributed to the presence of Agnδ+ clusters.40 The absorption edge located between 255.0 and 310.0 nm in the UV-Vis spectra of Ag/Al is shifted to higher wavelengths in the Ag/Al–Gd-x photocatalysts. Furthermore, Ag/Al–Gd-25 sample exhibits some low intensity absorption bands located in the visible region at about 387.0, 483.0, 540.0, and 720.0 nm. These low energy absorption features are attributed to the surface plasmon resonance absorption of surface metallic silver particles.41 It is clear from UV-Vis spectra of Ag/Al–Gd-x photocatalysts that Agnδ+ clusters, metallic silver nanoparticles and micro-particles are present on the surface of Ag/Al–Gd-x photocatalysts.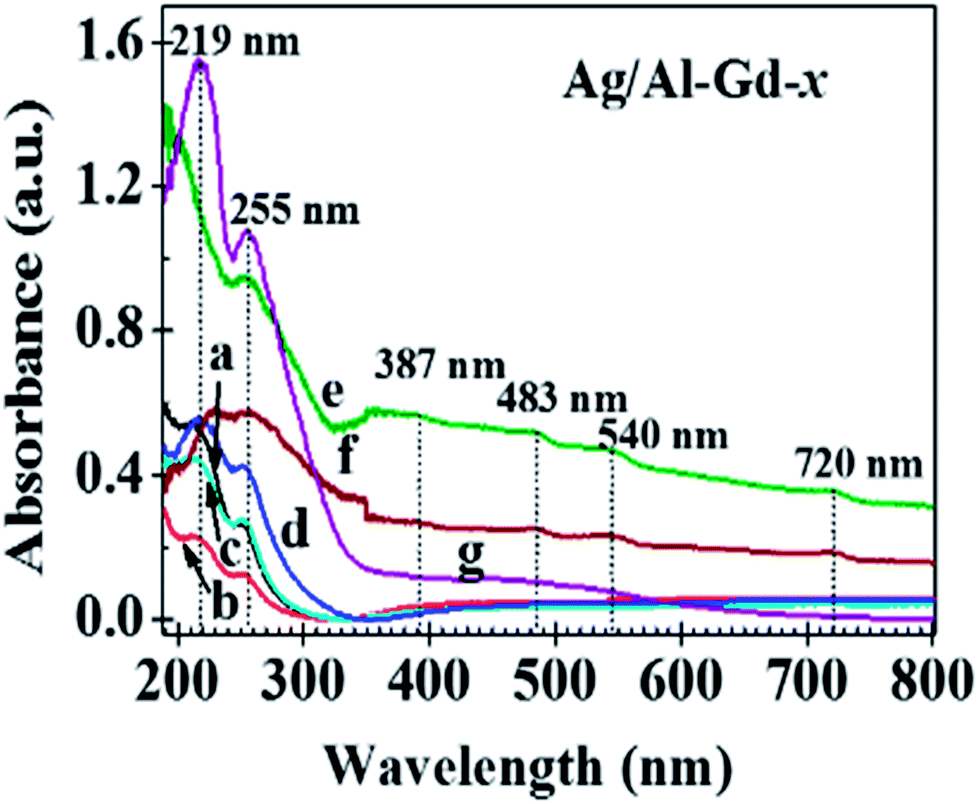 | ||
| Fig. 6 UV-Vis spectra of Ag/Al–Gd-x photocatalysts: (a) Ag/Al; (b) Ag/Al–Gd-2; (c) Ag/Al–Gd-5; (d) Ag/Al–Gd-15; (e) Ag/Al–Gd-25; (f) Ag/Al–Gd-50; (g) Ag/Gd. | ||
Chemical state of surface silver, gadolinium and aluminum species
XPS experiments were carried out in order to get an insight of the chemical state of silver particles on the surface of Ag/Al–Gd-x photocatalysts. Fig. 7A shows the high resolution XPS spectrum of the Ag 3d transition of Ag/Al–Gd-25 photocatalyst. The XPS spectrum exhibits two peaks at about 368.48 eV and 374.48 eV with an energy gap between maximums of 6.0 eV. This gap is characteristic of oxidation states of silver and corresponds to the energy spin–orbit splitting generating the Ag 3d5/2 and Ag 3d3/2 transitions.42 The Ag 3d5/2 transition is the most usually used to determine the oxidation state of silver. Therefore, this transition was used in order to know the oxidation state of silver species deposited on the surface of the Ag/Al–Gd-25 photocatalyst. The deconvolution of the XPS Ag 3d5/2 spectrum by a standard gauss function resulted in two doublets (Fig. 7B). The binding energy of the main component of the Ag 3d5/2 transition is located at about 368.45 eV and it is assigned to pure metallic silver.43 Whereas the smaller peak located at 367.92 eV has negative shift with respect to the binding energy of the main component and it is assigned to Ag+ ions.44 However, the intensity of the peak at 367.92 eV is too small, therefore the presence of Ag+ ions is nearly negligible on the surface of the material. A third XPS fitted peak located at 369.37 eV is attributed to charge transfer states of metallic silver.43 Therefore, the study of the chemical state of surface silver species over the Ag/Al–Gd-25 photocatalyst indicates that silver is found predominately in a metallic state. This is also corroborated in the XPS Ag 3d spectrum of bare Ag/Al (Fig. S2†) showing two peaks located at 368.3 and 374.3 eV with a energy gap between them of 6.0 eV that is typical of Ag 3d5/2 and Ag 3d3/2 transitions of Ag0.42 High resolution XPS spectrum of Gd 4d region (Fig. 7C) was performed in order to determine the chemical state of Gd species on the surface of Ag/Al–Gd-25 photocatalyst. The peaks at 147.98 and 143.57 eV corresponds to Gd 4d3/2 and Gd 4d5/2 transitions of Gd2O3 respectively.45–49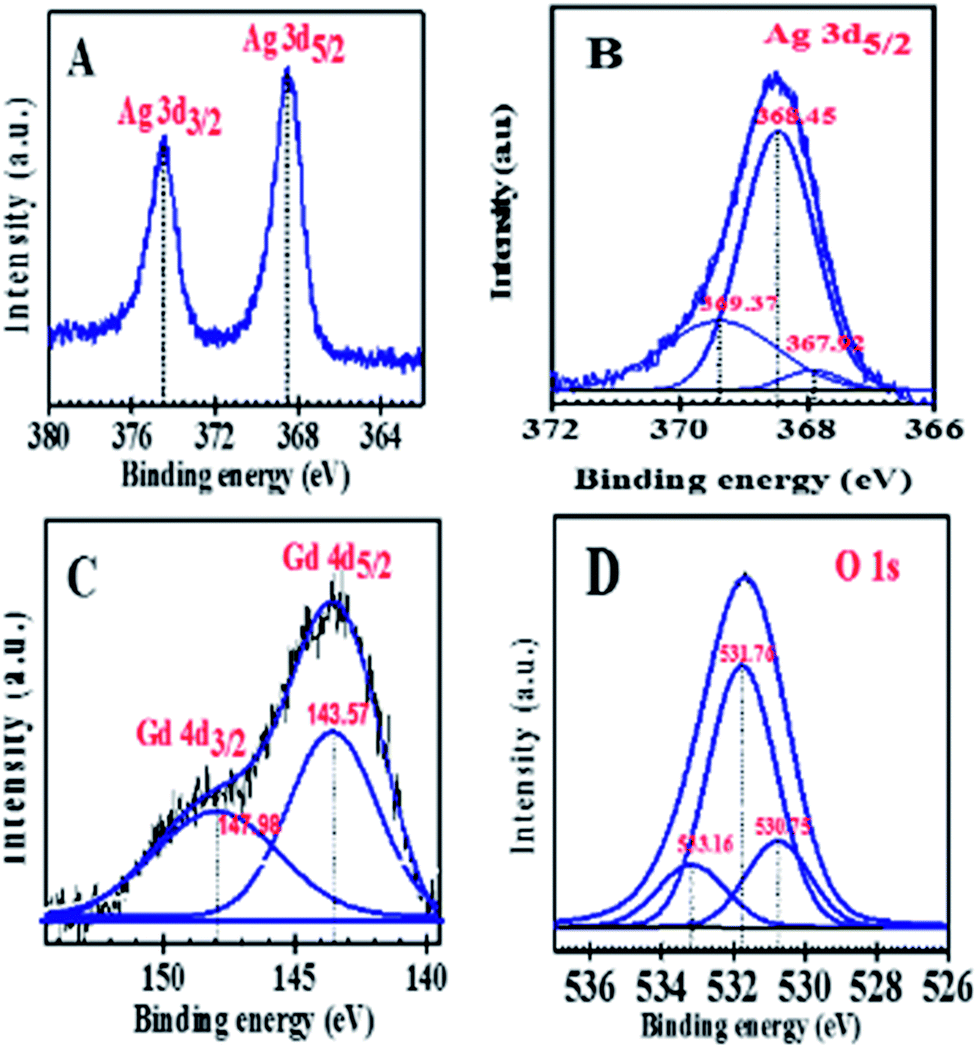 | ||
| Fig. 7 XPS spectra of Ag/Al–Gd-25 photocatalyst: (A) Ag 3d; (B) Ag 3d5/2; (C) Gd 4d; (D) O 1s. | ||
This corroborates that Gd2O3 species are present on the surface of Ag/Al–Gd-25 photocatalyst and make up the Al2O3–Gd2O3 nanobelts. The presence of Gd2O3 is also corroborated from the O 1s spectrum (Fig. 7D). This spectrum shows three peaks, one peak situated at 530.75 eV corresponds to the oxygen in Gd2O3.49 The main peak at 531.76 eV is assigned to atomic oxygen in the γ-Al2O3 lattice.50 Whereas the peak located at 533.16 eV is attributed to adsorbed molecular H2O.51
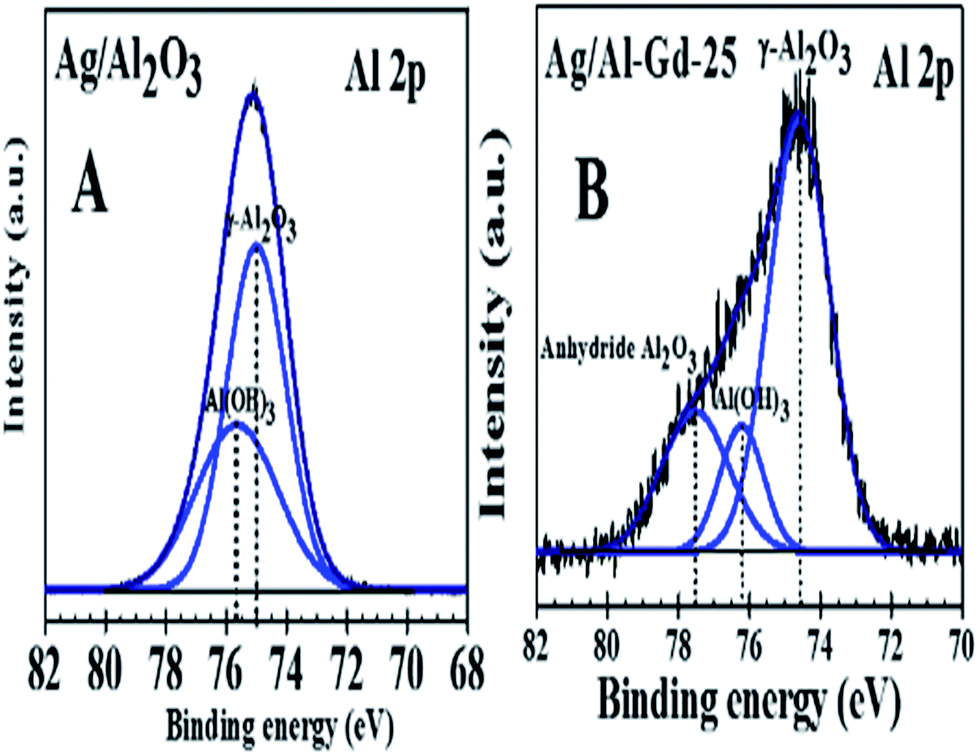
On the other hand, the effect of Ag and Gd2O3 on the elemental states of Al in Al2O3 is shown in Fig. 8A and B. Fig. 8A shows the XPS Al 2p spectrum of Ag/Al photocatalyst which is fitted in two peaks located at 75.0 eV and 75.6 eV. These binding energies corresponds to γ-Al2O3 and Al(OH)3 respectively.52,53 Whereas, the fitted XPS Al 2p spectrum of Ag/Al–Gd-25 material (Fig. 8B) shows three peaks located at 74.6, 76.2 and 77.5 eV that are assigned to γ-Al2O3, Al(OH)3 and anhydride Al2O3 respectively.54,55 As it can be seen, Ag and Gd2O3 influence the elemental chemical state of Al, when Gd2O3 is added to Al2O3, the binding energies of Al in the fitted XPS spectrum of Ag/Al–Gd-25 material change, the peak of γ-Al2O3 change to less binding energy (Eb = 74.6 eV) compared to that of Ag impregnated onto bare γ-Al2O3 (Eb = 75.0 eV). Whereas, the peak of Al(OH)3 located at 75.6 eV in the fitted XPS spectra of Ag/Al2O3 changes to a higher binding energy (Eb = 76.2 eV) in the Ag/Al–Gd-25 material. In addition other fitted XPS peak appear at 77.5 eV in the XPS spectrum of Ag/Al–Gd-25 which is attributed to anhydride Al2O3.
 | ||
| Fig. 8 XPS spectra of Al 2p for: (A) Ag/Al2O3; (B) Ag/Al–Gd-25. | ||
The presence of anhydride Al2O3 suggests the loss of hydroxyl groups of Al2O3 due to the addition of Gd2O3 to form the Al2O3–Gd2O3 composites.
This is corroborated from the FTIR experiments of Ag/Al–Gd-x photocatalysts (Fig. 9), the intense band located at about 3500 cm−1 in the FTIR spectrum of Ag/Al (Fig. 9a) that is assigned to the stretching vibration mode of OH groups became weaker with increasing the concentration of Gd2O3 in the Ag/Al–Gd-x photocatalysts and nearly disappeared in Ag/Al–Gd-25 photocatalyst (Fig. 9d) inferring that the coupling between Gd2O3 and γ-Al2O3 caused the dehydroxylation of the γ-Al2O3 surface. The same occurred with the FTIR band located at about 1694 cm−1 which corresponds to the bending vibration of OH groups. The loss of OH groups on the surface of Ag/Al–Gd-x photocatalysts for high Gd2O3 contents (>15.0 wt%) indicates that Gd2O3 caused the elimination of hydroxyl groups of alumina. On the other hand, the band at 1528 cm−1 is due to CO32− vibrations.33 CO32− groups could be arisen from residual carbon of the solvent used in the synthesis of the materials, however they are also eliminated at high Gd2O3 concentration.
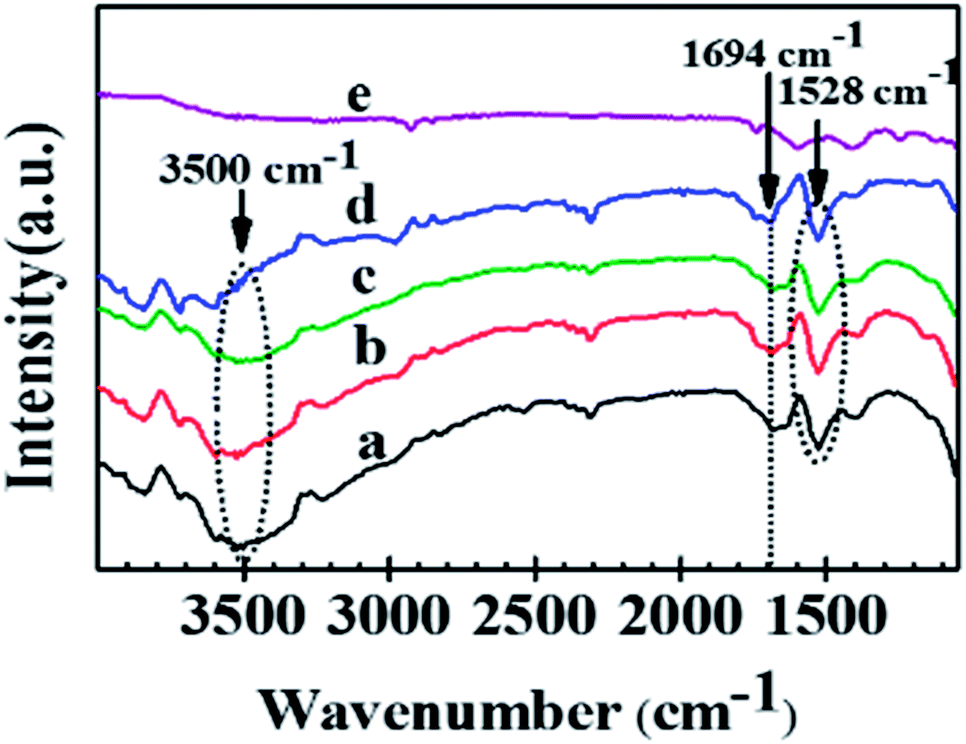 | ||
| Fig. 9 FTIR spectra of Ag/Al–Gd-x photocatalysts: (a) Ag/Al; (b) Ag/Al–Gd-2; (c) Ag/Al–Gd-5; (d) Ag/Al–Gd-15; (e) Ag/Al–Gd-25. | ||
Photocatalytic activity test in the degradation of 4-chlorophenol
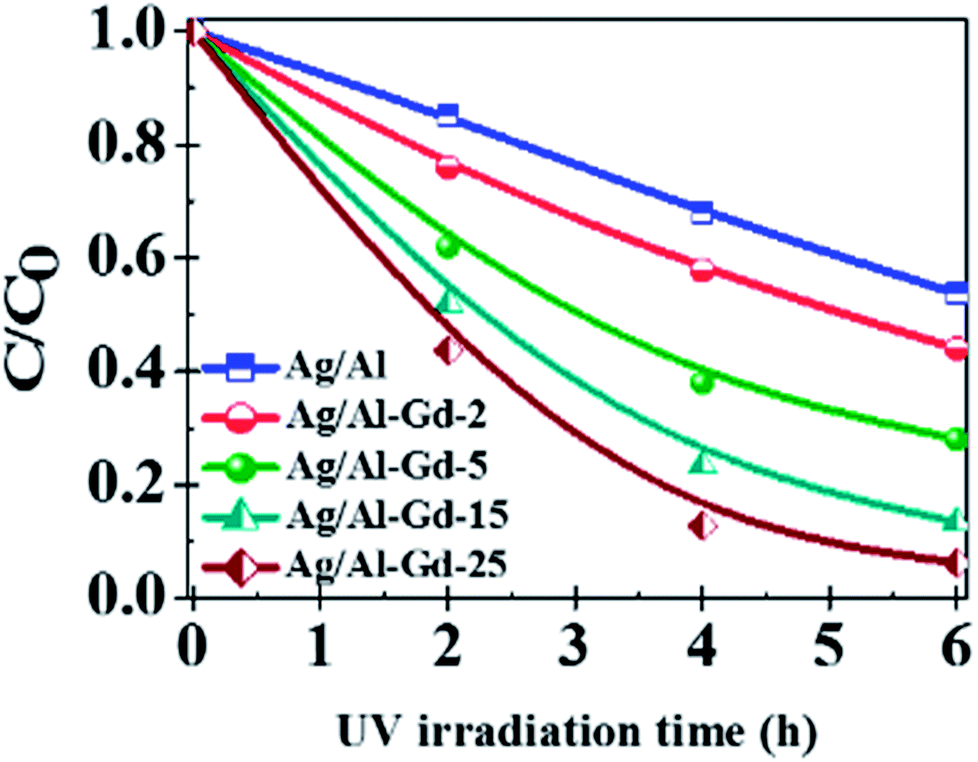
Previous studies concerning to the photo-catalytic activity of Ag/Al–Gd-x photocatalysts in the degradation of 4-ClPh, it was shown that 4-ClPh molecules in aqueous medium (80 ppm) were not photo-degraded by UV electromagnetic radiation alone without the presence of any photocatalyst (Fig. S3†). It was observed that a modification of the organic molecule occurred with the UV light irradiation, however, the UV light irradiation was not capable to photodegradate such organic molecule. In order to know the adsorption capability of Ag/Al–Gd-x photocatalysts, the aqueous 4-ClPh solutions where submitted to a continuous stirring alone without any UV light irradiation (dark light) during 1 h before starting the photo-degradation experiments. The 4-ClPh adsorption capability of γ-Al2O3 was about 27.0% (Table 2). However, the adsorption capability over Ag/Al decreased to 20.0% (Fig. 10, 11; Table 3). Furthermore, when Ag/Al–Gd-x photocatalysts were used, the adsorption capability of 4-ClPh greatly decreased to less than 6.0% indicating that the adsorption phenomena on the surface of Ag/Al–Gd-x photocatalysts was inhibited significantly by coupling Gd2O3 to γ-Al2O3 by the sol–gel method. Each one of adsorption percentage values of 4-ClPh shown by the photocatalysts was substracted from their corresponding photoconversion percentages during photodegradation in order to obtain the real photoconversion of 4-ClPh over the photocatalysts (Table 2). As shown in the UV-Vis spectrum of photoirradiated 4-ClPh over Ag/γ-Al2O3 (Fig. 10A), the intensity of the absorption band at about λ = 279 nm decreased uniformly with irradiation time showing the decomposition of 4-ClPh molecules. The relative concentration of 4-ClPh decreased uniformly with irradiation time in the Ag/Al photocatalyst to reach a C/C0 equal to 0.33 after 4 h of UV light irradiation (Fig. 11). However, when the Ag2O/Al–Gd-x photocatalysts were used, the intensity of the absorption band at about 279 nm in the UV-Vis spectra of photoirradiated 4-ClPh over Ag/Al–Gd-25 photocatalyst decreased more deeply and almost disappeared after just 3 h of reaction (Fig. 10B). The relative concentration was about 0.1 at 3 h of UV light irradiation in the Ag/Al–Gd-x photocatalysts with 15.0 and 25.0 wt% of Gd2O3 (Fig. 11). Table 2 shows the 4-chlorophenol photoconversion percentage exhibited by the materials. Pure γ-Al2O3 as support prepared by the sol–gel method photoconverted about 51.0% of 4-ClPh after 4 h of UV light irradiation. However, the photoconversion of 4-ClPh was improved by addition Gd2O3 to γ-Al2O3 as seen in the Al–Gd-15 composite oxide, photoconverting about 87.0% after 4 h of reaction and by coupling silver onto Al–Gd-x composite oxide supports (Table 2). The photo-conversion percentage of 4ClPh increased with Gd2O3 concentration in the Ag/Al–Gd-x photocatalysts. Comparatively, the maximum photo-conversion of 4-ClPh (67.0%) obtained by Ag/Al after 4 h of UV light irradiation was reached in less time when Gd2O3 was added to alumina to obtain Ag/Al–Gd-x photocatalysts (Table 2). The maximum photoconversion of 4-ClPh (∼90%) was observed in Ag/Al–Gd-15 and Ag/Al–Gd-25 photocatalysts after 3 h of UV light irradiation improving the photoconversion percentage in approximately 50.0% with respect to that of Ag/Al (Table 2). At higher Gd2O3 concentration the photoconversion of 4-ClPh decreased to 76.0% in Ag/Al–Gd-50 and 23.0% in the bare Ag/Gd2O3 photocatalyst after 3 h of UV light irradiation.| Co-catalyst | Adsorption% dark light during 1 h | 4-Chlorophenol photoconversion% with UV light irradiation during: | |||
|---|---|---|---|---|---|
| 1 h | 2 h | 3 h | 4 h | ||
| Al2O3 | 29.0 | 31.0 | 41.0 | 47.0 | 51.0 |
| Ag/Al2O3 | 20.0 | 33.0 | 47.0 | 60.0 | 67.0 |
| Ag/Al–Gd-2 | 6.0 | 35.0 | 61.0 | 73.0 | 81.0 |
| Ag/Al–Gd-5 | 3.0 | 40.0 | 67.0 | 78.0 | 87.0 |
| Al–Gd-15 | 10.0 | 31.0 | 66.0 | 81.0 | 87.0 |
| Ag/Al–Gd-15 | 2.0 | 49.0 | 80.0 | 89.0 | 93.0 |
| Ag/Al–Gd-25 | 5.0 | 35.0 | 65.0 | 90.0 | 95.0 |
| Ag/Al–Gd-50 | 3.0 | 17.0 | 46.0 | 76.0 | 97.0 |
| Ag/Gd2O3 | 5.0 | 0.0 | 0.0 | 23.0 | 61.0 |
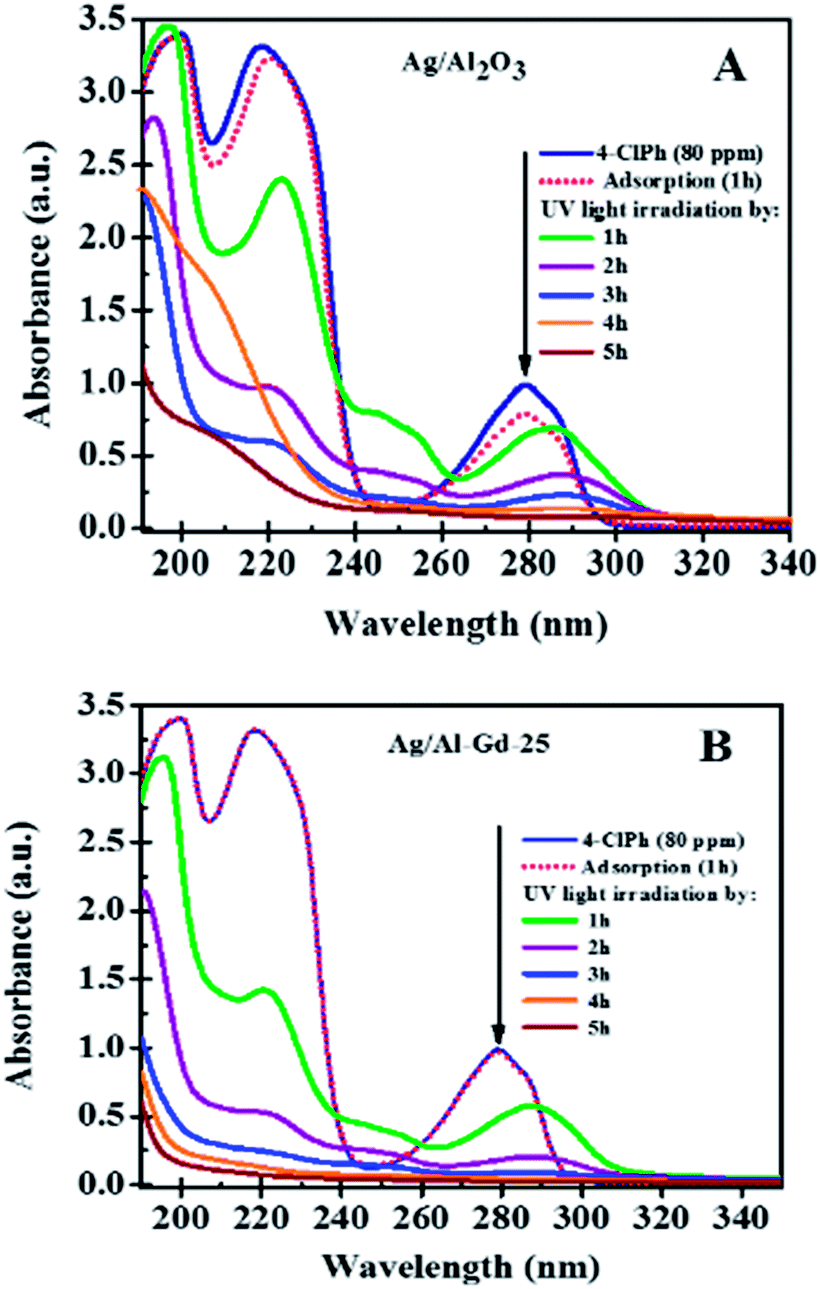 | ||
| Fig. 10 UV-Vis spectra of 4-chlorophenol after UV light irradiation by 5 h using: (A) Ag/Al2O3 and (B) Ag/Al–Gd-25 photocatalysts. | ||
 | ||
| Fig. 11 Relative concentration of 4-chlorophenol as a function of dark light and UV light irradiation time over Ag/Al–Gd-x photocatalysts prepared by the sol–gel method. | ||
| Photocatalyst | k × 10−3 (min−1) | t1/2 (h) |
|---|---|---|
| Al2O3 | 3.4 | 3.36 |
| Ag/Al2O3 | 9.1 | 1.27 |
| Ag/Al–Gd-2 | 3.4 | 39 |
| Ag/Al–Gd-5 | 9.3 | 24 |
| Al–Gd-15 | 9.5 | 1.22 |
| Ag/Al–Gd-15 | 13.8 | 84 |
| Ag/Al–Gd-25 | 14.5 | 80 |
| Ag/Al–Gd-50 | 8.0 | 44 |
| Ag/Gd2O3 | 1.6 | 7.00 |
The kinetics data of 4-ClPh photo-degradation reaction at 3 h of UV light irradiation over Ag/Al–Gd-x photocatalysts were fitted to a pseudo first-order equation using the Langmuir–Hinshelwood model that has been often used to describe the kinetics of photocatalytic reactions of organic compounds in aqueous medium:56,57
| ln(C0/C) = kappt | (1) |
The ln(C0/C) versus reaction time (t) plots are linear (Fig. 12) indicating that photo-degradation kinetics adjusts well to a pseudo first-order equation. With the increase in Gd2O3 concentration in Ag/Al–Gd-x, the photocatalytic activity improved as shown by an increase in the reaction rate constant (k) and a decrease in the half-life time (t1/2) (Table 3). The kinetic studies confirms that Ag/Al–Gd-x photocatalysts with concentrations of 15.0 and 25.0 wt% of Gd2O3 are the materials with the highest efficiency for the elimination of 4-ClPh in aqueous medium as corroborated by their higher reaction rate constants and their lower half-life times in the photocatalysts series (Table 3).
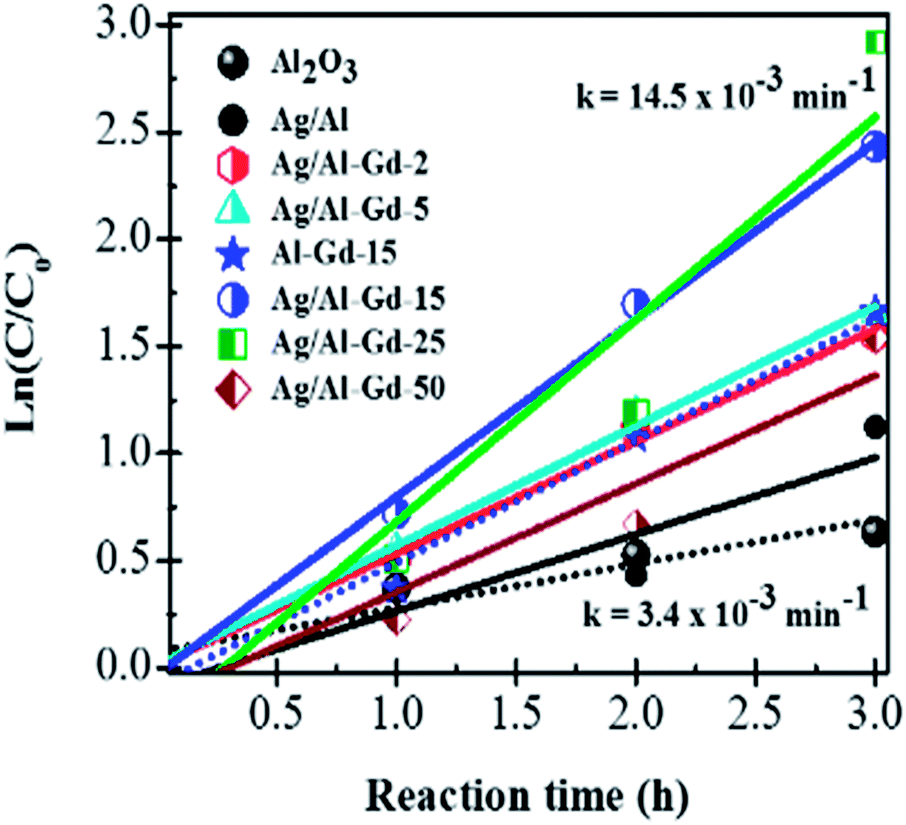 | ||
| Fig. 12 ln(C0/C) vs. reaction time in the photodegradation of 4-chlorophenol after 3 h of UV light irradiation using Ag/Al–Gd-x photocatalysts. | ||
In order to figure out the efficacy of the materials to mineralize dissolved carbon to CO2 during photodegradation of 4-ClPh, it was determined the total organic carbon (TOC) (Fig. 13). A continuous decrease in the relative concentration (C/C0) of organic carbon with the UV light irradiation time was observed indicating the mineralization of dissolved organic carbon to CO2. Ag/Al2O3 mineralized about 32.0% of dissolved carbon after 4 h of UV light irradiation. However, when Ag/Al–Gd-x were used as photocatalysts, the mineralization of dissolved carbon to CO2 increased with Gd2O3 concentration and more than 78.0% of dissolved carbon was mineralized to CO2 using Ag/Al–Gd-x photocatalysts with Gd2O3 concentration higher than 15.0 wt% after 4 h of UV light irradiation.
 | ||
| Fig. 13 Relative concentration of total organic carbon as a function of the UV light irradiation time of 4-chlorophenol solution over Ag/Al–Gd-x photocatalysts. | ||
The identification of residual intermediaries was carried by calculation of the concentration of the possible intermediaries, 1,4-benzoquinone and hydroquinone, at the wavelengths of 245.0 and −283.0 nm respectively as we reported previously for phenol photodegradation using Al2O3–Nd2O3–ZnO composite oxides.58 Fig. S4† shows the UV-Vis spectra of 4-ClPh degradation after 6 h of UV light irradiation using the Ag/Al–Gd-25 photocatalyst. This figure also depicts the possible intermediaries 1,4-benzoquinone and hydroquinone at the wavelength of 245.0 and 283.0 nm respectively. Whereas, Fig. S5† shows the relative concentration (C/Cmax) vs. reaction temperature for a period of 6 h of UV light irradiation. The calculated concentration values of 1,4-benzoquinone, hydroquinone and 4-chlorophenol as a function of the UV light irradiation time are shown in Table S1.† It can be observed that the relative concentration of 4-ClPh decreases nearly to cero after 4 h of UV light irradiation from 6.65 × 10⁻⁴ mol L−1. Whereas, the hydroquinone formed is maximum at 1 h of UV light irradiation with a concentration of 1.61 × 10⁻⁴ mol L−1 and decreases to cero after 4 h of UV light irradiation. The formation of 1,4-benzoquinone was nearly negligible in the photodegradation of 4-ClPh decreasing from 1.20 × 10⁻⁵ mol L−1 to 2.57 × 10⁻⁶ mol L−1 after 4 h of UV light irradiation.
Influence of coupling Ag and Gd2O3 on the improvement in the photocatalytic activity of Ag/Al–Gd-x photocatalysts in the degradation of 4-ClPh
Silver was coupled onto Al2O3–Gd2O3 composite oxides prepared by the sol–gel method giving rise to a high dispersion of metallic silver particles and an intimate contact between species. Nano- and micro-particles of metallic silver or possibly silver quasi-crystals of irregular pentagonal shape intersected by plane nanobelts of Al2O3–Gd2O3 were observed by SEM of the Ag/Al–Gd-25 photocatalyst. Such chemical state might ease the electronic transfer from Al2O3–Gd2O3 composites to metallic silver due to the strong interaction between phases. Thus, the improvement in the photocatalytic activity of silver photocatalysts supported on Al2O3–Gd2O3 composite oxides might depends on the interaction extent between silver particles and Al2O3–Gd2O3 composite oxide as evidenced in the more active Ag/Al–Gd-25 photocatalyst. This is explained because the strong interaction between phases might ease the overlap of their electronic bands. In this sense, the improvement in the photocatalytic activity of Ag/Al–Gd-x photocatalysts would be proportional to the concentration of Gd2O3 in the Al2O3–Gd2O3 composite oxides that is interacting with silver nano- and micro-particles. It is presumable that when Ag/Al–Gd-x photocatalysts are irradiated with UV light, electrons (e−) are excited from the valence band of γ-Al2O3 to the incomplete “4f” orbital of Gd2O3 and to the conduction band of metallic silver particles leaving a positively charged region (h+) in the γ-Al2O3. This assumption is supported because a decrease in the band gap energy of γ-Al2O3 induces a decrease in the position of the Fermi level that can be correlated with an increase in ability of γ-Al2O surface to give electrons.59 In this work, the calculated band gap energy for γ-Al2O3 prepared by the sol–gel method has a value of 3.59 eV which is considerably lower than that reported for insulators materials which is typically above 5.0 eV.60 The decrease in the band gap energy of γ-Al2O3 and thereby its increase in the donor behaviour can cause the modification in its surface chemistry.59 In the γ-Al2O3 prepared by the sol–gel method there is a decrease in its band gap energy implying that there is an increase in the ability of its surface to give electrons (e−) and leaving a high amount of holes (h+) under UV light irradiation. Furthermore, it is known that in Gd2O3, the f-levels appear as resonances within the valence and conduction bands.61 In rare earth oxides such as Gd2O3, the valence band refers to the occupied O p-states, while the conduction band is comprised of mainly “d” character.62 Moreover, it is also proposed that in oxides like γ-Al2O3, the “sp” band of aluminum hybridizes with the “p” orbitals of oxygen giving rise to a hybridized new band.63 The lower part of this new band is the valence band and the upper part is the conduction band, whereas the separation between them is the band gap of γ-Al2O3. Therefore, due to the overlap of electronic bands of different phases for high Gd2O3 concentration in the Ag/Al2O3–Gd2O3 photocatalysts, both Gd2O3 and metallic silver might act as traps of electrons (e−) arriving from the valence band of γ-Al2O3 after excitation with UV light irradiation. Whereas, γ-Al2O3 phase might act as a trap of holes (h+) after excitation with UV light irradiation. Thus, the role of Ag0 and Gd2O3 phases in Ag/Al2O3–Gd2O3 photocatalysts would be to retard the electron–hole pair recombination rates. This assumption is corroborated by fluorescence spectroscopy of Ag/Al–Gd-x photocatalysts. Fig. 14 shows the emission spectra of Ag/Al, Ag/Al–Gd-x and Ag/Gd after excitation with a wavelength of 250.0 nm. Whereas, inset in Fig. 14 shows the emission spectra of Al2O3, Gd2O3 and Al–Gd-x composite oxides. With the exception of the emission spectra of Al–Gd-2, Ag/Al–Gd-2 and pure Gd2O3, the intensity of emission spectra of Al–Gd-x composite oxides and Ag/Al–Gd-x photocatalysts decreased significantly with respect to that of bare Al2O3, Gd2O3 and Ag/Al2O3 respectively implying that the recombination rate of electron–hole pairs is effectively decreased by adding Gd2O3 to Al2O3 and by depositing silver onto Al–Gd-x composite oxides to obtain Ag/Al–Gd-x photocatalysts. It is observed that Ag/Al–Gd-25 and Ag/Al–Gd-50 have the lower intensity of the emission spectra, being lower even than that of bare Ag/Gd2O3. This fact indicates that the recombination rate of photo-induced electron charge was highly inhibited in the Ag/Al–Gd-x photocatalysts with high concentration of Gd2O3 (x > 15 wt%) and confirms that the strong interaction between silver particles and Al2O3–Gd2O3 composite oxides favors the separation of photo-induced charge (e− and h+). The improvement in the photocatalytic activity of Ag/Al–Gd-x photocatalysts compared to those of bare Ag/Al2O3 or pure Al2O3 and Gd2O3 could be also explained if we consider these materials prepared by the sol–gel method as co-catalysts where there is a synergetic effect of spatial transfer of photogenerated charges as reported recently by some authors for silver co-catalysts.64–66 In this sense, Al2O3 might work as a hole co-catalyst, whereas Ag and Gd2O3 might function as electron co-catalysts providing the reaction sites for the photodegradation of 4-ClPh molecules. Other interesting property of Ag/Al–Gd-x photocatalysts with high concentration of Gd2O3 (≥25.0 wt%) is that their UV-Vis spectra (Fig. 6) shows absorption bands attributed to surface plasmon resonance of metallic silver nanoparticles. In this sense, the separation of photo-induced charge (e− and h+) arisen from the interaction between metallic silver nanoparticles and Al2O3–Gd2O3 composite oxides could be linked to surface plasmon and charge transfer states of metallic silver particles as suggested also from the XPS spectrum of Ag/Al–Gd-25 photocatalyst (Fig. 7B). This observation also confirms that nano- and micro-particles of Ag0 and Gd2O3 act as electron tramps favoring the decrease in the recombination rate of electron–hole pairs. In this sense, under UV light irradiation of Ag/Al–Gd-x photocatalysts, photo-excited electrons (e−) would be caught by metallic silver and Gd2O3, whereas holes (h+) would be captured by γ-Al2O3 in a similar process as that reported for plasmonic photocatalysis.67 As result of photo-induced charges separation, the photo-excited electrons and holes would migrate to the Ag/Al–Gd-x photocatalyst surface to initiate the photodegradation reaction of ClPh molecules. Furthermore, the amount of surface OH− groups decreased with the increase in the concentration of Gd2O3 in the materials as inferred from the FTIR spectra of Ag/Al–Gd-x photocatalysts (Fig. 9). This fact suggests, that Ag/Al–Gd-x photocatalysts with high concentration of Gd2O3 might also contain a high density of surface anion vacancies and consequently a higher capability to adsorb OH− groups during photoreaction, therefore increasing the photocatalytic activity of the materials in the photodegradation of 4-ClPh in aqueous medium.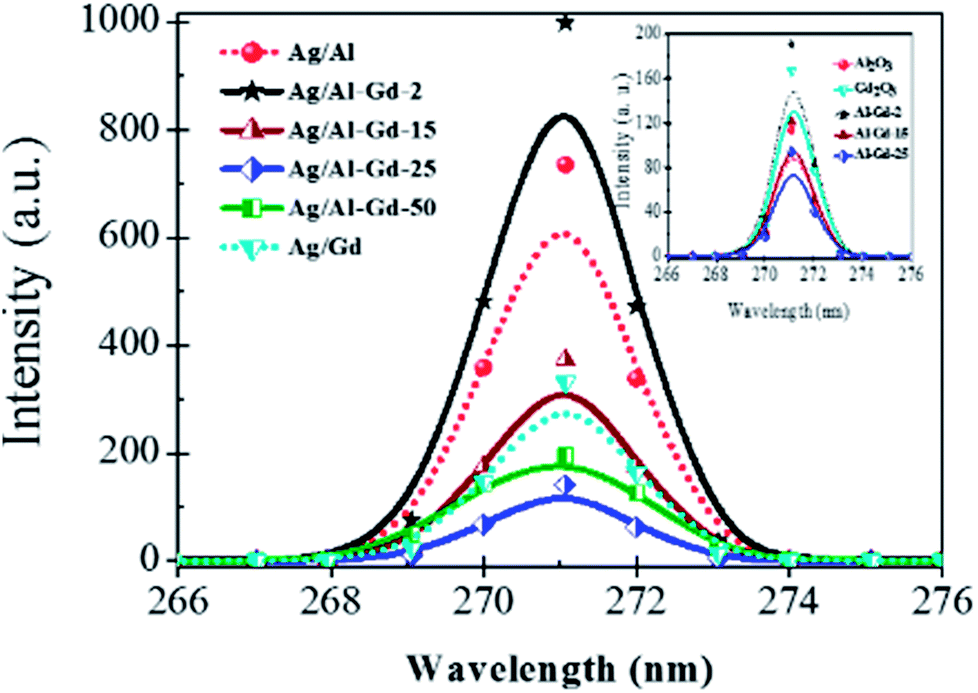 | ||
| Fig. 14 Fluorescence spectra of Ag/Al–Gd-x photocatalysts prepared by the sol–gel method. | ||
Conclusions
The photocatalytic activity in the degradation of 4-chlorophenol with UV-ligh irradiation using 2.0 wt% Ag/Al2O3–Gd2O3 photocatalysts prepared by the sol–gel method was studied. Bare Ag/γ-Al2O3 exhibited high photocatalytic activity, photoconverting about 67.0% of 4-chlorophenol after 4 h of UV light irradiation. However, the photocatalytic activity of Ag/Al2O3 was improved with addition of Gd2O3 to γ-Al2O3 by the sol–gel method to obtain Ag/Al2O3–Gd2O3 photocatalysts. Ag/Al–Gd-x with 15.0 and 25.0 wt% of Gd2O3 were the photocatalysts with the highest efficacy to photodegradate 4-chlorophenol photoconverting about 90.0% of 4-chlorophenol and mineralizing more than 85.0% of dissolved organic carbon after 4 h of UV light irradiation. Ag/Al2O3–Gd2O3 photocatalysts with high concentration of Gd2O3 (≥15.0 wt%) favors the decrease in the recombination rate of photo-induced charges (e− and h+) due to that the strong interaction between silver nanoparticles and microparticles and Al2O3–Gd2O3 composite oxide supports induces the separation of charges. The role of silver and Gd2O3 in the Ag/Al2O3–Gd2O3 photocatalysts is to act as electron tramps favoring the decrease in the recombination rate of photo-induced electron–hole pairs.Conflicts of interest
The authors declare no competing financial interest.Acknowledgements
This work was partially supported by grants from COECYTJAL (Project: PS-09-2009-732), CONACYT (Project: 119058) and PROSNI. J. E. Casillas is indebted to CONACYT for granting a scholarship (CONACYT scholar No. 287873).Notes and references
- M. T. Pinho, H. T. Gomes, R. S. Ribeiro, J. L. Faria and A. M. Silva, Appl. Catal., B, 2015, 165, 706–714 CrossRef CAS.
- E. Saputra, S. Muhammad, H. Sun, H. M. Ang, M. O. Tadé and S. Wang, Appl. Catal., B, 2013, 142–143, 729–735 CrossRef CAS.
- L. Qi, H. You, Z. Zhang, S. Feng and S. S. van Agtmaal, Int. J. Electrochem. Sci., 2013, 8, 5457–5468 CAS.
- M. F. Almeida, C. R. Bellato, A. H. Mounteer, S. O. Ferreira, J. L. Milagres and L. D. L. Miranda, Appl. Surf. Sci., 2015, 357, 1765–1775 CrossRef.
- J. J. Murcia, M. C. Hidalgo, J. A. Navío, J. Araña and J. M. Doña-Rodríguez, Appl. Catal., B, 2015, 179, 305–312 CrossRef CAS.
- S. H. Lin, C. H. Chiou, C. K. Chang and R. S. Juang, J. Environ. Econ. Manag, 2011, 92, 3098–3104 CAS.
- Y. Hu, D. Li, F. Sun, Y. Weng, S. You and Y. Shao, J. Hazard. Mater., 2016, 301, 362–370 CrossRef CAS PubMed.
- A. Mantilla, G. Jacome-Acatitla, G. Morales-Mendoza, F. Tzompantzi and R. Gomez, Ind. Eng. Chem. Res., 2011, 50, 2763–2768 CrossRef.
- G. Mendoza-Damián, F. Tzompantzi, A. Mantilla, A. Barrera and L. Lartundo-Rojas, J. Hazard. Mater., 2013, 263, 67–72 CrossRef PubMed.
- F. Tzompantzi, Y. Piña, A. Mantilla, O. Aguilar-Martinez, F. Galindo-Hernández, X. Bokhimi and A. Barrera, Catal. Today, 2014, 220–222, 49–55 CrossRef CAS.
- A. Barrera, F. Tzompantzi, V. Lara and R. Gómez, J. Photochem. Photobiol., A, 2012, 227, 45–50 CrossRef CAS.
- A. Barrera, F. Tzompantzi, J. M. Padilla, J. E. Casillas, G. Jácome-Acatitla, M. E. Cano and R. Gómez, Appl. Catal., B, 2014, 144, 362–368 CrossRef.
- P. D. Cozzoli, R. Comparelli, E. Fanizza, M. L. Curri, A. Agostiano and D. Laub, J. Am. Chem. Soc., 2004, 126, 3868–3879 CrossRef CAS PubMed.
- P. V. Kamat, M. Flumiani and A. Dawson, Colloids Surf., A, 2002, 202, 269–279 CrossRef CAS.
- V. Subramanian, E. Wolf and P. V. Kamat, Langmuir, 2003, 19, 469–474 CrossRef CAS.
- A. Dawson and P. V. Kamat, J. Phys. Chem. B, 2001, 105(5), 960–966 CrossRef CAS.
- A. Wood, M. Giersig and P. Mulvaney, J. Phys. Chem. B, 2001, 105, 8810–8815 CrossRef CAS.
- V. Subramanian, E. E. Wolf and P. V. Kamat, J. Phys. Chem. B, 2003, 107(30), 7479–7485 CrossRef CAS.
- M. Jakob, H. Levanon and P. V. Kamat, Nano Lett., 2003, 3, 353–358 CrossRef CAS.
- H. Haick and Y. Paz, J. Phys. Chem. B, 2003, 107, 2319–2326 CrossRef CAS.
- Z. Zhang, C. C. Wang, R. Zakaria and J. Y. Ying, J. Phys. Chem. B, 1998, 102, 10871 CrossRef CAS.
- H. Kominami, S. Muratami, J. Kato, Y. Kera and B. Ohtani, J. Phys. Chem. B, 2002, 106(40), 10501–10507 CrossRef CAS.
- A. Roucoux, J. Schlz and H. Patin, Chem. Rev., 2002, 102, 3757–3778 CrossRef CAS PubMed.
- A. Szucs, F. Berger and I. Dekany, Colloids Surf., A, 2000, 174, 387–402 CrossRef CAS.
- S. K. Ghosh, S. Kundu, M. Mandal and T. Pal, Langmuir, 2002, 18(23), 8756–8760 CrossRef CAS.
- L. Gang, B. G. Anderson, J. Grondelle, J. van Grondelle and R. A. van Santen, Appl. Catal., B, 2002, 40, 101–110 CrossRef.
- R. M. Dickson and L. A. Lyon, J. Phys. Chem. B, 2000, 104(26), 6095–6098 CrossRef CAS.
- Y. Sun and Y. Xia, Science, 2002, 298, 2176–2179 CrossRef CAS PubMed.
- R. C. Jin, Y. W. Cao, C. A. Mirkin, K. L. Kelly, G. C. Schatz and J. G. Zheng, Science, 2001, 294, 1901–1903 CrossRef CAS PubMed.
- R. Jin, Y. C. Cao, E. Hao, G. Metraux, G. C. Schatz and C. A. Mirkin, Nature, 2003, 425, 487–490 CrossRef CAS PubMed.
- M. I. Ghouri, E. Ahmed, N. R. Khalid, M. Ahmad, M. Ramzan, A. Shakoor and N. A. Niaz, J. Ovonic Res., 2014, 10(3), 89–100 CAS.
- Y. B. Losovyj, D. Wooten, J. C. Santana, J. M. An, K. D. Belashchenko, N. Lozova, J. Petrosky, A. Sokolov, J. Tang, W. Wang, N. Arulsamy and P. A. Dowben, J. Phys.: Condens. Matter, 2009, 21, 045602 CrossRef PubMed.
- H. Guo, X. Yang, T. Xiao, W. Zhang, L. Lou and J. Mugnier, Appl. Surf. Sci., 2004, 230, 215–221 CrossRef CAS.
- S. Lowell, J. E. Shields and M. A. Thomas, in, Characterization of Porous Solids and Powders: Surface Area, Pore Size and Density, ed. M. Thommes, Springer, Netherlands, 2004, pp. 31–32 Search PubMed.
- K. W. S. Sing, D. H. Everet, R. A. W. Haul, L. Moscou, R. A. Pierotti, J. Rouquerol and T. Siemieniewska, Pure Appl. Chem., 1985, 57, 603–619 CrossRef CAS.
- G. Pérez, S. Fuentes, V. Petranovskii and A. Simakov, Catal. Lett., 2006, 110, 53–60 CrossRef.
- S. Hazarika, N. Paul and D. Mohanta, Bull. Mater. Sci., 2014, 37(4), 789–796 CrossRef CAS.
- C. Hu, T. Peng, X. Hu, Y. Nie, X. Zhou, J. Qu and H. He, J. Am. Chem. Soc., 2010, 132(2), 857–862 CrossRef CAS PubMed.
- N. Bogdanchikova, F. C. Meunier, M. Avalos-Borja, J. P. Breen and A. Pestryakov, Appl. Catal., B, 2002, 36, 287–297 CrossRef CAS.
- Z. Li and M. F. Stephanopoulos, J. Catal., 1999, 182(2), 313–327 CrossRef CAS.
- C. Hu, T. Peng, X. Hu, Y. Nie, X. Zhou, J. Qu and H. He, J. Am. Chem. Soc., 2010, 132, 857–862 CrossRef CAS PubMed.
- A. Barrie and N. E. Christensen, Phys. Rev. B: Condens. Matter Mater. Phys., 1976, 14(6), 2442–2447 CrossRef CAS.
- N. Bowering, D. Croston, P. G. Harrisson and G. S. Walker, Int. J. Photoenergy, 2007, 1–8 CrossRef.
- B. V. Crist, Handbook of Monochromatic XPS Spectra, Commercially Pure Binary Oxides, XPS International Inc., 1999, vol. 2, pp. 37–42 Search PubMed.
- C. D. Wagner, W. M. Riggs, L. E. Davis, J. F. Moulder and G. E. Muilendberg, Handbook of X-ray photoelectron spectroscopy, Perkin Elmer, Eden Prairie, 1992 Search PubMed.
- A. T. M. A. Rahman, K. Vasilev and P. Majewski, J. Colloid Interface Sci., 2011, 354, 592–596 CrossRef PubMed.
- D. D. Sarma and C. N. R. Rao, J. Electron Spectrosc. Relat. Phenom., 1980, 20, 25–45 CrossRef CAS.
- B. Zhang, H. Jin, Y. Li, B. Chen, S. Liu and D. Shi, J. Mater. Chem., 2012, 22, 14494–14501 RSC.
- C. Solis, J. Rivera, C. J. Lucio-Ortiz, A. Hernández-Ramírez, F. Castillón and J. Sánchez-Valente, Materials, 2014, 7, 2062–2086 CrossRef PubMed.
- J. Kloprogge, L. V. Theo, L. V. Duong, B. J. Wood and R. L. Frost, J. Colloid Interface Sci., 2006, 296(2), 572–576 CrossRef CAS PubMed.
- P. Dufresne, E. Payen, J. Grimblot and J. P. Bonnelle, J. Phys. Chem., 1981, 85, 2344–2351 CrossRef CAS.
- T. L. Barr, J. Phys. Chem., 1978, 82(16), 1801–1810 CrossRef CAS.
- B. Strohmeier, Surf. Sci. Spectra, 1995, 3(2), 135–140 CrossRef.
- A. Nylund and I. Olefjord, Surf. Sci. Spectra, 1994, 22, 283–289 Search PubMed.
- J. R. Lindsay, H. J. Rose, W. E. Swartz, P. H. Watts and K. A. Rayburn, Appl. Spectrosc., 1973, 27, 1–4 CrossRef CAS.
- A. Sobczynski, Ł. Duczmal and W. Zmudzinski, J. Mol. Catal. A: Chem., 2004, 213, 225–230 CrossRef CAS.
- K. Porkodi and K. V. Kumar, Appl. Catal., B, 2008, 79, 108–109 CrossRef CAS.
- J. E. Casillas, F. Tzompantzi, S. G. Castellanos, G. Mendoza-Damián, R. Pérez-Hernández, A. López-Gaona and A. Barrera, Appl. Catal., B, 2017, 208, 161–170 CrossRef CAS.
- B. Ealet, M. H. Elyakhloufi, E. Gillet and M. Ricci, Thin Solid Films, 1994, 250, 92–100 CrossRef CAS.
- B. Shin, J. R. Weber, R. D. Long, P. K. Hurley, C. G. Van de Walle and P. C. MacIntyre, Appl. Phys. Lett., 2010, 96(15), 152908 CrossRef.
- G. Scarel, A. Svane and M. Fanciulli, Scientific and Technological Issues Related to Rare Earth Oxides, Rare Earth Oxide Thin Films: Growth, Characterization, and Applications, ed. G. Scarel and M. Fanciulli. Topics in Appl. Phys., vol. 106, Springer-Verlag GmbH, Heidelberg, Germany, 2007 Search PubMed.
- H. B. Lal and K. Gaur, J. Mater. Sci., 1988, 23(3), 919–923 CrossRef CAS.
- M. Kefi, P. Jonnard, F. Vergand, C. Bonnelle and E. Gillet, J. Phys.: Condens. Matter, 1993, 5(45), 8629–8642 CrossRef CAS.
- X. Wang, T. Li, R. Yu, H. Yu and J. Yu, J. Mater. Chem. A, 2016, 4, 8682–8689 CAS.
- H. Yu, R. Liu, X. Wang, P. Wang and J. Yu, Appl. Catal., B, 2012, 111, 326–333 CrossRef.
- R. Liu, P. Wang, X. Wang, H. Yu and J. Yu, J. Phys. Chem. C, 2012, 116, 17721–17728 CAS.
- X. Zhang, Y. L. Chen, R. S. Liu and D. P. Tsai, Rep. Prog. Phys., 2013, 76, 046401–046441 CrossRef PubMed.
Footnote |
| † Electronic supplementary information (ESI) available: Additional UV-Vis, XPS, Eg, photolysis, intermediates concentration data. See DOI: 10.1039/c7ra12665d |
| This journal is © The Royal Society of Chemistry 2018 |