
 Open Access Article
 This Open Access Article is licensed under a Creative Commons Attribution-Non Commercial 3.0 Unported Licence
Enhanced electrochemical properties of cerium metal–organic framework based composite electrodes for high-performance supercapacitor application†
Rajendran Ramachandranab,
Wenlu Xuana,
Changhui Zhaoab,
Xiaohui Lengab,
Dazhi Sunc,
Dan Luoa and
Fei Wang *abd
*abd
aDepartment of Electronic and Electrical Engineering, Southern University of Science and Technology, Shenzhen 518055, China. E-mail: wangf@sustc.edu.cn
bShenzhen Key Laboratory of 3rd Generation Semiconductor Devices, Shenzhen 518055, China
cDepartment of Materials Science and Engineering, Southern University of Science and Technology, Shenzhen 518055, China
dState Key Laboratories of Transducer Technology, Shanghai Institute of Microsystem and Information Technology, Chinese Academy of Sciences, Shanghai 200050, China
First published on 17th January 2018
Abstract
Cerium metal–organic framework based composites (Ce-MOF/GO and Ce-MOF/CNT) were synthesized by a wet chemical route and characterized with different techniques to characterize their crystal nature, morphology, functional groups, and porosity. The obtained Ce-MOF in the composites exhibit a nanorod structure with a size of ∼150 nm. The electrochemical performance of the composites was investigated in 3 M KOH and 3 M KOH + 0.2 M K3Fe(CN)6 electrolytes. Enhanced electrochemical behavior was obtained for the Ce-MOF/GO composite in both electrolytes and exhibited a maximum specific capacitance of 2221.2 F g−1 with an energy density of 111.05 W h kg−1 at a current density of 1 A g−1. The large mesoporous structure and the presence of oxygen functional groups in Ce-MOF/GO could facilitate ion transport in the electrode/electrolyte interface, and the results suggested that the Ce-MOF/GO composite could be used as a high-performance supercapacitor electrode material.
Introduction
Electrochemical capacitors or supercapacitors are a type of energy storage device which could combine the benefits of the high specific power of conventional capacitors and the high specific energy of rechargeable batteries. The significant features of the supercapacitors are the ability to charge/discharge quickly with high energy and power density, and long cycle life.1–3 According to the mechanism of charge storage, supercapacitors can be categorized into electric double layer capacitors (EDLCs) and pseudocapacitors.4 Usually, pseudocapacitance originates from the fast faradic redox reactions of transition metal oxides, sulfides and conducting polymers,5–8 while EDLCs are the result of non-faradic charge accumulation at carbon based electrode/electrolyte interfaces.9,10 Currently, a majority of commercial supercapacitors are assembled from hybrid electrodes by combining pseudocapacitive materials with carbonaceous materials.11 The synergistic effects of these hybrid electrodes not only have the advantage of the high conductivity and flexibility of carbon materials but also can efficiently utilize the high specific capacitance of the pseudocapacitive elements, thus improving the electrochemical properties.12,13 Therefore it is well recognized that the electrode material is essential when it comes to determining the performance of supercapacitors.Very recently, metal–organic frameworks (MOFs), as a unique class of energy storage materials, have continuously drawn great interest in the investigation of supercapacitor electrodes due to their large specific surface area, controllable microporous structure and tunable pore size, and incorporated redox metal centers.14,15 MOFs have been employed to supercapacitor electrodes in two ways. First, it could be used directly as an electrode material; and secondly, MOFs derived materials such as metal oxides, nanoporous carbon and their composite materials can be developed.16–18 Furthermore, when directly used as electrode materials depending on incorporating pseudocapacitive redox centers, the bare MOFs can allow more active sites and facilitate faster ion transport between electrode and electrolyte.19 Up to date, several MOF and MOF derived materials have been studied for supercapacitor applications, such as Co20, Zn21, Ni22, Cd23, Mn24 and bimetallic like Co/Zn25, etc. However, the lousy electrolyte flexibility of MOFs and MOFs derived materials may cause the poor stability during charge/discharge process, which has been considered as a major constraint in supercapacitors.26 Fortunately, MOF with carbon materials like graphene, graphene oxide and CNT could increase the electrochemical performance for supercapacitors; and therefore, the research direction has been turned to making MOF/carbon composites.27–29 Recently, Wen et al., have reported Ni-MOF/CNT composite for supercapacitor applications with the energy density of 36.6 W h kg−1.30 Saraf et al.,31 have studied the electrochemical properties of Cu-MOF with rGO and reported that the addition of rGO remarkably enhanced the capacitance behavior of Cu-MOF with great cyclic stability. The MOF/carbon material combinations not only facilitated the utilization of the active sites during the electrochemical performance but also enhanced the mechanical strength and electrical conductivity synergistically.
Utilization of some redox additives in the electrolyte is another approach to enhance the specific capacitance of electrode materials. The capacitance can increase via redox reactions of the additives between the electrode and electrolyte interfaces. Up to date, there are several types of redox additives like hydroquinone,32 iodide,33 m-phenylenediamine,34 K3Fe(CN)6 (ref. 35) and recently redox-additive polymers36 have been reported for supercapacitor applications. The effect of the migration of redox species between electrode and electrolyte interfaces is the primary characteristic to improve the pseudocapacitance and cyclic stability. Among various redox additives, K3Fe(CN)6 has been identified as an excellent choice because its different oxidation/reduction states can facilitate multiple redox activities during electrochemical process. Besides, the redox pair of Fe(CN)63−/Fe(CN)64− can decrease the charge transfer resistance of KOH electrolyte which allows fast electron transportation.37
In this paper, we have proposed a room temperature wet chemical synthesis of Ce-MOF/GO and Ce-MOF/CNT composites, and have investigated their electrochemical properties in 3 M KOH and 3 M KOH + 0.2 M K3Fe(CN)6 electrolytes. It has been observed that the presence of GO in Ce-MOF could remarkably improve the specific capacitance and energy density of Ce-MOF rather than CNT. The obtained Ce-MOF/GO composite exhibits a maximum specific capacitance of 233.8 and 2221.1 F g−1 in 3 M KOH and 3 M KOH + 0.2 M K3Fe(CN)6 electrolytes, respectively. This fact is due to the pseudocapacitance contribution of oxygen functional groups in GO.
Experiment method
Materials
Ceirum(II) nitrate hexahydrate (Ce(NO3)2·6H2O), 1,3,5-tricarboxylic acid (H3BTC), ethyl alcohol, potassium hydroxide (KOH), potassium hexacyanoferrate(III) (K3[Fe(CN)6]) were purchased from Sigma-Aldrich. Graphene oxide and carbon nanotube were purchased commercially from XFNANO, China. All the solutions were prepared using Milli-Q water (pH 7.2)Synthesis of Ce-MOF, Ce-MOF/GO and Ce-MOF/CNT
The Ce-MOF based composites were prepared with little alteration of literature.38 In a typical process, 0.5 mM of H3BTC was dissolved in 20 ml of water/ethanol mixture (3![[thin space (1/6-em)]](https://www.rsc.org/images/entities/char_2009.gif) :1 v/v), and 5 wt% of graphene oxide was added into the above solution and sonicated for 30 min. Finally, 2 mM of (Ce(NO3)2·6H2O) in 20 ml of water/ethanol mixture (3:1 v/v) was added and continued stirring for 30 min. Then, the solution was stabilized in a beaker for a whole night, and the final precipitate was washed several times with ethanol and dried at 80 °C in the vacuum oven for 12 h. The resultant MOF was named as Ce-MOF/GO. Ce-MOF/CNT and pure Ce-MOF were also prepared with and without CNT, respectively.
:1 v/v), and 5 wt% of graphene oxide was added into the above solution and sonicated for 30 min. Finally, 2 mM of (Ce(NO3)2·6H2O) in 20 ml of water/ethanol mixture (3:1 v/v) was added and continued stirring for 30 min. Then, the solution was stabilized in a beaker for a whole night, and the final precipitate was washed several times with ethanol and dried at 80 °C in the vacuum oven for 12 h. The resultant MOF was named as Ce-MOF/GO. Ce-MOF/CNT and pure Ce-MOF were also prepared with and without CNT, respectively.
Materials characterization
X-ray diffraction system (Rigaku Smartlab) was used with Cu-Kα radiation (λ = 1.540 Å). Step scanning was done with 2θ intervals from 6° to 55°. The surface morphologies of the samples were characterized by using scanning electron microscope (Zeiss Merlin) and transmission electron microscope (Tecnai F30). The N2 isotherm of the samples was measured using by BET ASAP 2020.Electrochemical measurements
All the electrochemical measurements were carried out in an electrochemical analyzer (CHI 660 E work station). The potentials were measured concerning Ag/AgCl (sat.KCl) as the reference. Ni foam (purchased from Cabot, USA) and Pt wire were used as the working and counter electrode respectively. The cyclic voltammetry was conducted at various scan rates in the potential range from 0 to 0.5 V. The working electrode was made as follows: in brief, a known amount of active material was dispersed in 5 weight% of Nafion and ethanol mixture. The total surface area coated with active material was 1 × 1 cm2. The mass of the active material of electrode was 2 mg cm−2. Then, the electrode was dried at 80 °C for 12 h. Then the electrodes were immersed in KOH electrolyte for 6 h. Cyclic voltammetry (CV), galvanostatic charge–discharge (GCD) and electrochemical impedance spectroscopy (EIS) studies were carried out in 3 M KOH and 3 M KOH + 0.2 M K3Fe(CN)6 electrolyte solutions under ambient conditions. ECLab software was used for fitting the EIS spectrum.Results and discussion
The crystallinity and phase purity of as prepared Ce-MOF, Ce-MOF/CNT, and Ce-MOF/GO samples were investigated using a powder X-ray diffraction. From the Fig. 1(a), all the diffraction peaks of Ce-MOF are sharp and clear, which confirms that the prepared MOFs have excellent crystallinity. All the diffraction peaks were in good agreement with the XRD pattern of previous reports in the literature.38,39 Moreover, no peaks associated with any impurity ions were recognized implying that the high phase purity. Furthermore, the diffraction peaks of Ce-MOF/CNT and Ce-MOF/GO shows the Ce-MOF characteristic only, suggesting that the CNT and GO has not affected the crystal structure of the Ce-MOF. | ||
| Fig. 1 (a) XRD patterns of Ce-MOF composites (b) FTIR spectrum of (i) Ce-MOF (ii) Ce-MOF/CNT and (iii) Ce-MOF/GO composite (c) nitrogen adsorption–desorption isotherms of Ce-MOF composites and (d) Barrett–Joyner–Halenda (BJH) pore size distribution curves Ce-MOF composites. | ||
The functional groups of Ce-MOF and its composites are shown in Fig. 1(b). The broader peak from 3300–3400 cm−1 was attributed to the stretching vibrations of OH−, which validates that the physically bonded water molecules in MOF during the deprotonation of the solvent.40 It is observed that the strong bands appear in the region of 1611–1553 cm−1 and 1432–1369 cm−1 which were assigned to the stretching vibrations νas(–COO−) and νs(–COO−) of the carbonate ions. The peak at 532 cm−1 indicates that the stretching vibration of Ce–O.41 It could be seen that the same characteristic bands of Ce-MOF appeared in Ce-MOF/GO and Ce-MOF/CNT composites, which suggests that the Ce-MOF has been grafted on the surface of CNT and GO. A similar report has been proposed previously.42 To know about the presence of oxygen functional groups in GO, FTIR investigation has been done for bare GO, and the spectrum is shown in Fig. S1.† The strong bands at 1725 and 1624 cm−1 corresponds to C![[double bond, length as m-dash]](https://www.rsc.org/images/entities/char_e001.gif) O stretching vibration and CC stretching mode of COOH groups in GO. There are two weak bands at 1055 and 1217 cm−1, which attributed to the C–O bending and C–O stretching vibrations in GO.43
O stretching vibration and CC stretching mode of COOH groups in GO. There are two weak bands at 1055 and 1217 cm−1, which attributed to the C–O bending and C–O stretching vibrations in GO.43
Brunauer–Emmett–Teller (BET) adsorption/desorption measurements were conducted to investigate the specific surface area and the pore size distribution of the samples. The N2 adsorption isotherms (Fig. 1(c)) are a typical IV-type curve with a distinct hysteresis loop in the range of 0.8–1.0 P/Po, indicating the occurrence of mesoporous and macroporous structures.44 The BET surface area is measured to be 7.10, 22.86 and 18.83 m2 g−1 for Ce-MOF, Ce-MOF/CNT and Ce-MOF/GO, respectively. The results were further confirmed with Barrett–Joyner–Halenda (BJH) pore size distribution curves which are shown in Fig. 1(d). The BJH curves show peaks centered at around 3.8 nm, which suggests the existence of mesoporous structure in Ce-MOF. The intensity of the centered differential pore volume peak of Ce-MOF/GO is higher than that of other samples, exhibiting an improvement of mesoporous structure. Besides, the other peak of all the samples centered at ∼30 nm indicates the larger pore structure, which mainly comes from voids between the nanorods.45 The small intensity peak of Ce-MOF indicates that the aggregation of nanorods might reduce the voids, surface area and leads to weak electrochemical performance. Though the BET surface area of Ce-MOF/GO is smaller than Ce-MOF/CNT, the large mesoporous structure and the presence of the oxygen functional groups in GO can promote the electron transfer at the electrode/electrolyte interface, thus increase the electrochemical performance.
The morphology of the as-prepared samples was identified with SEM analysis. Fig. 2 shows the SEM images of Ce-MOF/GO and Ce-MOF/CNT. As evidenced from the SEM images, the obtained Ce-MOFs in GO and CNT are uniform sized nanorod structure with diameters of ∼150 nm and lengths of a few micrometer. It could be observed that some of CNT's in Ce-MOF/CNT (Fig. 2(b)) aggregated due to van der Waal's force of interactions.46 The EDS spectrum confirms the presence of Ce, C and O (Fig. 2(c) and (f)), and the mapping images (Fig. S2 and S3†) shows the atomic distribution of Ce, C and O in Ce-MOF composites. From Fig. 2(d) and (e), the Ce-MOF nanorods were deposited on the surface of graphene oxide sheets, and these results were further confirmed with TEM analysis. The wrinkle graphene oxide sheets were decorated by the Ce-MOF nanorods with uniform size (Fig. 3). The deposited nanorods can also act as the spacer and avoid the restacking of GO sheets. On the other hand, the GO sheets can help to prevent the Ce-MOF nanorods from the aggregation. Both SEM and TEM measurements have showed the high aggregation of CNT as well as nanorods of Ce-MOF in Ce-MOF/CNT sample. The Ce-MOFs nanorods in Ce-MOF/GO composite are anchored strongly onto the GO sheets with no sign of aggregation. This result shows that there is a strong interaction between the GO sheet and the Ce-MOF nanorods, which will facilitate electron transport through graphene oxide sheets to Ce-MOF nanorods and thereby enhance the electrochemical performance.
 | ||
| Fig. 2 (a, b) SEM images of Ce-MOF/CNT composite, (c) EDS spectrum of Ce-MOF/CNT (d, e) SEM images of Ce-MOF/GO composite; (f) EDS spectrum of Ce-MOF/GO. | ||
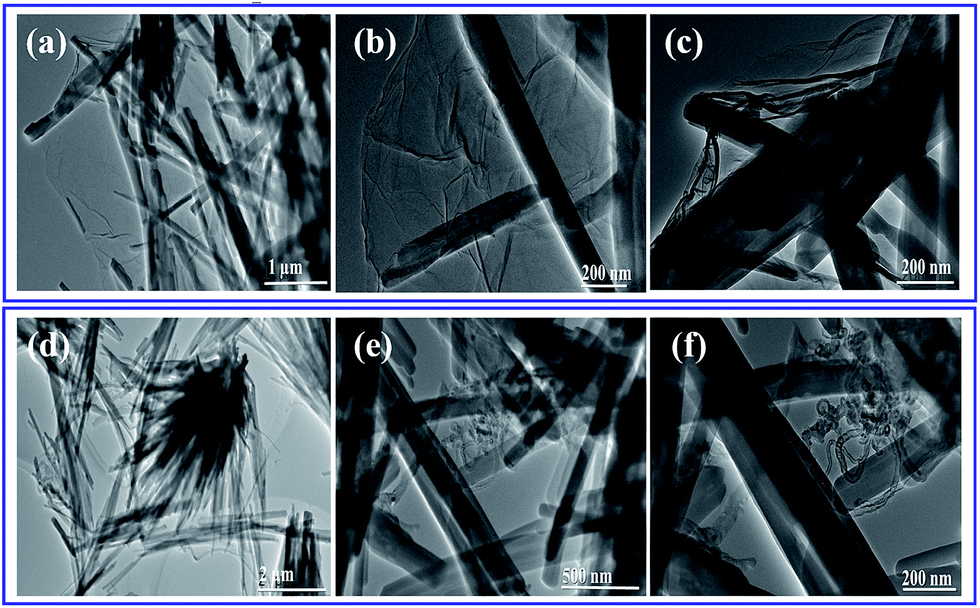 | ||
| Fig. 3 TEM images of (a–c) Ce-MOF/GO and (d–f) Ce-MOF/CNT composites. | ||
To estimate the supercapacitive behavior of the prepared electrodes, cyclic voltammetry (CV), galvanostatic charge–discharge (GCD) and electrochemical impedance spectroscopy (EIS) were examined. Fig. 4 shows the cyclic voltammetry behavior of Ce-MOF and Ce-MOF composites in 3 M KOH, and 3 M KOH + 0.2 M K3Fe(CN)6 electrolytes at different scan rates. A pair of redox peaks were discerned in the CV curves of all electrode, which reveals that the pseudocapacitive behavior emerged from the surface redox reactions.47 The sharp and well redox peaks of Ce-MOF can be directly attributed to the faradic reactions of the different oxidation states of Ce and the process can be described by the following equations. A similar process was proposed to explain the redox reaction of Co-MOF.48
| Ce(II)s + OH− ↔ Ce(II)s(OH)ad + e−1 | (1) |
| Ce(II)s(OH)ad ↔ Ce(III)s(OH)ad + e−1 | (2) |
 | ||
| Fig. 4 (a) Cyclic voltammetry response in 3 M KOH electrolyte (i) Ce-MOF (ii) Ce-MOF/CNT (iii) Ce-MOF/GO composites. (b) Cyclic voltammetry response in 3 M KOH + 0.2 M K3(Fe(CN)6) electrolyte (i) Ce-MOF (ii) Ce-MOF/CNT (iii) Ce-MOF/GO composites. | ||
The broad redox peaks and the high current response of CV curves in 3 M KOH + 0.2 M K3Fe(CN)6 electrolyte suggested more capacitive behavior of the electrodes. This fact can be attributed to the faradic redox reaction of Fe(CN)6 when redox additive was added to KOH and the possible mechanism is shown as follows,49
| [Fe(CN)6]3− + e− ↔ [Fe(CN)6]4− | (3) |
The integral area of the CV curve reflects the amount of real capacitance behavior of the electrodes.50 The large area and current of CV curves in 3 M KOH + 0.2 M K3Fe(CN)6 electrolyte, which indicates that the [Fe(CN)6]3−/[Fe(CN)6]4− redox couple directly gives an additional pseudo capacitance contributions to the electrodes. Hence the electrodes exhibited more capacitive behavior.
The galvanostatic charge and discharge (GCD) study is the most direct strategy to characterize the performance of the electrode materials for supercapacitors. Fig. 5(a)–(d) and 6(a)–(d) shows the charge–discharge curves of the electrodes at different current densities in 3 M KOH and 3 M KOH + 0.2 M K3Fe(CN)6 electrolyte, respectively. It can be seen that charge–discharge curves of all the electrodes are non-triangle shape and exhibit plateaus at a potential of ∼0.2 V in the discharge curves, indicating the existence of pseudo capacitance behavior51 due to the faradic redox reaction of Ce2+/Ce3+ with OH−, which is also consistent with the CV measurements.
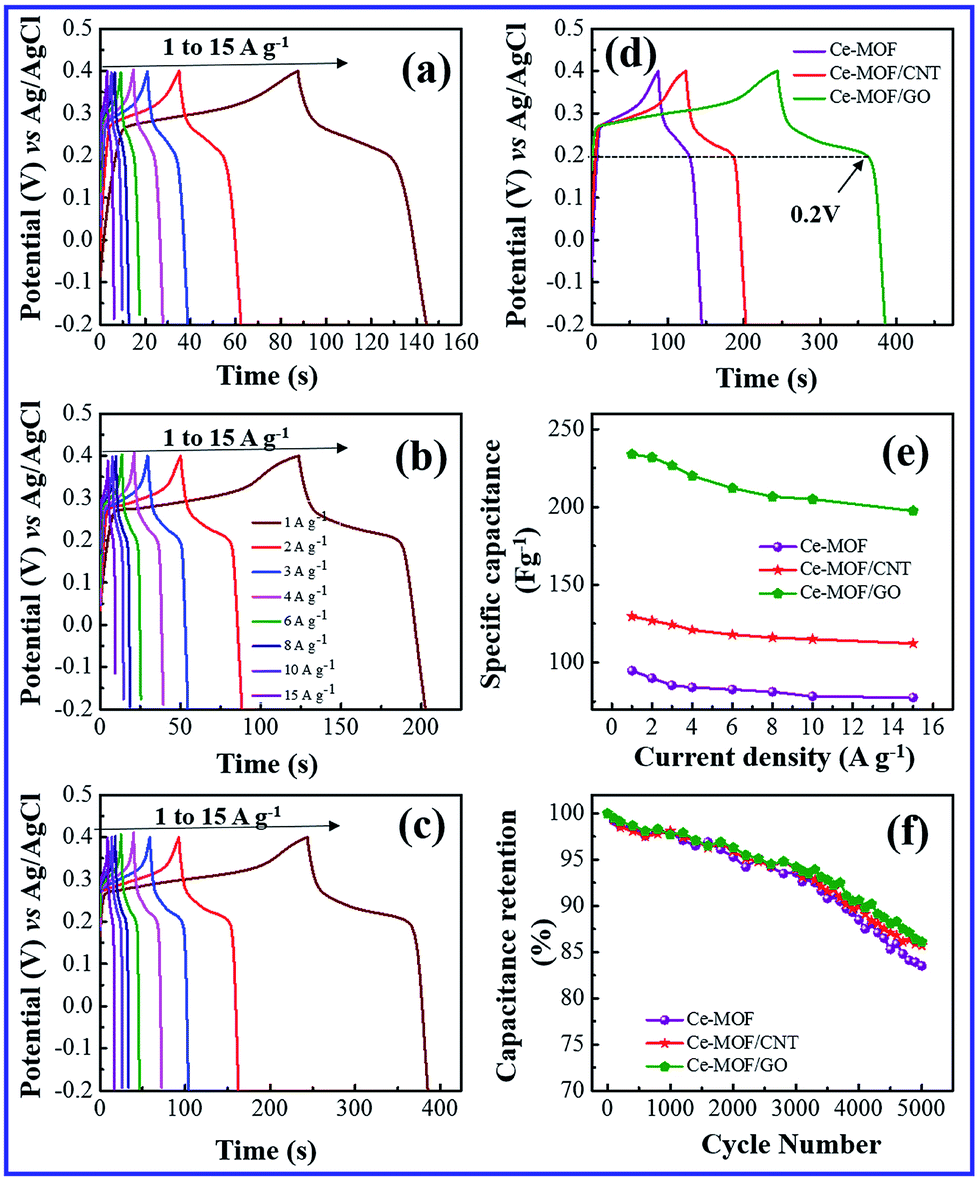 | ||
| Fig. 5 Galvanostatic charge/discharge behavior in 3 M KOH electrolyte. (a) Ce-MOF (b) Ce-MOF/CNT (c) Ce-MOF/GO (d) comparison of galvanostatic charge–discharge curve at 1 A g−1 current density (e) specific capacitance plot of Ce-MOF composites and (f) specific capacitance retention behavior at 3 A g−1 current density. | ||
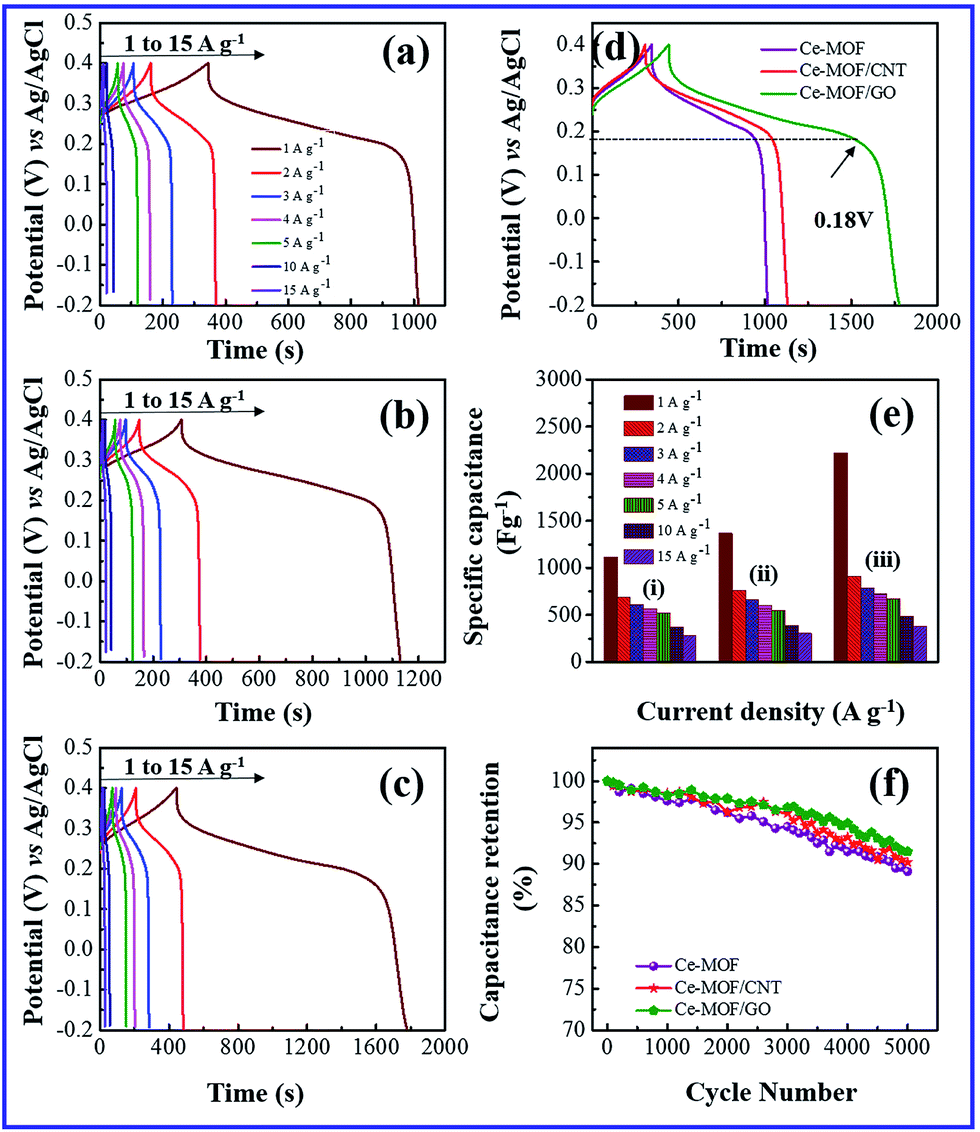 | ||
| Fig. 6 Galvanostatic charge/discharge behavior in 3 M KOH + 0.2 M K3(Fe(CN)6) electrolyte. (a) Ce-MOF (b) Ce-MOF/CNT (c) Ce-MOF/GO (d) comparison of galvanostatic charge–discharge curve at 1 A g−1 current density (e) specific capacitance plot of Ce-MOF composites and (f) specific capacitance retention behavior at 3 A g−1 current density. | ||
When redox additive was added to KOH, the plateaus potential was shifted to ∼0.18 V in the discharge process (Fig. 6(d)), corresponding to the redox reaction of K3Fe(CN)6 (ref. 52) which proves that the pseudocapacitance contribution of the redox additive also involved in the total capacitance of the electrode.
The specific capacitance of electrode materials is calculated from galvanostatic discharge curves according to the following equation,53
 | (4) |
A maximum specific capacitance of 94.8, 129.6 and 233.8 F g−1 was obtained in KOH electrolyte for Ce-MOF, Ce-MOF/CNT and Ce-MOF/GO, respectively, at a current density of 1 A g−1. Obviously, the specific capacitances of the electrodes were improved after the addition of K3Fe(CN)6 in KOH, which were calculated as 1116.3, 1367 and 2221.2 F g−1 for Ce-MOF, Ce-MOF/CNT, and Ce-MOF/GO, respectively. The reduction in specific capacitance at high current density is probably due to the unfavorable approachability of the electrolyte ions into the inner active sites of the electrode; i.e., the electrodes are inadequate to support complete redox reactions at higher current density because of the lower diffusion rate of OH− ions into the electrodes.54 As seen from Fig. 6(a)–(d), the decreased IR drop in the discharge curve suggests that the electrochemical performance is enhanced by 3 M KOH + 0.2 M K3Fe(CN)6 electrolyte. Due to higher ionic conductivity and better redox behavior of K3Fe(CN)6, the electron transportation increases which results in higher specific capacitance.55 It should be remarked that a proportion of the redox species in the electrolyte will also participate in the electrode during charge/discharge process. So, the mass of those redox species should be considered for specific capacitance measurements.56 As the evidence of Fig. 5(e) and 6(e), the specific capacitance of Ce-MOF can be enhanced more significantly with GO than with CNT in both electrolytes. This could be due to the redox activities of the oxygen functional groups which present in GO. The oxygen functional groups in GO such as carbonyl, carboxyl and quinone contribute to the pseudocapacitance. The faradic redox reaction of carboxyl and phenol groups can be expressed as follows,57,58
| –COOH + OH− ↔ –COO + H2O + e− | (5) |
![[double bond splayed left]](https://www.rsc.org/images/entities/char_e009.gif) C–OH + OH− ↔ CO + H2O + e− C–OH + OH− ↔ CO + H2O + e−
| (6) |
Furthermore, when the current density is increased, the specific capacitance of the electrodes decreases due to the less interaction between electrode and electrolyte ions at higher current densities. In other words, at lower current density the electrolyte ions can easily diffuse into all possible spaces in the electrode surface, which leads to enough insertion reactions.59
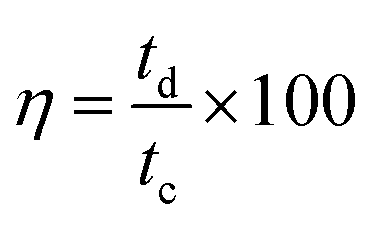
Long cycle life is one of the major requirements for practical applications of the electrode materials. To study the cyclic stability of the electrodes, an endurance test was conducted using galvanostatic charging/discharging cycles at 3 A g−1. From Fig. 5(f) and 6(f), Ce-MOF/GO electrode shows higher capacitance retention than pure Ce-MOF and Ce-MOF/CNT electrodes, which indicates good rate capability and excellent electrochemical cyclic stability. All the electrodes in 3 M KOH + 0.2 M K3Fe(CN)6 electrolyte show good long-term cycle life and exhibit superior electrochemical stability than the pure KOH electrolyte, which indicates that the addition of 0.2 M K3Fe(CN)6 to the electrolyte has remarkably enhanced the specific capacitance of electrodes, but also improved the cyclic stability. Coulombic efficiency is an essential circumstance which represents the stability of electrode materials through the charge–discharge process. The coulombic efficiency of electrode is estimated according to the formula,60
 | (7) |
 | ||
| Fig. 7 (a) Coulombic efficiency in 3 M KOH electrolyte (b) Ragone plot of Ce-MOF composite in 3 M KOH electrolyte (c) coulombic efficiency in 3 M KOH + 0.2 M K3(Fe(CN)6) electrolyte (d) Ragone plot of Ce-MOF composite in 3 M KOH + 0.2 M K3(Fe(CN)6) electrolyte. | ||
The morphology of Ce-MOF, Ce-MOF/GO and Ce-MOF/CNT electrodes were studied before and after 5000 cycles at a current density of 3 A g−1 in 3 M KOH. As shown in Fig. S4,† there were no significant changes in electrode's morphology even after long charging/discharging process indicates the good stability.
Fig. 7(b) and (d) shows the energy and power density of Ce-MOF composites in 3 M KOH and 3 M KOH + 0.2 M K3(Fe(CN)6) electrolytes, and it is calculated by the following equations,62
 | (8) |
 | (9) |
Maximum energy density and power density of 11.96 W h kg−1 and 4.497 kW kg−1 was obtained for Ce-MOF/GO electrode, respectively. The energy density of Ce-MOF/GO is higher than that of Ce-MOF and Ce-MOF/CNT, which mainly benefits from the high specific capacitance. The energy density of Ce-MOF/GO was improved to 111.05 W h kg−1 after addition of 0.2 M K3Fe(CN)6 to KOH, implying that Ce-MOF/GO electrode in 3 M KOH + 0.2 M K3Fe(CN)6 electrolyte could be used in high performance supercapacitor device.
Electrochemical impedance spectroscopy was investigated to examine the frequency dependent charge transport phenomenon in the electrodes. Fig. 8(a) and (c) shows the Nyquist plot of Ce-MOF composite electrodes measured with an AC perturbation of 0.1 V in the frequency range from 1 Hz to 105 Hz. A semicircle region could not be recognized at high frequency region which is attributed to the low faradic charge transfer resistance4 and the vertical line at low frequency region shows the ideal capacitive behavior of the electrodes.63 It is noticed that the vertical line of Ce-MOF/GO electrode at low frequency is approaching to the imaginary axis, indicating better pseudocapacitance behavior than other electrodes, which is probably due to the pseudocapacitance contribution of oxygen functional groups in GO. Bode plot phase angles as function of the frequency of the electrodes in 3 M KOH and 3 M KOH + 0.2 M K3Fe(CN)6 electrolytes are shown in Fig. 8(b) and (d), respectively. The phase angles of all the electrodes lie in the range of 50–70° at low frequency (<100 Hz), which suggests the redox and ideal capacitive behavior of the electrodes.64 The phase angle is slightly higher for Ce-MOF/GO in both electrolytes, probably due to the broader pseudocapacitance behavior, which is consistent with the results obtained from CV and GCD measurements. When the frequency is increased (100–105 Hz), the phase angle decreases rapidly, and it reached ∼zero at the frequency region 104–105 Hz. This fact can be associated to the less adsorption of the electrolyte ions onto the electrode surface, which leads to less accessible sites in the electrode. Therefore, the resistive component is dominant rather than the capacitive behavior, which reveals phase angle of ∼zero at the high frequency region.
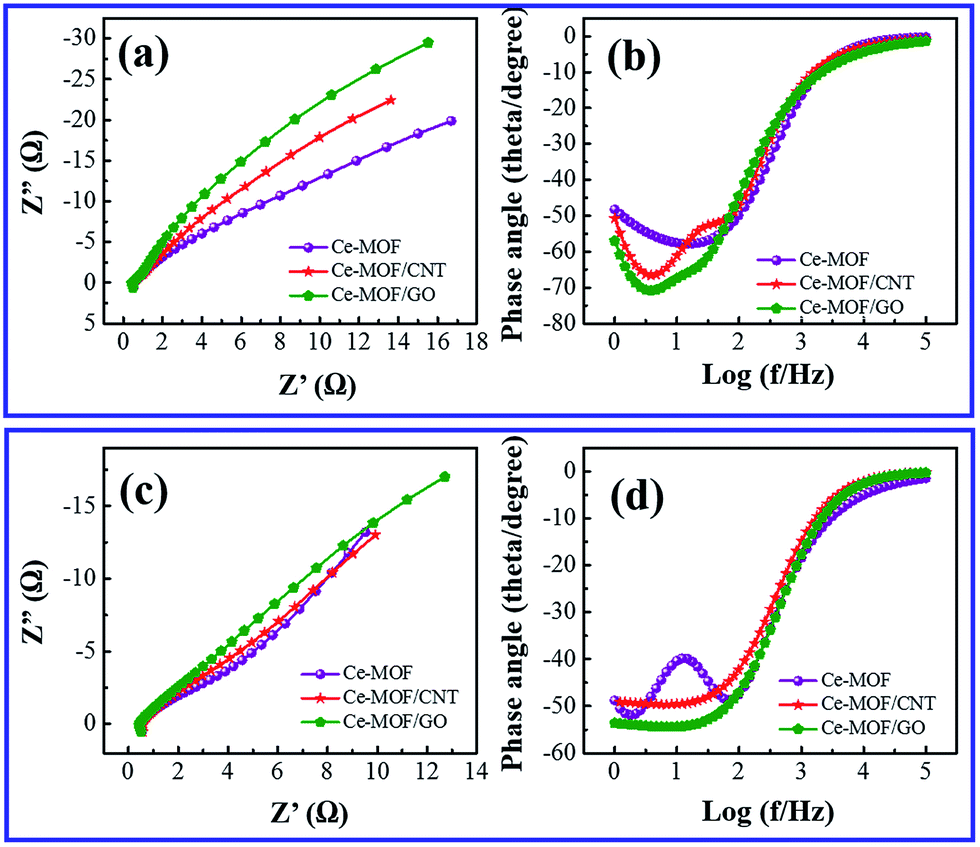 | ||
| Fig. 8 (a) Nyquist plot and (b) Bode phase angle of Ce-MOF composites in 3 M KOH electrolyte. (c) Nyquist plot and (d) Bode phase angle of Ce-MOF composites in 3 M KOH + 0.2 M K3(Fe(CN)6) electrolyte. | ||
The Ce-MOF/GO composite electrode exhibited an enhanced electrochemical performance in 3 M KOH + 0.2 M K3Fe(CN)6 electrolyte, and this can be attributed to the following features. (1) Graphene oxide sheets could prevent the aggregations of the Ce-MOF nanorods and anchored directly on the GO sheets, which makes good contact between the electrolyte and electrode surface. (2) The presence of the oxygen functional groups were involved for redox reaction with electrolyte ions and enhanced pseudocapacitance. (3) The large mesoporous structure of Ce-MOF/GO could facilitate the ions transfer in electrode/electrolyte interfaces. (4) Redox reaction could be enhanced by the redox additive species in the electrolyte (Fig. 9). The overall results suggest that the synthesized Ce-MOF/GO composite could be used for high performance supercapacitor electrode material.
 | ||
| Fig. 9 Charge transport mechanism of Ce-MOF/GO composite. | ||
Conclusions
In summary, we have prepared Ce-MOF based composites by wet chemical route and studied their electrochemical performance towards the supercapacitor electrodes. A maximum specific capacitance of 2221.2 F g−1 and energy density of 111.05 W h kg−1 have been obtained for Ce-MOF/GO composite at a current density of 1 A g−1 in 3 M KOH + 0.2 M K3Fe(CN)6 electrolyte. This enhanced electrochemical behavior due to the large mesoporous structure of Ce-MOF and pseudocapacitance contribution of graphene oxide sheet. The excellent long term stability of Ce-MOF/GO composite showed that the promising electrode material towards supercapacitor applications.Conflicts of interest
There are no conflicts to declare.Acknowledgements
This work was supported by National Natural Science Foundation of China (Project No. 51505209) and Shenzhen Science and Technology Innovation Committee (Projects No. JCYJ20170412154426330 and KQTD2015071710313656). Fei Wang is also supported by Guangdong Natural Science Funds for Distinguished Young Scholar (Project No. 2016A030306042) and the Guangdong Special Support Program (Project No. 2015TQ01X555).Notes and references
- J. Zhao, Y. Gao and A. F. Burke, J. Power Sources, 2017, 363, 327–340 CrossRef CAS.
- Y. G. Zhu, G. S. Cao, C. Y. Sun, J. Xie, S. Y. Liu, T. J. Zhu, X. B. Zhao and H. Y. Yang, RSC Adv., 2013, 3, 19409–19415 RSC.
- H. Heydari, S. E. Moosavifard, S. Elyasi and M. Shahraki, Appl. Surf. Sci., 2017, 394, 425–430 CrossRef CAS.
- R. Ramachandran, M. Saranya, P. Kollu, B. P. C. Ragupathy, S. K. Jeong and A. N. Grace, Electrochim. Acta, 2015, 178, 647–657 CrossRef CAS.
- M. Lian, X. Wu, Q. Wang, W. Zhang and Y. Wan, Ceram. Int., 2017, 43, 9877–9883 CrossRef CAS.
- Y. Zhan, Y. Meng, N. Yan, Y. Li, D. Wei and X. Tao, J. Appl. Polym. Sci., 2017, 134, 45566 CrossRef.
- Q. Meng, K. Cai, Y. Chen and L. Chen, Nano Energy, 2017, 36, 268–285 CrossRef CAS.
- A. Afzal, F. A. Abuilaiwi, A. Habib, M. Awais, S. B. Waje and M. A. Atieh, J. Power Sources, 2017, 352, 174–186 CrossRef CAS.
- J. Huang, J. Wang, C. Wang, H. Zhang, C. Lu and J. Wang, Chem. Mater., 2015, 27(6), 2107–2113 CrossRef CAS.
- R. Ramachandran, M. Saranya, A. N. Grace and F. Wang, RSC Adv., 2017, 7, 2249–2257 RSC.
- M. Yang, K. G. Lee, S. J. Lee, S. B. Lee, Y. K. Han and B. G. Choi, ACS Appl. Mater. Interfaces, 2015, 7, 22364–22371 CAS.
- H. Wang, J. Liu, Z. Chen, S. Chen, T. C. Sum, J. Lin and Z. X. Shen, Electrochim. Acta, 2017, 230, 236–244 CrossRef CAS.
- W. Zhang, Y. Ma, Z. Yang, X. Tang, X. Li, G. He, Y. Cheng, Z. Fang, R. He and Y. Zhang, J. Alloys Compd., 2017, 712, 704–713 CrossRef CAS.
- Y. Zhao, Z. Song, X. Li, Q. Sun, N. Cheng, S. Lawes and X. Sun, Energy Storage Materials, 2016, 2, 35–62 CrossRef.
- W. Xia, A. Mahmood, R. Zou and Q. Xu, Energy Environ. Sci., 2015, 8, 1837–1866 CAS.
- R. R. Salunkhe, Y. V. Kaneti, J. Kim, J. H. Kim and Y. Yamauchi, Acc. Chem. Res., 2016, 49, 2796–2806 CrossRef CAS PubMed.
- B. Liu, H. Shioyama, T. Akita and Q. Xu, J. Am. Chem. Soc., 2008, 130, 5390–5539 CrossRef CAS PubMed.
- J. Kim, C. Young, J. Lee, M. S. Park, M. Shahabuddin, Y. Yamauchi and J. H. Kim, Chem. Commun., 2016, 52, 13016–13019 RSC.
- L. Wang, Y. Han, X. Feng, J. Zhou, P. Qi and B. Wang, Coord. Chem. Rev., 2016, 307, 361–381 CrossRef CAS.
- J. Yang, Z. Ma, W. Gao and M. Wei, Chem.–Eur. J., 2017, 23, 631–636 CrossRef CAS PubMed.
- Y. Jiao, J. Pei, D. Chen, C. Yan, Y. Hu, Q. Zhang and G. Chen, J. Mater. Chem. A, 2017, 5, 1094–1102 CAS.
- Y. Jiao, J. Pei, C. Yan, D. Chen, Y. Hu and G. Chen, J. Mater. Chem. A, 2016, 4, 13344–13351 CAS.
- M. L. Yue, Y. F. Jiang, L. Zhang, C. Y. Yu, K. Y. Zou and Z. X. Li, Chem.–Eur. J., 2017, 13, 1–15 Search PubMed.
- X. Wang, X. Liu, H. Rong, Y. Song, H. Wen and Q. Liu, RSC Adv., 2017, 7, 29611–29617 RSC.
- J. Kim, C. Young, J. Lee, Y. U. Heo, M. S. Park, M. S. A. Hossain, Y. Yamauchi and J. H. Kim, J. Mater. Chem. A, 2017, 5, 15065–15072 CAS.
- J. Yang, C. Zheng, P. Xiong, Y. Li and M. Wei, J. Mater. Chem. A, 2014, 2, 19005–19010 CAS.
- P. Srimuk, S. Luanwuthi, A. Krittayavathananon and M. Sawangphruk, Electrochim. Acta, 2015, 157, 69–77 CrossRef CAS.
- A. Hosseininan, A. Amjad, R. H. Khanmiri, E. G. Kalhor, M. Babazadeh and E. Vessally, J. Mater. Sci.: Mater. Electron., 2017, 28, 18040–18048 CrossRef.
- Y. Liu, G. Li, Y. Ying and X. Peng, ACS Appl. Mater. Interfaces, 2017, 9(16), 14043–14050 CAS.
- P. Wen, P. Gong, J. Sun, J. Wang and S. Yang, J. Mater. Chem. A, 2015, 3, 13874–13883 Search PubMed.
- M. Saraf, R. Rajak and S. M. Mobin, J. Mater. Chem. A, 2016, 4, 16432–16445 CAS.
- D. Xu, X. N. Sun, W. Hu and X. Y. Chen, J. Power Sources, 2017, 357, 107–116 CrossRef CAS.
- S. T. Senthilkumar, R. Kalaiselven and J. S. Melo, J. Mater. Chem. A, 2013, 1, 12386–12394 CAS.
- H. Yu, L. Fan, J. Wu, Y. Lin, M. Huang, J. Lin and Z. Lan, RSC Adv., 2012, 2, 6736–6740 RSC.
- K. Chen, F. Liu, D. Xue and S. Komarneni, Nanoscale, 2015, 7, 432–439 RSC.
- J. Kim, J. H. Kim and K. Ariga, Joule, 2017, 1, 739–768 CrossRef.
- Q. Wang, Y. F. Nie, Z. H. Xiao, X. Y. Chen and Z. J. Zhang, J. Electroanal. Chem., 2016, 770, 62–72 CrossRef CAS.
- Y. Xiong, S. Chen, F. Ye, L. Su, C. Zhang, S. Shen and S. Zhao, Chem. Commun., 2015, 51, 4635–4638 RSC.
- K. Liu, H. You, G. Jia, Y. Zheng, Y. Huang, Y. Song, M. Yang, L. Zhang and H. Zhang, Cryst. Growth Des., 2010, 10(2), 790–797 CAS.
- S. Bennabi and M. Belbachir, Adv. Mater. Lett., 2015, 6(3), 271–277 CrossRef CAS.
- X. Zhang, F. Hou, H. Li, Y. Yang, Y. Wang, N. Liu and Y. Yang, Microporous Mesoporous Mater., 2017, 259, 211–219 CrossRef.
- T. Balamurugan and S. Berchmans, RSC Adv., 2015, 5, 50470–50477 RSC.
- R. Ramachandran, S. Felix, G. M. Joshi, B. P. C. Ragupathy, S. K. Jeong and A. N. Grace, Mater. Res. Bull., 2013, 48, 3834–3842 CrossRef CAS.
- G. Zhou, J. Zhu, Y. J. Chen, L. Mei, X. C. Duan, G. H. Zhang, L. B. Chen, T. H. Wang and B. G. Lu, Electrochim. Acta, 2014, 123, 450–455 CrossRef CAS.
- Z. Gao, F. Wang, J. Chang, D. Wu, X. Wang, X. Wang, F. Xu, S. Gao and K. Jiang, Electrochim. Acta, 2014, 133, 325–334 CrossRef CAS.
- A. A. Johm, A. P. Subramanian, M. V. Vellayappan, A. Balaji, H. Mohandas and S. K. Jaganathan, Int. J. Nanomed., 2015, 10, 4267–4277 Search PubMed.
- L. Wang, Z. H. Dong, Z. G. Wang, F. X. Zhang and J. Jin, Adv. Funct. Mater., 2013, 13, 2758–2764 CrossRef.
- L. Kang, S. X. Sun, L. B. Kong, J. W. Lang and Y. C. Luo, Chin. Chem. Lett., 2014, 25, 957–961 CrossRef CAS.
- K. Chen, S. Song and D. Xue, RSC Adv., 2014, 4, 23338–23343 RSC.
- L. Banda, D. Aradilla, A. Benayad, Y. Chenavier, B. Daffos, L. Dubois and F. Duclairoir, J. Power Sources, 2017, 360, 538–547 CrossRef.
- X. Liu, C. Shi, C. Zhai, M. Cheng, Q. Liu and G. Wang, ACS Appl. Mater. Interfaces, 2016, 8, 4585–4591 CAS.
- C. Zhao, W. Zheng, X. Wang, H. Zhang, X. Cui and H. Wang, Sci. Rep., 2013, 3, 2986 CrossRef PubMed.
- R. Kumuthini, R. Ramachandran, H. A. Therese and F. Wang, J. Alloys Compd., 2017, 705, 624–630 CrossRef CAS.
- R. Wang, P. Wang, X. Yan, J. Lang, C. Peng and Q. Xue, ACS Appl. Mater. Interfaces, 2012, 4, 5800–5806 CAS.
- E. Feng, G. Ma, K. Sun, Q. Yang, H. Peng and Z. Lei, RSC Adv., 2016, 6, 75896–75904 RSC.
- B. Akinwolemiwa, C. Peng and G. Z. Chen, J. Electrochem. Soc., 2015, 162(5), A5054–A5059 CrossRef CAS.
- R. Ramachandran, M. Saranya, V. Venugopal, B. P. C. Ragupathy, S. K. Jeong and A. N. Grace, Appl. Energy, 2015, 153, 22–31 CrossRef CAS.
- J. Yan, Q. Wang, T. Wei, L. Jiang, M. Zhang, X. Jing and Z. Fan, ACS Nano, 2014, 8, 4720–4729 CrossRef CAS PubMed.
- R. Kotz and M. Carlen, Electrochim. Acta, 2000, 45, 2483–2498 CrossRef CAS.
- Q. Wang, L. Jiao, H. Du, Y. Si, Y. Wang and H. Yuan, J. Mater. Chem., 2012, 22, 21387–21391 RSC.
- L. H. Su, X. G. Zhang, C. H. Mi, B. Gao and Y. Lin, Phys. Chem. Chem. Phys., 2009, 11, 2195–2202 RSC.
- J. Wen, S. Li, B. Li, Z. Song, H. Wang, R. Xiong and G. Fang, J. Power Sources, 2015, 284, 279–286 CrossRef CAS.
- A. Liu, H. Che, Y. Mao, Y. Wang, J. Mu, C. Xu, Y. Bai, X. Zhang and G. Wang, Ceram. Int., 2016, 42, 11435–11441 CrossRef CAS.
- N. S. Arul, D. Mangalaraj, R. Ramachandran, A. N. Grace and J. I. Han, J. Mater. Chem. A, 2015, 3, 15248–15258 CAS.
Footnote |
| † Electronic supplementary information (ESI) available: Further details of FTIR spectrum of graphene oxide, EDS mapping of Ce-MOF/GO and Ce-MOF/CNT composites. See DOI: 10.1039/c7ra12789h |
| This journal is © The Royal Society of Chemistry 2018 |