 Open Access Article
Creative Commons Attribution 3.0 Unported Licence
Characterization of magnetic relaxation when biofunctionalized magnetic nano-particles are associated with biomarkers in the liquid state in biomedical applications
Shu-Hsien Liao *a,
Han-Sheng Huanga,
Jean-Hong Chenb,
Yu-Kai Sua and
Yuan-Fu Tonga
aInstitute of Electro-Optical Science and Technology, National Taiwan Normal University, Taipei 116, Taiwan. E-mail: shliao@ntnu.edu.tw
bDepartment of Materials Engineering, Kun Shan University, Tainan 710, Taiwan
First published on 23rd January 2018
Abstract
This study determined the characteristics of the time-dependent effective relaxation time τeff and magnetization M when biofunctionalized magnetic nanoparticles (BMNPs) associated with biomarkers in a liquid immunoassay. Carcinoembryonic antigen (CEA) was used as the biomarker. BMNP is an anti-CEA that was coated onto dextran-coated Fe3O4 and labeled as Fe3O4-anti-CEA. The phase lag θ of M with respect to the applied field H was measured using a sensitive homemade alternative-current susceptometer, and θ was measured using lock-in detection. The results were used to estimate τeff using the relationship tan![[thin space (1/6-em)]](https://www.rsc.org/images/entities/char_2009.gif) θ(t) = ωτeff(t), where 2πf = ω and f is the excitation frequency. Δτeff increased with ΦCEA, where Δτeff was the increment of τeff after Fe3O4-anti-CEA associated with CEA, and ΦCEA was the concentration of CEA. Additionally, M enhanced when ΦCEA increased. We attributed these enhancements to magnetic dipole–dipole interactions among MNPs that contributed extra M and in turn enhanced τeff. Magnetic clusters after the association were verified using a transmission electron microscope. This study established the relationship between Δτeff/τeff,0 and ΦCEA, where τeff,0 = τeff (ΦCEA = 0), allowing the assay of an unknown amount of CEA molecules.
θ(t) = ωτeff(t), where 2πf = ω and f is the excitation frequency. Δτeff increased with ΦCEA, where Δτeff was the increment of τeff after Fe3O4-anti-CEA associated with CEA, and ΦCEA was the concentration of CEA. Additionally, M enhanced when ΦCEA increased. We attributed these enhancements to magnetic dipole–dipole interactions among MNPs that contributed extra M and in turn enhanced τeff. Magnetic clusters after the association were verified using a transmission electron microscope. This study established the relationship between Δτeff/τeff,0 and ΦCEA, where τeff,0 = τeff (ΦCEA = 0), allowing the assay of an unknown amount of CEA molecules.
I. Introduction
Immunoassays use a variety of labels for assaying antibodies or antigens. These labels are typically chemically conjugated or linked to desired analyses. The most common methods are enzyme-linked immunosorbent assay,1 radioimmunoassay,2,3 and real-time quantitative polymerase chain reaction.4 Recently, magnetic immunoassays (MIAs)5,6 have gained considerable attention because there is negligible magnetic background in a biomolecular sample during magnetic detection; thus, MIAs can reach a high detection sensitivity. In MIAs, biofunctionalized magnetic nanoparticles (BMNPs) are used as labels.7 The assays involve the specific binding of a bioprobe to its analyte, and a magnetic label is conjugated to one element of the pair to form magnetic clusters. Because of molecular interactions between MNPs, their magnetic properties change after the association. These changes in magnetic characteristics provide a sensing mechanism. The signal for magnetic clusters is then detected using magnetic sensors, which measure the change of magnetic signals that is induced by magnetic clusters. Changes in magnetic signals are proportional to the concentrations of analytes (e.g., viruses, bacteria, tumor markers, and cardiac markers) in samples. Different sensing mechanisms have been used for MIAs, such as Brownian relaxation time,8 Néel relaxation time,9–12 remanent magnetization,13,14 saturation magnetization,15,16 spin–spin relaxation time,17 and alternative-current (AC) susceptibility.18–26Effective relaxation time τeff is one of the magnetic properties that are affected by the magnetic clustering of BMNPs when they associate with biomarkers. The value of τeff reflects the effect of clustered MNPs on Brownian and Néel relaxations.27 To study τeff, Liao et al. used a homemade AC susceptometer.28
In the current study, a sensitive homemade AC susceptometer was used to characterize τeff when BMNPs that are composed of Fe3O4-anti-carcinoembryonic antigen (CEA) associated with CEA in biomedical applications. This study found that Δτeff increased with the concentration of CEA, Φeff, where Δτeff was the increment of τeff. This increase was attributed to dipole–dipole interactions between MNPs, which contributed extra magnetization and in turn increased the value of τeff. A relationship between Δτeff/τeff,0 and ΦCEA was established, where τeff,0 = τeff (ΦCEA = 0). This relationship is based on a (Δτeff/τeff,0)-versus-ΦCEA curve and can be used to determine an unknown amount. This paper also discusses the merits of using the Δτeff/τeff,0 ratio for biosensing.
II. Experiments
BMNPs are anti-CEAs that were coated onto dextran-coated MNPs and labeled as Fe3O4-anti-CEA (MF-CEA-0060, MagQu Co., Taiwan). The biotarget was CEA (AbD). A feasibility study for clinical use reported the development of antibody-functionalized magnetic nanoparticles for the immunoassay of CEA.29 The mean diameter of BMNPs was 53.8 ± 17.8 nm,23 as detected through dynamic light scattering (Nanotrac-150, Microtrac) and shown in Fig. 1a. The magnetization reagent was characterized using a vibrating sample magnetometer (Hystermag MagQu Co. Taiwan). The magnetic clustering after association was measured using a field-emission transmission electron microscope (Philips Tecnai F20 G2). Before being examined, the reagent consisted of magnetic clusters that were dispersed in an extremely diluted solvent (1![[thin space (1/6-em)]](https://www.rsc.org/images/entities/char_2009.gif) :
:![[thin space (1/6-em)]](https://www.rsc.org/images/entities/char_2009.gif) 50). The samples were then dried under vacuum at room temperature for 48 h.
50). The samples were then dried under vacuum at room temperature for 48 h.
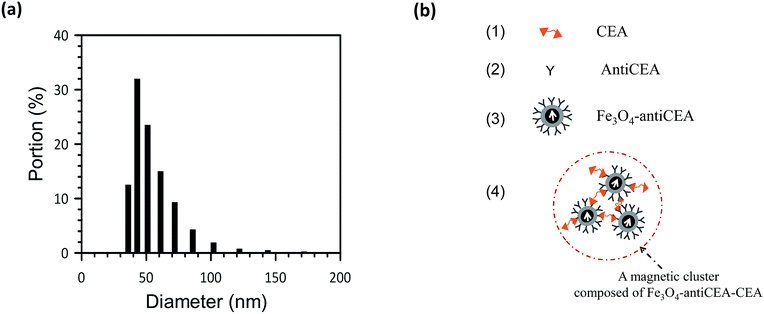 | ||
| Fig. 1 (a) The size distribution diagram of BMNPs. (b) A representation of CEA, Fe3O4-anti-CEA, and a magnetic cluster composed of Fe3O4-anti-CEA-CEA. | ||
Fig. 1b shows pictures of CEA, anti-CEA, functionalized Fe3O4-anti-CEA, and a magnetic cluster that is composed of Fe3O4-anti-CEA-CEA. The magnetic clusters of Fe3O4-anti-CEA-CEA conjugated when CEAs were mixed with a reagent that consisted of functionalized Fe3O4-anti-CEA.
III. AC susceptibility
The AC susceptibility χac(ω) of the samples is expressed as follows:28,30| χac = χ′ + iχ′′ | (1) |
| χ′ = χ0{1/[1 + (ωτeff)2]}, | (2) |
| χ′′ = χ0(ωτeff)/{[1 + (ωτeff)2]} | (3) |
![[thin space (1/6-em)]](https://www.rsc.org/images/entities/char_2009.gif) ωτeff(t) = χ′′/χ′ is the phase lag for the time-varying magnetization, M(t), with respect to the applied AC magnetic field, H(t), and τeff is the effective relaxation time. In this study, θ(t) was detected using a homemade AC susceptometer and the lock-in detection technique at 18 kHz. The time evolution of τeff(t) was measured by monitoring θ(t). The value of τeff(t) was estimated using the relationship θ = tan−1
ωτeff(t) = χ′′/χ′ is the phase lag for the time-varying magnetization, M(t), with respect to the applied AC magnetic field, H(t), and τeff is the effective relaxation time. In this study, θ(t) was detected using a homemade AC susceptometer and the lock-in detection technique at 18 kHz. The time evolution of τeff(t) was measured by monitoring θ(t). The value of τeff(t) was estimated using the relationship θ = tan−1![[thin space (1/6-em)]](https://www.rsc.org/images/entities/char_2009.gif) ωτeff(t). The value of Δτeff = [τeff(t = 0) − τeff(t = ∞)] was given as a function of the concentration of biomarkers to characterize their abundance.
ωτeff(t). The value of Δτeff = [τeff(t = 0) − τeff(t = ∞)] was given as a function of the concentration of biomarkers to characterize their abundance.
IV. Results and discussion
To explore and confirm the combination of Fe3O4-anti-CEA and CEA, a TEM was used to verify the presence of magnetic clustering when CEA associated with Fe3O4-anti-CEA. Fig. 2a shows a TEM image of CEA molecules; single CEA molecules are marked with small dashed circles. A CEA molecule has a mean length of approximately 29 nm,31 which is close to the value given in Fig. 2b. Fig. 2b shows a TEM image of magnetic clusters when Fe3O4-anti-CEA associated with CEA molecules; some magnetic clusters are marked with a large dashed circle. Each magnetic cluster was composed of several small magnetic clusters. Also marked is the independent Fe3O4-anti-CEA and MNPs inside the magnetic clusters; the formation of magnetic clusters was verified using a TEM. The size of associations with CEA molecules was changeable; if the concentration of CEA molecules was higher, then a magnetic cluster was formed. Thus, the size of Fe3O4-anti-CEA associated with CEA molecules increased. | ||
| Fig. 2 (a) A TEM picture of CEA molecules and (b) magnetic clusters after Fe3O4-anti-CEA associated with CEA molecules. | ||
Fig. 3 illustrates curves for M as a function of H after the reagents that were composed of Fe3O4-anti-CEA associated with different concentrations of CEA in a liquid state. This shows that when H = 0.16 T and M = 0.07 emu g−1 for the reagent, then M increased to 0.011, 0.154, and 0.218 emu g−1 after the reagent with ΦCEA = 1, 5, and 10 μg mL−1 associated with CEA, respectively. This increase is attributable to dipole–dipole interactions between MNPs in the magnetic clusters. Thus, the magnetization increased with the CEA concentration.
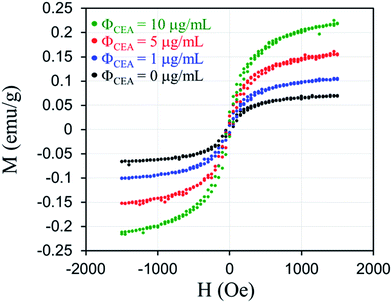 | ||
| Fig. 3 Curves for M as a function of H after the reagents that are composed of Fe3O4-anti-CEA associated with different concentrations of CEA in a liquid state. | ||
For a homogeneous MNP with a total number of particles, N, a mean magnetic moment, 〈m〉, and an effective mean diameter, 〈d〉eff, the magnetization M(H) at H is expressed as follows:
| M(H) = N〈m〉L[(αH)] = αL[(βH)] | (4) |
| L(x) = coth(x) − 1/x | (5) |
Fig. 4a exhibits the change in θ over time when Fe3O4-anti-CEA associated with different CEA concentrations. ΦCEA was detected using an AC susceptometer and a lock-in technique. θ increased over time and θ = 6° for the reagent. The value of θ increased to θ = 9.4° when t = 7200 s for CEA with a ΦCEA = 10 μg mL−1 conjugated with Fe3O4-anti-CEA. Fig. 4b shows the relationship between τeff and time for the reaction process when the reagent conjugated with different concentrations of ΦCEA. The value of τeff for the reagent was 0.93 μs when t = 0 and remained constant until t = 7200 s, which demonstrated that the AC susceptometer had stable performance. In the reaction with 10 μg mL−1 CEA, the value of τeff was approximately 0.93 μs when t = 0 and the value of τeff increased to 1.43 μs when t = 7200 s. The τeff-versus-t curve showed saturation at approximately t = 7200 s.
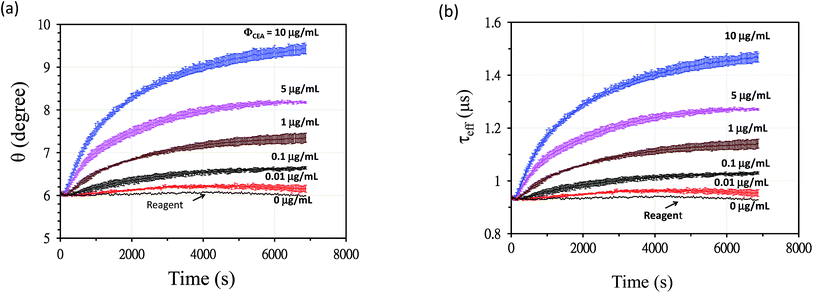 | ||
| Fig. 4 (a) The relationship between θ for CEA and time in the reaction process and (b) the relationship between τeff and time when the reagent associated with different concentrations of CEA. | ||
Yang et al. studied the effect of temperature on immunoreaction kinetics for a BMNP assay of biomarkers for colorectal cancer.33 The activation energy that was required for the reaction in immunoassay was determined to be 10−19 J per molecule. At higher temperatures, a significant increase was observed in the number of molecules with energy that was higher than the activation energy, which is the principal reason for the increase in the reaction rate. The current study indicated that it takes approximately 2 h to complete the association at 298 K. An increase in the reaction temperature decreased the reaction time.
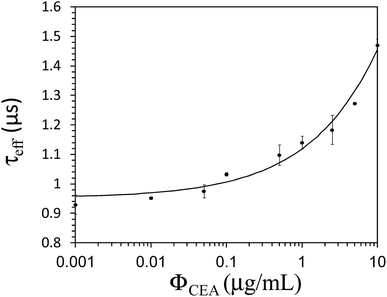
Fig. 5 illustrates the value of τeff as a function of ΦCEA when the reagent associated with various concentrations of CEA; the red line is a guide. It is seen that τeff = 0.93 μs for a reagent that consisted of Fe3O4-anti-CEA. The value of τeff increased to 1.43 μs when ΦCEA = 10 μg mL−1 associated with the reagent. The increase in the value of τeff after association with Fe3O4-anti-CEA is due to magnetic interactions between MNPs in the associated magnetic clusters. The value of M increased; therefore, the value of τeff increased.
Two simultaneous relaxations occur during the reaction process: Néel and Brownian relaxation. In Brownian relaxation, the magnetic moment is locked to the crystal axis and the particle rotates. The corresponding relaxation time is τB when the field is turned off. In Néel relaxation, the magnetic moment rotates within the crystal, and the corresponding relaxation time is τN. The Brownian relaxation time τB is expressed as τB = 3ηVH/kBT,29 where η is the viscosity coefficient, kB = 1.38 × 10⁻²³ J K−1 is the Boltzmann constant, T is the absolute temperature (K), and VH is the hydrodynamic volume of BMNPs. The Néel relaxation time, τN, is given by the expression, τN = [(π)1/2/2]τ0![[thin space (1/6-em)]](https://www.rsc.org/images/entities/char_2009.gif) exp[ρ]/(ρ)1/2, where ρ = KVM/kBT, K is the anisotropy constant, τ0 is the relaxation time, and VM = (4π/3)R3 is the magnetic volume of MNPs with radius R. The approximate mean core value was 〈R〉 = 37 nm in this study. If 〈R〉 = 37 nm, then τBrownian is in the order of microseconds and τNéel is in the order of milliseconds or longer.27 The mean hydrodynamic diameter of BMNPs in this work was approximately 47 nm, which equates to a core size of approximately 38 nm. Because 1/τeff = 1/τBrownian,eff + 1/τNéel,eff and 1/τBrownian,eff ≫ 1/τNéel,eff, the values of 1/τeff,eff ∼ 1/τBrownian,eff can be approximated. Brownian relaxation dominates the time dependency of τeff in the association process that is shown in Fig. 4b.
exp[ρ]/(ρ)1/2, where ρ = KVM/kBT, K is the anisotropy constant, τ0 is the relaxation time, and VM = (4π/3)R3 is the magnetic volume of MNPs with radius R. The approximate mean core value was 〈R〉 = 37 nm in this study. If 〈R〉 = 37 nm, then τBrownian is in the order of microseconds and τNéel is in the order of milliseconds or longer.27 The mean hydrodynamic diameter of BMNPs in this work was approximately 47 nm, which equates to a core size of approximately 38 nm. Because 1/τeff = 1/τBrownian,eff + 1/τNéel,eff and 1/τBrownian,eff ≫ 1/τNéel,eff, the values of 1/τeff,eff ∼ 1/τBrownian,eff can be approximated. Brownian relaxation dominates the time dependency of τeff in the association process that is shown in Fig. 4b.
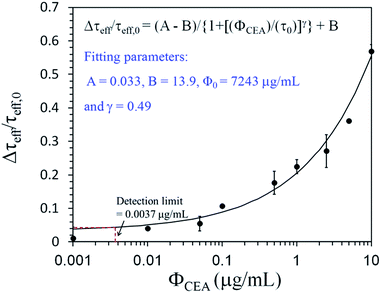
Fig. 6 illustrates Δτeff/τeff,0 as a function of ΦCEA when Fe3O4-anti-CEAs conjugated with CEAs, where Δτeff = τeff (ΦCEA) − τeff (ΦCEA = 0) and τeff,0 = τeff (ΦCEA = 0) at t = 7200 s. In an assay of 10 μg mL−1 CEA molecules, Δτeff/τeff,0 = 0.05 as ΦCEA.
Fig. 6 Δτeff/τeff,0 as a function of ΦCEA = 0.01 μg mL−1 and Δτeff/τeff,0 increases to 0.54 when ΦCEA = 0.01 μg mL−1; Δτeff/τeff,0 increases when ΦCEA increases.
The value of Δτeff/τeff,0 as a function of ΦCEA is described by a logistic function:34
| Δτeff/τeff,0 = (A − B)/{1 + [(ΦCEA)/(τ0)]γ} + B | (6) |
V. Conclusions
This study determined the relationship between time and τeff when a reagent that consisted of Fe3O4-anti-CEA associated with CEA molecules. Because of magnetic interactions between MNPs in magnetic clusters, which contributed extra magnetization, Néel relaxation and Brownian relaxation increased, which resulted in an increase in the value of τeff. Magnetic clustering was verified using a TEM. A relationship between Δτeff/τeff,0 and ΦCEA was established, which obeyed a logistic function, allowing the assay of an unknown amount of CEA molecules. The χac detection platform for sensing biomarkers is highly sensitive, easy to use, and can be used to assay a wide variety of analytes, such as proteins, DNA, viruses, and tumor markers.Conflicts of interest
There are no conflicts to declare.Acknowledgements
This work is supported by the Ministry of Science and Technology of Taiwan under grant number: 104-2112-M-003-005, 105-2112-M-003-012, 106-2112-M-003-002 and by “Aim for the Top University Plan” of the National Taiwan Normal University and the Ministry of Education, Taiwan, R. O. C under grant number 104J1A27 and 105J1A27.References
- E. Engvall and P. Perlmann, Enzyme-linked immunosorbent assay (ELISA) quantitative assay of immunoglobulin G, Immunochemistry, 1971, 8(9), 871–874, DOI:10.1016/0019-2791(71)90454-X , PMID 5135623.
- S. Acton, A. Rigotti, K. T. Landschulz, S. Xu, H. H. Hobbs and M. Krieger, Identification of scavenger receptor SR-BI as a high density lipoprotein receptor, Science, 1990, 271, 518–520 Search PubMed.
- M. Cattet and J. R. Geraci, Distribution and elimination of ingested brevetoxin (PbTx-3) in rats, Texicon, 1993, 31, 1483–1486 CrossRef CAS.
- J. M. S. Bartlett and D. Stirling, A Short History of the Polymerase Chain Reaction, PCR Protocols, Methods in Molecular Biology, 2nd edn, 2003, vol. 226, pp. 3–6, DOI:10.1385/1-59259-384-4:3, ISBN 1-59259-384-4.
- C.-Y. Hong, C. C. Wu, Y. C. Chiu, S. Y. Yang, H. E. Horng and H. C. Yang, Magnetic Susceptibility Reduction Method for Magnetically Labeled Immunoassay, Appl. Phys. Lett., 2006, 88, 212512 CrossRef.
- K. Enpuku, K. Soejima, T. Nishimoto, T. Matsuda, H. Tokumitsu, T. Tanaka, K. Yoshinaga, H. Kuma and N. Hamasaki, Biological immunoassays without bound/free separation utilizing magnetic marker and HTS SQUID, IEEE Trans. Appl. Supercond., 2007, 17, 816 CrossRef CAS.
- C. R. Tamanaha, S. P. Mulvaney, J. C. Rife and L. J. Whitman, Magnetic labeling, detection, and system integration, Biosens. Bioelectron., 2008, 24, 1–13 CrossRef CAS PubMed , PMID 18374556.
- K. Enpuku, H. Tokumitsu, Y. Sugimoto, H. Kuma, N. Hamasaki, A. Tsukamoto, T. Mizoguchi, A. Kandori, K. Yoshinaga, H. Kanzaki and N. Usuki, Fast Detection of Biological Targets With Magnetic Marker and SQUID, IEEE Trans. Appl. Supercond., 2009, 19, 844 CrossRef CAS.
- R. Kötitz, W. Weitschies, L. Trahms, W. Brewer and W. Semmler, J. Magn. Magn. Mater., 1999, 194, 62 CrossRef.
- S. K. Lee, W. R. Myers, H. L. Grossman, H.-M. Cho, Y. R. Chemla and J. Clarke, Appl. Phys. Lett., 2002, 81, 3094 CrossRef CAS.
- W. Weitschies, T. Bunte and L. Trahms, Pharm. Pharmacol. Lett., 1997, 7, 1 Search PubMed.
- R. Kotitz, H. Matz, L. Trahms, H. Koch, W. Weitschies, T. Rheinlander, W. Semmler and T. Bunte, IEEE Trans. Appl. Supercond., 1997, 7, 3678–3681 CrossRef.
- K. Enpuku, T. Minotani, T. Gima, Y. Kuroki, Y. Itoh, M. Yamashita, Y. Katakura and S. Kuhara, Jpn. J. Appl. Phys., 1999, 38, L1102 Search PubMed.
- K. Enpuku, K. Inoue, K. SoeJima, K. Yoshinaga, H. Kuma and N. Hamasaki, IEEE Trans. Appl. Supercond., 2005, 15, 660 CrossRef CAS.
- H. E. Horng, S. Y. Yang, C.-Y. Hong, C. M. Liu, P. S. Tsai, H. C. Yang and C. C. Wu, Appl. Phys. Lett., 2006, 88, 252506 CrossRef.
- J.-J. Chieh, K.-W. Huang and J.-C. Shi, Sub-tesla-field magnetization of vibrated magnetic nanoreagents for screening tumor markers, Appl. Phys. Lett., 2015, 106, 073703 CrossRef.
- H. Lee, E. Sun, D. Ham and R. Weissleder, Chip-NMR biosensor for detection and molecular analysis of cells, Nat. Med., 2008, 14, 869 CrossRef CAS PubMed.
- K.-W. Huang, J.-J. Chieh, H.-E. Horng, C.-Y. Hong and H.-C. Yang, Characteristics of magnetic labeling on liver tumors with anti-alpha-fetoprotein-mediated Fe3O4 magnetic nanoparticles, Int. J. Nanomed., 2012, 7, 2987 Search PubMed.
- C. C. Yang, S. Y. Yang, J. J. Chieh, H. E. Horng, C. Y. Hong and H. C. Yang, Universal behavior of bio-molecule-concentration dependent reduction in ac magnetic susceptibility of bio-reagents, IEEE Magn. Lett., 2012, 3, 1500104 CrossRef.
- S. Tanaka, H. Ota, Y. Kondo, Y. Tamaki, S. Kobayashi and S. Noguchi, IEEE Trans. Appl. Supercond., 2003, 13, 377–380 CrossRef.
- K. Enpuku, T. Minotani, M. Hotta and A. Nakahodo, IEEE Trans. Appl. Supercond., 2001, 11, 661–664 CrossRef.
- K. Enpuku, Y. Tamai, T. Mitake, T. Yoshida and M. Matsuo, AC susceptibility measurement of magnetic markers in suspension for liquid phase immunoassay, J. Appl. Phys., 2010, 108, 034701 CrossRef.
- K.-W. Huang, J.-J. Chieh, I.-T. Lin, H.-E. Horng, H.-C. Yang and C.-Y. Hong, Anti-CEA biofuntionalized superparamagnetic iron oxide nanoparticles for examining colorectal tumors in vivo, Nanoscale Res. Lett., 2013, 8, 413 CrossRef PubMed.
- M.-J. Chiu, S.-Y. Yang, H.-E. Horng, C. Chuan Yang, Ta-F. Yang Chen, J.-J. Chieh, H.-H. Chen, T.-C. Chen, C.-S. Ho, S.-F. Chang, H. Chun Liu, C. Yih Hong and H.-C. Yang, Combined plasma biomarkers for diagnosing mild cognition impairment and Alzheimer's disease, ACS Chem. Neurosci., 2013, 4, 1530 CrossRef CAS PubMed.
- M. J. Chiu, S. Y. Yang, T. F. Chen, J. J. Chieh, T. Z. Huang, P. K. Yip, H. C. Yang, T. W. Cheng, Y. F. Chen, M. S. Hua and H. E. Horng, New assay for old markers-Plama beta amyloid of mild cognitive impairment and Alzheimer's disease, Curr. Alzheimer Res., 2012, 9, 1142 CrossRef CAS PubMed.
- S. Y. Yang, J. J. Chieh, C. C. Yang, S. H. Liao, H. H. Chen, H. E. Horng, H. C. Yang, C. Y. Hong, M. J. Chiu, T. F. Chen, K. W. Huang and C. C. Wu, Clinic Applications in Assaying Ultra-Low-Concentration Bio-Markers Using HTS SQUID-Based AC Magnetosusceptometer, IEEE Trans. Appl. Supercond., 2013, 23, 1600604 CrossRef.
- R. E. Rosensweig and J. Magn, Magn. Mater., 2002, 252, 370–374 CrossRef CAS.
- S. H. Liao, H. C. Yang, H. E. Horng, J. J. Chieh, K. L. Chen, H. H. Chen, J. Y. Chen, C. I. Liu, C. W. Liu and L. M. Wang, Time-dependent phase lag of biofunctionalized magnetic nanoparticles conjugated with biotargets studied with alternating current magnetic susceptometor for liquid phase immunoassays, Appl. Phys. Lett., 2013, 103, 243703 CrossRef.
- C.-C. Yang, S.-Y. Yang, C.-S. Ho, J.-F. Chang, B.-H. Liu and K.-W. Huang, Development of antibody functionalized magnetic nanoparticles for the immunoassay of carcinoembryonic antigen: a feasibility study for clinical use, J. Nanobiotechnol., 2014, 12, 44 CrossRef PubMed.
- C. C. Yang, S.-Y. Yang, H. H. Chen, W. L. Weng, H.-E. Horng, J.-J. Chieh, C. Y. Hong and H. C. Yang, J. Appl. Phys., 2012, 112, 012704 Search PubMed.
- M. K. Boehm and S. J. Perkins, Structural models for carcinoembryonic antigen and its complex with the single-chain Fv antibody molecule MFE23, FEBS Lett., 2000, 47511–47516 Search PubMed.
- K. Enpuku, T. Tanaka, T. Matsuda, F. Dang, N. Enomoto, J. Hojo, K. Yoshinaga, F. Ludwig, F. Ghaffari, E. Heim and M. Schilling, J. Appl. Phys., 2007, 102, 054901 CrossRef.
- S. Y. Yang, J. F. Chang, T. C. Chen, C. C. Yang and C. S. Ho, Study of the temperature dependent immuno-reaction kinetics for the biofunctionalized magnetic nanoparticle assay of bio-markers of colorectal cancer, Appl. Phys. Lett., 2014, 104, 013702 CrossRef.
- C. C. Yang, S. Y. Yang, J. J. Chieh, H. E. Horng, C. Y. Hong and H. C. Yang, IEEE Magn. Lett., 2012, 3, 1500104 CrossRef.
- N. Gehlenborg, Comprehensive molecular characterization of human colon and rectal cancer, Nature, 2012, 487, 330–337 CrossRef PubMed.
- A. Bener, Colon cancer in rapidly developing countries: review of the life style, dietary, consanguinity and hereditary risk factors, Oncol. Rev., 2011, 5, 5–11 CrossRef.
| This journal is © The Royal Society of Chemistry 2018 |

