
 Open Access Article
 This Open Access Article is licensed under a
 Creative Commons Attribution 3.0 Unported Licence
Highly-sensitive detection of eight typical fluoroquinolone antibiotics by capillary electrophoresis-mass spectroscopy coupled with immunoaffinity extraction†
Xiao-Hui Zhang,
Yan Deng,
Ming-Zhe Zhao,
Ying-Lin Zhou * and
Xin-Xiang Zhang*
* and
Xin-Xiang Zhang*
Beijing National Laboratory for Molecular Sciences (BNLMS), MOE Key Laboratory of Bioorganic Chemistry and Molecular Engineering, College of Chemistry, Peking University, Beijing 100871, China. E-mail: zhouyl@pku.edu.cn; zxx@pku.edu.cn; Fax: +86-10-62754112; Tel: +86-10-62754112
First published on 23rd January 2018
Abstract
Fluoroquinolones (FQs) are a class of synthetic antibiotics with a broad active spectrum towards mycoplasma and bacteria (both Gram positive and negative). The contamination of environmental water samples with FQs has been a concern due to the extensive use of them in the veterinary and pharmaceutical industries. Reliable and simple analytical methods are needed for the monitoring of these FQs. An off-line procedure of immunoaffinity extraction (IAE) followed by capillary electrophoresis-mass spectroscopy (CE-MS) has been developed for simultaneous determination of eight typical FQs in environment water. A broad-specific polyclonal antibody was home-prepared and immobilized on a Sepharose 4B stationary phase for sample affinity extraction and the enrichment factor of our columns was about 100. CE-MS was subsequently applied to FQs separation and quantification. The immunoaffinity column was evaluated in the parameters of selectivity, binding capacity, elution protocol, and recovery. Under the optimized conditions, the developed method was successfully applied to analyze FQs spiked with 2.5 nM to 30 nM of environmental water from a local lake, providing satisfactory recoveries from 72% to 112%, and LODs and LOQs ranging from 1.2 nM to 5.0 nM and 4.0 nM to 17 nM, respectively.
1. Introduction
Fluoroquinolones (FQs) are a group of synthetic antibiotics, which are derived from quinolone nalidixic acid by introduction of a fluorine atom at position 6 and a piperazine moiety at position 7![[thin space (1/6-em)]](https://www.rsc.org/images/entities/char_2009.gif) 1 (ESI Table S1†). Since the first introduction of FQs for human use in the 1970s2 and therapeutic treatment of livestock in the mid-1990s,3 they have become the most commonly prescribed antibiotics because of their broad activity spectrum towards mycoplasma, Gram-positive and Gram-negative bacteria.4 However, due to the extensive use of FQs, they enter environmental water via human excretion into wastewater or dispersion of manure onto agricultural soils, which could probably cause allergic reactions in humans and the emergence of food-borne bacteria.1 The development of robust and sensitive methods to monitor FQ residues in environmental water is necessary.
1 (ESI Table S1†). Since the first introduction of FQs for human use in the 1970s2 and therapeutic treatment of livestock in the mid-1990s,3 they have become the most commonly prescribed antibiotics because of their broad activity spectrum towards mycoplasma, Gram-positive and Gram-negative bacteria.4 However, due to the extensive use of FQs, they enter environmental water via human excretion into wastewater or dispersion of manure onto agricultural soils, which could probably cause allergic reactions in humans and the emergence of food-borne bacteria.1 The development of robust and sensitive methods to monitor FQ residues in environmental water is necessary.
Different techniques for FQs determination in aquatic environment have been developed such as high performance liquid chromatography with fluorescence detection (HPLC-FD),5–8 immunoassay,9,10 HPLC with ultraviolet (UV)11 or mass spectroscopy (MS)12,13 detection, capillary electrophoresis (CE) both with UV14,15 or FD,16 and flow injection method with chemiluminescence detection.17 In our previous work,18 we detected five typical FQs in low-fat milk by field-enhanced sample injection-based CE in bubble cell capillary. As an online sample stacking strategy to overcome the low loading capacity of CE, field-enhanced sample injection was performed at the boundary of sample matrix with low-conductivity and the background electrolyte (BGE) zone with high-conductivity. That's to say such a developed method is not suitable to detect FQs in high-salt contained matrix like environmental water. Among those, immunoassay and methods using optical detectors did not provide structure confirmatory analysis, while the instrument-based methods combining separation techniques and MS identification require an effective sample cleanup procedure to remove the complex matrix interference and extract the analytes.
The reported cleanup methods for FQs include solid phase extraction (SPE),6,11,12,15 pressurized liquid extraction (PLE),19,20 matrix solid-phase dispersion (MSPD),21,22 microwave-assisted extraction,23,24 microdialysis.25 The most common used SPE was reverse-phase SPE based upon the hydrophobic interaction between the analytes and the sorbents, which was lack of selectivity, leading to the co-extraction of analytes and matrix interference, especially when interested analytes are at trace levels and interference at higher concentration. A special SPE, named immunoaffinity extraction (IAE) based on the highly specific recognition between antigen and antibody, allows for a high degree of molecular selectivity.26 IAE was generally realized by loading a large volume of the sample into the immunoaffinity column and afterwards washing the unbounded or nonspecifically adsorbed interferences, eluting the specifically captured compounds for the subsequent qualitative or quantitative analysis. This strategy has been applied in environmental monitoring,27,28 pharmaceutical and biomedical analysis,29–31 and food analysis.32,33 As a specific extraction technique, IAE has been successfully used to online enrich four FQs in milk34 prior to HPLC-FD, providing a satisfactory enrichment with good selectivity.
In this work, a generic antibody for a group of immunological similar FQs was prepared for immunoaffinity column formation to simultaneously extract those FQs analogs selectively. By combining IAE and CE-MS, detecting 8 FQs simultaneously was achieved. Samples were specifically purified and concentrated by IAE. The eluent from immunoaffinity column was concentrated and subsequently analyzed by CE-MS. We applied this method to determine FQs spiked water sample from a local lake. The LODs ranged from 1.2 nM to 5.0 nM, which matched the result of the National standard method, HPLC-FD, with the advantages at simplicity and structural specificity.
2. Experimental section
2.1 Reagents and solutions
Bovine serum albumin (BSA), ovalbumin (OVA), Tween-20, incomplete Freund's adjuvant, and complete Freund's adjuvant were purchased from Sigma (St. Louis, MO, USA). N-Hydroxysuccinimide (NHS) and 1-(3-dimethylaminopropyl)-3-ethyl carbodiimide (EDC) were from Alfa Aesar (Johnson Matthey, USA). 3,3′,5,5′-Tetramethylbenzidine (TMB), and horseradish peroxidase labeled goat anti-rabbit IgG (HRP-SecAb) were obtained from Balb Corp. (Beijing, China). Defatted milk was purchased from the local supermarket. Ciprofloxacin (CIP) and enrofloxacin (ENR) were from TCI (Tokyo, Japan), and pefloxacin (PEF), ofloxacin (OFL), gatifloxacin (GAT), fleroxacin (FLE), lomefloxacin (LOM) and enoxacin (ENO) from National Institutes for Food and Drug Control (Beijing, China). Methanol was of HPLC grade and obtained from Avantor (Avantor Performance Materials, Inc. USA). All other chemicals, including formic acid (FA), acetic acid (AA), ethylenediamine (EDA), hydrogen peroxide (H2O2), quinine (QUIN), and ethylenediamine (EDA) were of analytical grade or better and obtained from Beijing Chemical Reagent Co. (Beijing, China). Unless specified, all buffers were prepared in high purity water from a Milli-Q purification system (Millipore, Bedford, MA, USA).In enzyme-linked immunosorbent assay (ELISA), 0.01 M phosphate buffered saline (PBS, pH 7.4) was prepared. 0.05 M Na2CO3–NaHCO3 (CBS, pH 9.6) was used as coating buffer. Blocking solution was made by dissolving 5 g of milk in 100 mL of PBS, and washing buffer (PBST) consisted of 250 μL of Tween-20 and 500 mL of PBS. The substrate solution was prepared before use by mixing 0.1 M phosphate buffer (PB, pH 6.0), TMB (6 mg mL−1 in DMSO) and H2O2 (30%) at a volume ratio of 1000:20:2.
Stock solutions of the above mentioned FQs and QUIN were prepared in 20 mM NaOH or 1 mM HCl at a concentration of 10 mM and stored at −20 °C. The working solutions were prepared by diluting the stock solutions with assay buffer.
2.2 Apparatus
CE was performed using a PA 800 plus System (Beckman Coulter Inc., USA) equipped with a UV detector. MS analyses were realized by a 6320 Ion Trap (Agilent Technologies Inc., USA) with a commercial ESI source. The coupling of CE to MS was carried out using a G1608A Agilent CE-MS sprayer kit (Agilent Technologies Inc., USA), which is arranged orthogonally to MS inlet capillary and constituted of a triple-tube design accommodating one tube for separation capillary, one for sheath liquid delivery and another one to provide the nebulizing gas. All UV absorbance was measured on a HITACHI U-4100 spectrophotometer (Tokyo, Japan), and all polystyrene 96-well microtiter plates (Costar, USA) were read on Multiskan FC Microplate Photometer (Thermo Fisher Scientific, Waltham, MA, USA).2.3 Preparation and characterization of broad-specific antibody against FQ analogs
:5000 diluted) for 1 h at 37 °C, then with 100 μL substrate solution added to react for 15 min in dark. The enzyme reaction was stopped by 50 μL of 2 M H2SO4 before the absorbance of each well read at 450 nm.The affinity constant was estimated in the process of optimizing coating concentration using the equation presented by Beatty.38
2.4 Preparation of immunoaffinity column
The immunoaffinity column was prepared according to the method reported before.29 0.3 g CNBr-activated Sepharose 4B was swelled and washed with 1 mM HCl, and then dispersed in 5 mL coupling buffer (0.1 M NaHCO3, 0.5 M NaCl, pH 8.3) containing 18 mg pAb. The coupling of pAb to Sepharose 4B was performed in a rotated vessel for 2.5 h at room temperature. After the slurry was transferred into an injector (5 cm × 0.7 cm id), the excess antibody was removed from the column by eluting with the coupling buffer. The unreacted groups in the gel were blocked with 0.1 M Tris–HCl buffer (pH 8.0) at room temperature for 2 h. The column was then washed for three times by repeating the cycles of 5 mL of 0.1 M NaAc–HAc buffer (containing 0.5 M NaCl, pH 4.0) followed by 5 mL of 0.1 M Tris–HCl buffer (containing 0.5 M NaCl, pH 8.0). 0.01 M PBS was finally applied for the column equilibration and preservation.2.5 Procedure of immunoaffinity solid-phase extraction
10 mL sample was loaded on the immunoaffinity column, which has already been conditioned with 0.01 M PBS. The column was then washed with 3 mL PBS to remove the nonspecifically captured analytes and subsequently washed by 3 mL water to reduce the negative effect of salt on CE-MS. After eluting the immunoaffinity column with 5 mL methanol, the collected effluent was concentrated to about 1 mL by high purity nitrogen and transferred to centrifugal vacuum concentrator (Eppendorf, Germany) for further concentration and drying. The extracted analyte was re-dissolved in deionized water (100 μL) before the following CE-MS analysis.2.6 CZE separation coupled with ESI-MS detection
Fused-silica capillaries (50/375 μm id/od, 40/50 cm effective/total length) (Ruifeng Inc., Hebei, China) were used for FQs separation. Capillary zone electrophoresis conditions were set as follows: applied voltage, 25 kV; sample injection, 0.5 psi for 5 s; capillary temperature, 25 °C. All data were collected at 280 nm. Before the first use, the capillaries were conditioned by sequentially rinsing by 20 psi with 1 M NaOH for 30 min, deionized water for 15 min and running buffer for 5 min. Between consecutive analyses, the capillary was only rinsed with running buffer for 4 min. The running buffer was 50 mM EDA-FA (pH 8.0).When MS was hyphenated with CE via a coaxial sheath liquid interface for post-column detection, the length of the fused-silica capillary was extended to 65 cm. The sheath liquid was composed of methanol/water (50:50 v/v) containing 0.1% (v) FA, and introduced at a flow rate of 5 μL min−1 by a syringe pump. An electrospray potential of −4.0 kV was applied at the inlet of the MS (positive mode) while the CE-MS interface was grounded. A nebulizing gas pressure of 5.0 psi was provided to assist the spraying. Drying gas temperature and flow were set at 270 °C and 2.0 L min−1, respectively.
Unless specified, all solutions for CE-MS were filtered through 0.22 μm membrane and degassed by ultrasonication before use.
2.7 Real sample analysis
Fresh water was collected from Weiming Lake at Peking University (Beijing, China), and used to dilute the standard FQs solution to defined concentrations. FQs spiked samples were immediately filtered through 0.22 μm cellulose nitrate membrane filters (Jinteng, China) before extraction in order to prevent the influence of the matrix from fresh water on immunoaffinity column. The blank water sample and the spiked real samples (both in 10 mL) were performed in the same way by the developed IAC and CE-MS off-line coupling procedure.3. Results and discussion
3.1 Synthesis of artificial antigen
Antigen designing plays the most crucial role in antibody preparation, especially in the case of producing a broad-specific antibody. Herein, our aim lies in preparing an antibody that could immunologically recognize eight FQs and developing an immunoaffinity solid-phase extraction system for simultaneous enrichment of these FQs. Thus, the hapten, which was proposed to conjugate with a carrier protein to generate an immunogen for antibody selection, should retain the most of common structural features in FQ analogs. One or more FQs has been reported to be used as a hapten to produce a generic antibody,1 and CIP might be the desirable hapten considering its availability and reliability. The immunogen, CIP-BSA, was prepared through CIP conjugated to BSA with the NHS method and the coating antigen was prepared through CIP coupled with OVA in the same way. The conjugation ratio of CIP and BSA was estimated to be 11.7 via the molecule weights of BSA (66.4 kDa) and its conjugation with CIP (70.3 kDa).3.2 Antibody characterization
The purified polyclonal antibody was assessed by ELISA in the respect of titer level, affinity constant and cross-reaction.The initial concentrations (C0) of the antibody was 16 mg mL−1 by UV measurement. The optimal concentration for coating was estimated by coating the microtiter plates with 100 μL CIP-OVA of different concentrations (2 μg mL−1, 4 μg mL−1, 5 μg mL−1, 6 μg mL−1, 8 μg mL−1 and 10 μg mL−1). According to the shape of sigmoid curves in Fig. 1(a), 8 μg mL−1 was chosen as optimal concentration for CIP-OVA coating, and the titer of this purified pAb was 1:104.8 (pAb dilution corresponding to 50% of the maximum absorbance).
 | ||
| Fig. 1 (a) Coating concentration optimization of CIP-OVA and titer level determination of antibody by ELISA. (b) Cross-reactivities of pAb with eight FQ analogs by competitive ELISA (QUIN as control test). | ||
Affinity constant (Kaff) of antibody represents the combination stability of immunocomplex. Herein, Kaff of pAb with CIP-OVA can be calculated as 1.53 × 10⁷ L mol−1 in the optimization procedure of the coating concentration, which was high enough for immunoaffinity enrichment.
The broad-specificity of antibody was determined by a screening competitive ELISA (Fig. 1(b)) and calculated according to 50% displacement method.39 The microtiter plates were coated with 100 μL CIP-OVA (8 μg mL−1). The purified pAb was diluted by 104-fold before addition (50 μL per microwell). The initial concentrations (C0) of the analytes (including QUIN for control test) were 0.1 mM. The cross-reactivity of this purified pAb with CIP was defined as 100%, and it was found to be 10% with PEF, 10% with OFL, 10% with GAT, 10% with FLE, 8% with LOM, 10% with NOR, 8% with ENO, and 100% with ENR, indicating its broad-specificity to all these eight FQs.
3.3 Evaluation of the immunoaffinity column
The total amount of pAb immobilized in 0.3 g of CNBr-Sepharose 4B was estimated to be 17.7 mg (59 mg g−1) by measuring the concentrations of pAb before and after the coupling reaction. The final gel volume of the affinity column (dead volume) was about 2.0 mL. In order to investigate retention behavior of CIP in the immunoaffinity column, breakthrough curve of CIP (0.4 μg mL−1 in PBS) was compared with that of QUIN (0.4 μg mL−1 in PBS). As shown in Fig. 2(a), QUIN was detected in the first effluent fraction after discarding the dead volume of 2.5 mL. In contrast, CIP was strongly retained in the column, and the breakthrough of CIP was not observed until 5.5 mL, which demonstrated the specific retention of CIP in the immunoaffinity column. Binding capacity, another critical parameter in immunoaffinity column, is defined as the maximal amount of antigen captured by immobilized antibodies, and overloading the capacity would lower the accuracy of quantitative analysis. The theoretical binding capacity was calculated to be 20 μg according to the amount of immobilized antibody and its two antigen binding sites without consideration of the antibody inactivation. Otherwise, the experimental value of binding capacity was obtained as 1.03 μg by overloading the column with CIP (20 μg, 1 mL) and measuring the uncaptured (washed by PBS) or captured (eluted by methanol) target. It was much lower than the theoretical one, mainly resulted from the steric hindrance between analyte and antibody, as well as the random orientation and inactivation of the antibody.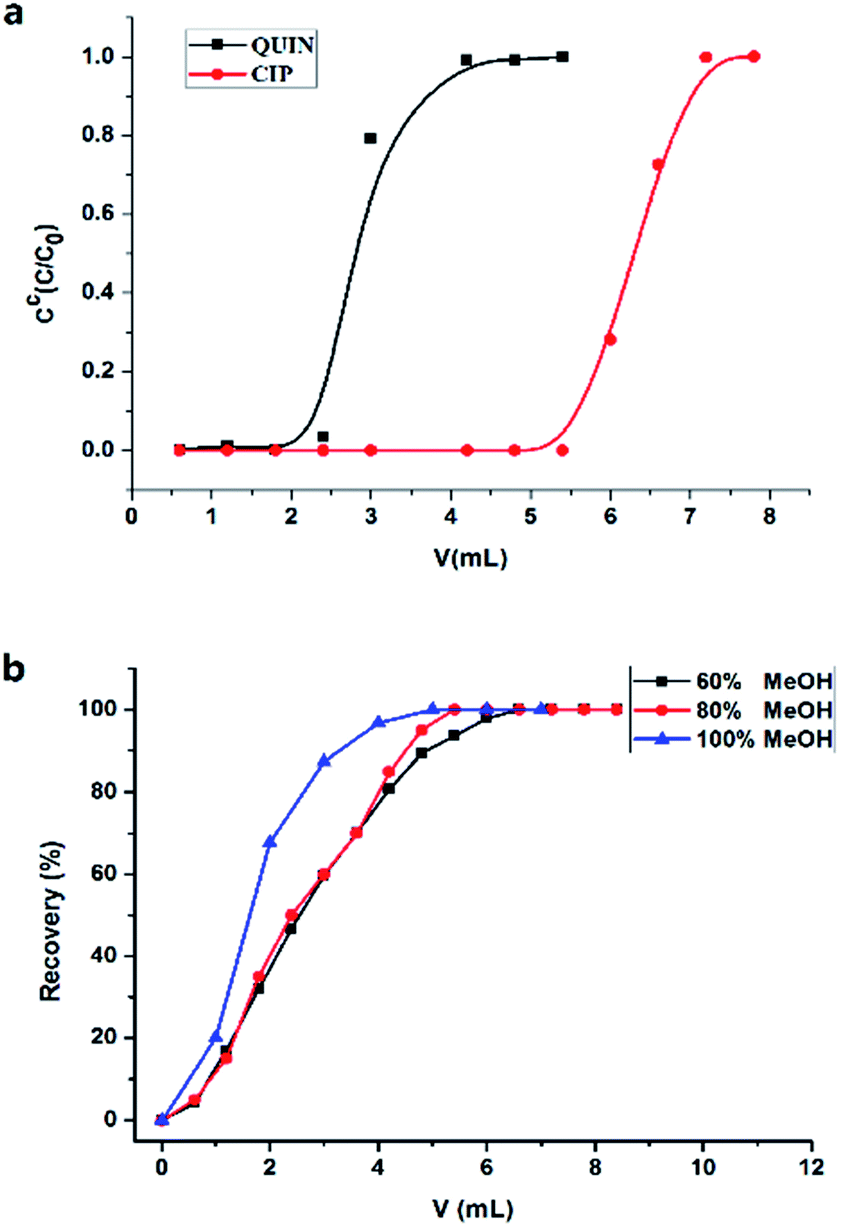 | ||
| Fig. 2 (a) Breakthrough curves of CIP and QUIN obtained in anti-CIP pAb immobilized column. Sample concentration was 0.4 μg mL−1 both for CIP and QUIN. (b) Elution profiles of CIP with different percent of methanol. | ||
3.4 Elute conditions
The antigen–antibody complex, formed via electrostatic forces, hydrogen bonds and van der Waals forces, was generally disrupted by low-pH solution or water–organic modifier mixture to dissociate the analytes without adversely affecting the immunological activity of antibodies. Here, high percentage of an organic solvent was chosen to dissociate captured small molecules efficiently considering the following two aspects. First, a large volume of low-pH solution was required for complete dissociation29 which was not suitable for off-line procedure. In addition, the volatility of organic solvent would make the off-line pre-concentration easier for the subsequent CE-MS analysis. The actual methanol concentration needed relied on the affinity constant between the analytes and the immobilized antibody. Thus, different percentages of methanol in water (60%, 80%, 100%) were investigated to make a compromise between complete elution of the analytes and minimal damage to the antibody. After the immuno-capture of CIP (20 μg mL−1), the elution fraction was collected in one Eppendorf tube after another and detected by UV respectively. The recovery of target compound increased with the solvent volume for eluting (Fig. 2(b)). All captured compound was completely eluted under three conditions, demonstrating a good target release performance. Nevertheless, the total volume of water–methanol mixture required for thorough dissociation decreased along with the increasing of methanol percentage. Moreover, the immobilized antibody was not observed to be damaged even when 100% methanol was applied for elution owing to the short exposing time of the antibody to organic solvent. Decrease of enrichment efficiency of our columns was not observed after about 50 times use. For the process efficiency and simplicity, 100% methanol was chosen as the optimum elution solvent. The elution volume was increased to be 5 mL rather than 4 mL to ensure a complete dissociation of the immuno-complexes of analytes and immobilized antibody.3.5 CZE separation with UV or MS detection for quantitative analysis
Basic BGE is generally reported for FQs separation.15,40 Considering its compatibility with ESI-MS, the BGE should be constituted of volatile salts such as ammonium carbonate.41 However, FQs cannot be separated completely by using ammonium carbonate. Recently, BGE based on EDA with pH 8.0 adjusted by FA18 was proposed as volatile and compatible with MS system for FQs separation. FQs were detected in positive mode in CE-MS and quantitative ions for MS detection were listed in Table S1.† As indicated in Fig. 3(a), the considered eight FQs can be basely separated under optimized conditions within 15 min both for UV and MS detection. Theoretically, CE-MS was more time-consuming than CE-UV due to its longer separation channel and lowered electric field intensity, which cannot be found in the electropherograms. This can be explained by the syphonic effect between the two ends of CE separation capillary when there was no outlet vial assembled in CE equipped with MS detector.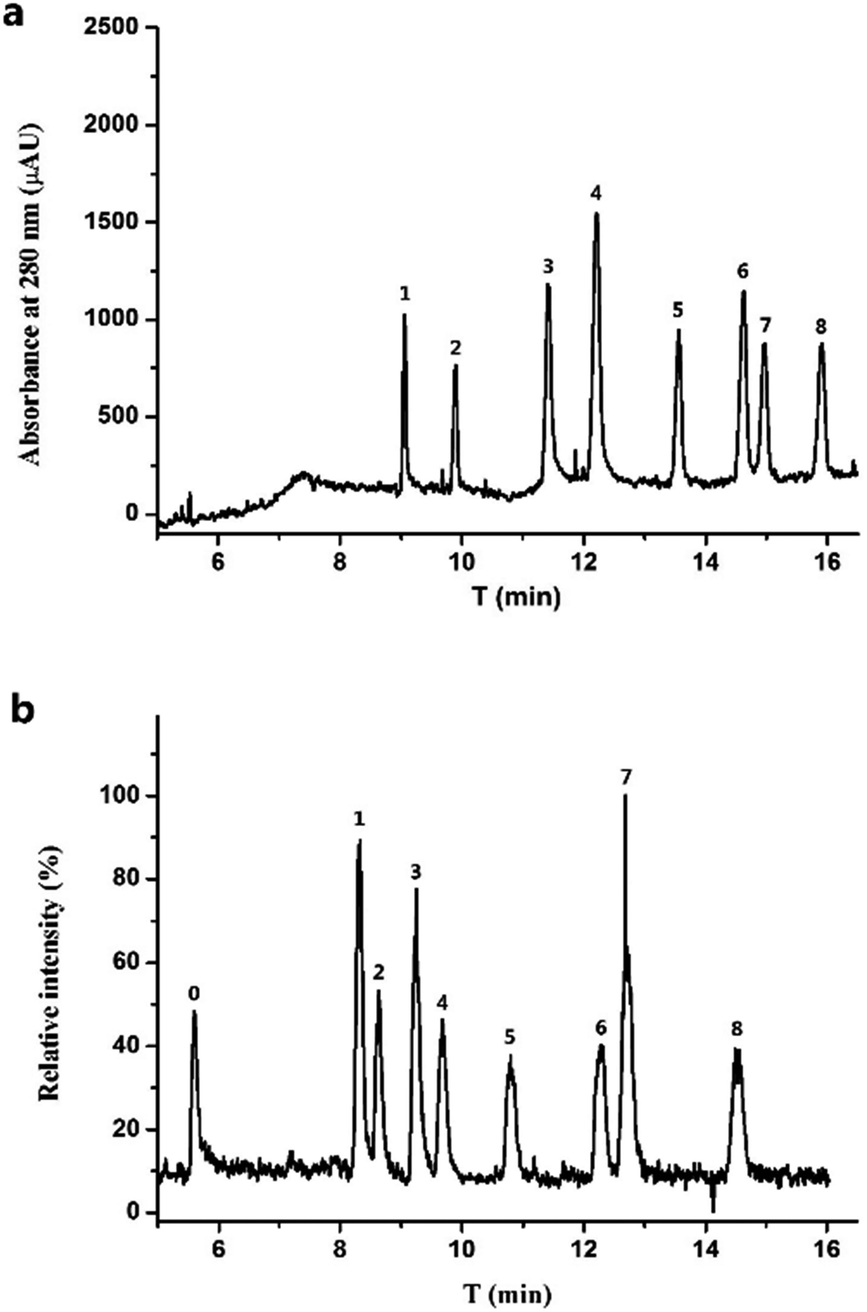 | ||
| Fig. 3 Electropherograms with UV detection (a) and MS detection (b) of eight FQs (20 μM for each) and QUIN (5 μM). Peaks are labelled as follows: QUIN as 0; GAT as 1; LOM as 2; ENO as 3; CIP as 4; OFL as 5; ENR as 6; FLE as 7; PEF as 8. | ||
The mixtures of eight FQs at different concentrations were prepared and analyzed both by CE-UV and CE-MS to investigate the linearity of the proposed procedure. The dependence of FQs peak heights (obtained in CE-UV) and peak areas (obtained in CE-MS) on their concentrations were fitted linearly, respectively, and presented in Table 1. The LODs (3 S/N) and LOQs (10 S/N) were calculated and summarized in Table 1, which demonstrated that the LODs obtained in CE-MS were 10 to 40 times lower for different FQs than those in CE-UV. Thus, combining CE-MS of such an improved sensitivity with immunoaffinity extraction for enrichment provided a potential way to monitor the trace FQs in environmental water.
| FQs | CE-MS | CE-UV | ||||
|---|---|---|---|---|---|---|
| Calibration curves | Calibration range (μM) | LOD/LOQ (μM) | Calibration curves | Calibration range (μM) | LOD/LOQ (μM) | |
| GAT | y = 4.89 × 10⁶x + 7.96 × 10⁴, R2 = 0.998 | 0.16–20 | 0.050/0.16 | y = 24.7x + 39.2, R2 = 0.998 | 1.9–60 | 0.60/1.9 |
| LOM | y = 2.45 × 10⁶x + 1.11 × 10⁵, R2 = 0.998 | 0.25–20 | 0.075/0.25 | y = 26.4x + 10.1, R2 = 0.999 | 5.6–60 | 1.7/5.6 |
| ENO | y = 4.95 × 10⁶x − 1.12 × 10⁵, R2 = 0.996 | 0.16–20 | 0.050/0.16 | y = 14.6x + 6.2, R2 = 0.999 | 11–60 | 3.4/11 |
| CIP | y = 2.77 × 10⁶x + 4.96 × 10⁵, R2 = 0.997 | 0.25–20 | 0.075/0.25 | y = 22.6x − 12.3, R2 = 0.999 | 10–60 | 3.0/10 |
| OFL | y = 2.33 × 10⁶x + 9.61 × 10⁴, R2 = 0.998 | 0.50–20 | 0.15/0.50 | y = 26.5x + 14.7, R2 = 0.999 | 5.0–60 | 1.5/5.0 |
| FLE | y = 2.77 × 10⁶x + 3.55 × 10⁵, R2 = 0.999 | 0.33–20 | 0.10/0.33 | y = 26.8x + 17.3, R2 = 0.999 | 4.3–60 | 1.3/4.3 |
| ENR | y = 5.16 × 10⁶x + 2.04 × 10⁵, R2 = 0.999 | 0.33–20 | 0.10/0.33 | y = 30.0x + 9.2, R2 = 0.999 | 5.0–60 | 1.5/5.0 |
| PEF | y = 3.22 × 10⁶x + 1.23 × 10⁵, R2 = 0.999 | 0.33–20 | 0.10/0.33 | y = 21.4x + 39.2, R2 = 0.998 | 6.6–60 | 2.0/6.6 |
3.6 Environmental water analysis
Organics in environmental samples are generally in trace level and IAE provides an attractive approach to enrich structurally closed analytes in a small volume by off-line being coupled with a chromatographic step for separation. Herein, an evaluated immunoaffinity column was utilized for FQs extraction from spiked lake water and the developed CE-MS was applied for the subsequent qualitative and quantitative analysis. The environmental water samples were simultaneously spiked with eight FQs at different concentrations (30 nM, 15 nM, 5 nM and 2.5 nM, respectively) (Fig. 4). As indicated in Table 2, the presented procedure provided excellent recovery values from 72% to 112% and satisfying RSDs between 1.4% and 17%. Considering the recovery and the difference of the volume of sample (10 mL) loaded in immunoaffinity column and the volume of re-dissolved sample (100 μL) for CE-MS analysis, the enrichment factor of our columns was about 100 times. The LODs ranging from 1.2 nM for GAT to 5.0 nM for FLE, were comparable or much better than those of reported reverse-phase SPE followed by HPLC-FD,42 HPLC-MS,43,44 immunoassay10 and CE-based method.14,45 It's far below the permissible MRL established by European Union. Although the immunoaffinity column was more expensive, it could significantly improve the specificity of extraction step and be used for many times (maybe more than 50 times).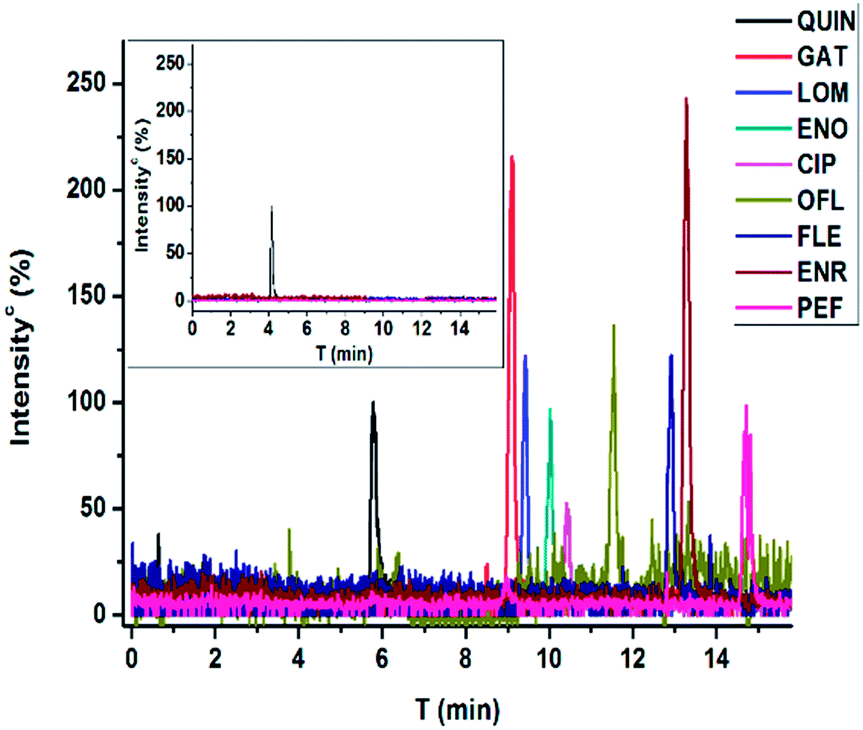 | ||
| Fig. 4 Electropherograms with MS detection (extracted ion chromatography) for FQs spiked lake water (30 nM for FQs and 5 μM for QUIN). The inset is the blank water sample for control. | ||
| FQs | Spiked environmental water samples (n = 3) | LOD/LOQ (nM) | |||||||
|---|---|---|---|---|---|---|---|---|---|
| 30 nM | 15 nM | 5 nM | 2.5 nM | ||||||
| Recovery (%) | RSD (%) | Recovery (%) | RSD (%) | Recovery (%) | RSD (%) | Recovery (%) | RSD (%) | ||
| GAT | 102 | 7.1 | 98.2 | 5.1 | 88.7 | 9.4 | 88 | 13.6 | 1.2/4.0 |
| LOM | 111 | 1.4 | 101 | 7.4 | 108 | 12.1 | 72 | 16.7 | 2.5/8.3 |
| ENO | 99.6 | 2.9 | 103 | 7.9 | 96.7 | 3.2 | <LOD | ND | 3.0/10 |
| CIP | 103 | 2.4 | 108 | 13.2 | 72.0 | 8.3 | <LOD | ND | 3.0/10 |
| OFL | 107 | 12 | 99 | 5.9 | 74 | 15 | <LOD | ND | 3.0/10 |
| FLE | 112 | 9.7 | 75 | 2.1 | <LOD | ND | <LOD | ND | 5.0/17 |
| ENR | 102 | 2.7 | 96.9 | 2.4 | 95.3 | 11.6 | 107 | 9.4 | 1.2/4.0 |
| PEF | 103 | 6.1 | 103 | 5.7 | 88.7 | 4.7 | <LOD | ND | 2.5/8.3 |
4. Conclusions
The presented off-line coupling of IAE with CE-MS was successfully utilized for FQs determination in fresh water collected from a local lake, demonstrated to be stable, sensitive and reliable. A generic polyclonal antibody was prepared and developed to construct an immunoaffinity column for simultaneous extraction and concentration of FQs with similar structure in environmental water. For further qualitative identification and quantitative determination, the hyphenation of CE-MS was applied for high-resolution separation and high-sensitivity detection of eight FQs in a single analysis. The satisfactory recoveries of all FQs between 72% and 112% shows the usefulness the broad-specificity of the antibody, and the obtained LODs are in range of 1.2 nM to 5.0 nM, comparable with that of the widely recommended HPLC-FD. Moreover, the proposed analytical technique can be easily extended to the analysis of FQs in soil or food sample at trace level by adding another sample cleanup step, such as extraction, filtration or centrifugation prior to IAE.Conflicts of interest
There are no conflicts to declare.Acknowledgements
This work was financially supported by National Natural Science Foundation of China (no. 21575005, 21675004 and 21275009). The author would also like to thank Professor Zhenquan Guo from Lab of Monoclonal Antibody at Peking University for his kind help in antibody preparation.Notes and references
- Z. H. Wang, Y. Zhu, S. Y. Ding, F. Y. He, R. C. Beier, J. C. Li, H. Y. Jiang, C. W. Feng, Y. P. Wan, S. X. Zhang, Z. P. Kai, X. L. Yang and J. Z. Shen, Development of a monoclonal antibody-based broad-specificity ELISA for fluoroquinolone antibiotics in foods and molecular modeling studies of cross-reactive compounds, Anal. Chem., 2007, 79(12), 4471–4483 CrossRef CAS PubMed.
- D. Greenwood, Activity of flumequine against Escherichia coli: in vitro comparison with nalidixic and oxolinic acids, Antimicrob. Agents Chemother., 1978, 13(3), 479–483 CrossRef CAS PubMed.
- D. Cid, S. Piriz, J. A. Ruiz-Santa-Quiteria, J. Valle, S. Garcia, S. Vadillo and R. de la Fuente, In vitro activities of enoxacin, enrofloxacin, sparfloxacin, and ciprofloxacin against Escherichia coli strains isolated from diarrheic lambs and kids, Antimicrob. Agents Chemother., 1994, 38(10), 2469–2470 CrossRef CAS PubMed.
- A. Speltini, M. Sturini, F. Maraschi and A. Profumo, Fluoroquinolone antibiotics in environmental waters: sample preparation and determination, J. Sep. Sci., 2010, 33(8), 1115–1131 CAS.
- C. K. Holtzapple, S. A. Buckley and L. H. Stanker, Immunosorbents coupled on-line with liquid chromatography for the determination of fluoroquinolones in chicken liver, J. Agric. Food Chem., 1999, 47(7), 2963 CrossRef CAS PubMed.
- M. Sturini, A. Speltini, L. Pretali, E. Fasani and A. Profumo, Solid-phase extraction and HPLC determination of fluoroquinolones in surface waters, J. Sep. Sci., 2009, 32(17), 3020–3028 CrossRef CAS PubMed.
- K. He and L. Blaney, Systematic optimization of an SPE with HPLC-FLD method for fluoroquinolone detection in wastewater, J. Hazard. Mater., 2015, 282(4), 96–105 CrossRef CAS PubMed.
- D. Ašperger, V. Tišler, M. Zrnčić, D. M. Pavlović, S. Babić, A. J. M. Horvat and M. Kaštelan-Macan, HPLC-DAD-FLD determination of veterinary pharmaceuticals in pharmaceutical industry wastewater with precolumn derivatization using fluorescamine, Chromatographia, 2014, 77(15–16), 1059–1066 Search PubMed.
- S. M. Khor, G. Liu, J. R. Peterson, S. G. Iyengar and J. J. Gooding, An electrochemical immunobiosensor for direct detection of veterinary drug residues in undiluted complex matrices, Electroanalysis, 2011, 23(8), 1797–1804 CrossRef CAS.
- Z. Zhang, J.-f. Liu, T.-t. Feng, Y. Yao, L.-h. Gao and G.-b. Jiang, Time-Resolved Fluoroimmunoassay as an Advantageous Analytical Method for Assessing the Total Concentration and Environmental Risk of Fluoroquinolones in Surface Waters, Environ. Sci. Technol., 2013, 47(1), 454–462 CrossRef CAS PubMed.
- B. Chen, W. Wang and Y. Huang, Cigarette filters as adsorbents of solid-phase extraction for determination of fluoroquinolone antibiotics in environmental water samples coupled with high-performance liquid chromatography, Talanta, 2012, 88(1), 237–243 CAS.
- M. Lombardoagüí, C. Crucesblanco, A. M. Garcíacampaña and L. Gámizgracia, Multiresidue analysis of quinolones in water by ultra-high performance liquid chromatography with tandem mass spectrometry using a simple and effective sample treatment, J. Sep. Sci., 2014, 37(16), 2145 CrossRef PubMed.
- E. Gracia-Lor, J. V. Sancho and F. Hernández, Multi-class determination of around 50 pharmaceuticals, including 26 antibiotics, in environmental and wastewater samples by ultra-high performance liquid chromatography-tandem mass spectrometry, J. Chromatogr. A, 2011, 1218(16), 2264 CrossRef CAS PubMed.
- A. V. Herrera-Herrera, J. Hernández-Borges, T. M. Borges-Miquel and M. Á. Rodríguez-Delgado, Dispersive liquid–liquid microextraction combined with nonaqueous capillary electrophoresis for the determination of fluoroquinolone antibiotics in waters, Electrophoresis, 2010, 31(20), 3457–3465 CrossRef CAS PubMed.
- A. V. Herrera-Herrera, L. M. Ravelo-Perez, J. Hernandez-Borges, M. M. Afonso, J. A. Palenzuela and M. A. Rodriguez-Delgado, Oxidized multi-walled carbon nanotubes for the dispersive solid-phase extraction of quinolone antibiotics from water samples using capillary electrophoresis and large volume sample stacking with polarity switching, J. Chromatogr. A, 2011, 1218(31), 5352–5361 CrossRef CAS PubMed.
- M. Ferdig, A. Kaleta, T. D. Vo and W. Buchberger, Improved capillary electrophoretic separation of nine (fluoro)quinolones with fluorescence detection for biological and environmental samples, J. Chromatogr. A, 2004, 1047(2), 305 CrossRef CAS PubMed.
- M. D. Luaces, J. L. Urraca, M. C. Pérez-Conde, N. C. M. Alfonso, A. C. Valdés-González, A. M. Gutiérrez and M. C. Moreno-Bondi, Chemiluminescence analysis of enrofloxacin in surface water using the tris(1,10-phenanthroline)–ruthenium(II)/peroxydisulphate system and extraction with molecularly imprinted polymers, Microchem. J., 2013, 110(9), 458–464 CrossRef CAS.
- Y. Deng, N. Gasilova, L. Qiao, Y. L. Zhou, X. X. Zhang and H. H. Girault, Highly sensitive detection of five typical fluoroquinolones in low-fat milk by field-enhanced sample injection-based CE in bubble cell capillary, Electrophoresis, 2014, 35(23), 3355 CrossRef CAS PubMed.
- M. Lillenberg, S. Yurchenko, K. Kipper, K. Herodes, V. Pihl, K. Sepp, R. Lõhmus and L. Nei, Simultaneous determination of fluoroquinolones, sulfonamides and tetracyclines in sewage sludge by pressurized liquid extraction and liquid chromatography electrospray ionization-mass spectrometry, J. Chromatogr. A, 2009, 1216(32), 5949 CrossRef CAS PubMed.
- J. Radjenović, A. Jelić, M. Petrović and D. Barceló, Determination of pharmaceuticals in sewage sludge by pressurized liquid extraction (PLE) coupled to liquid chromatography-tandem mass spectrometry (LC-MS/MS), Anal. Bioanal. Chem., 2009, 393(6–7), 1685–1695 CrossRef PubMed.
- W. Bąk, I. M. Choma and B. Majer-Dziedzic, Matrix solid-phase dispersion combined with thin-layer chromatography-direct bioautography for determination of flumequine residues in milk: improvement of the method, J. Liq. Chromatogr. Relat. Technol., 2011, 34(10–11), 920–927 CrossRef.
- D. Li, Q. Yang, Z. Wang, R. Su, X. Xu and H. Zhang, Determination of fluoroquinolones in blood by matrix solid-phase dispersion extraction and CE, J. Sep. Sci., 2011, 34(7), 822–829 CrossRef CAS PubMed.
- N. Dorivalgarcía, A. Zafragómez, F. J. Caminosánchez, A. Navalón and J. L. Vílchez, Analysis of quinolone antibiotic derivatives in sewage sludge samples by liquid chromatography-tandem mass spectrometry: comparison of the efficiency of three extraction techniques, Talanta, 2013, 106(6), 104–118 CrossRef PubMed.
- A. Speltini, M. Sturini, F. Maraschi, A. Profumo and A. Albini, Microwave-assisted extraction and determination of enrofloxacin and danofloxacin photo-transformation products in soil, Anal. Bioanal. Chem., 2012, 404(5), 1565–1569 CrossRef CAS PubMed.
- E. Cohen, R. J. Maxwell and D. J. Donoghue, Automated multi-residue isolation of fluoroquinolone antimicrobials from fortified and incurred chicken liver using on-line microdialysis and high-performance liquid chromatography with programmable fluorescence detection, J. Chromatogr. B: Biomed. Sci. Appl., 1999, 724(1), 137 CrossRef CAS.
- M. C. Hennion and V. Pichon, Immuno-based sample preparation for trace analysis, J. Chromatogr. A, 2003, 1000(1–2), 29–52 CrossRef CAS PubMed.
- L. E. Vera-Avila, B. P. Márquez-Lira, M. Villanueva, R. Covarrubias, G. Zelada and V. Thibert, Determination of carbofuran in surface water and biological tissue by sol–gel immunoaffinity extraction and on-line preconcentration/HPLC/UV analysis, Talanta, 2012, 88(1), 553 CrossRef CAS PubMed.
- Z. L. Xu, H. Deng, H. T. Lei, Y. M. Jiang, K. Campbell, Y. D. Shen, J. Y. Yang, H. Wang and Y. M. Sun, Development of a broad-specificity monoclonal antibody-based immunoaffinity chromatography cleanup for organophosphorus pesticide determination in environmental samples, J. Agric. Food Chem., 2012, 60(23), 5847–5852 CrossRef CAS PubMed.
- H. X. Chen, Q. P. Deng, L. W. Zhang and X. X. Zhang, Quantification of testosterone and epitestosterone in biological samples by capillary electrophoresis with immunoaffinity extraction, Talanta, 2009, 78(2), 464–470 CrossRef CAS PubMed.
- N. Delaunay-Bertoncini and M. C. Hennion, Immunoaffinity solid-phase extraction for pharmaceutical and biomedical trace-analysis-coupling with HPLC and CE-perspectives, Int. J. Pharm. Res. Biomed. Anal., 2004, 34(4), 717–736 CrossRef CAS.
- S. Soltani and A. Jouyban, Biological sample preparation: attempts on productivity increasing in bioanalysis, Bioanalysis, 2014, 6(12), 1691–1710 CrossRef CAS PubMed.
- K. Pavšič-Vrtač, S. Ojanperä, J. Apajalahti, K. Šrimpf and G. Tavčar-Kalcher, Analytical procedures for the determination of aflatoxin b1 in eggs of laying hens using immunoaffinity columns and liquid chromatography with post-column derivatisation and fluorescence detection, Food Anal. Method, 2014, 7(9), 1917–1924 CrossRef.
- H. Z. Senyuva and J. Gilbert, Immunoaffinity column clean-up techniques in food analysis: a review, J. Chromatogr. B: Anal. Technol. Biomed. Life Sci., 2010, 878(2), 115–132 CrossRef CAS PubMed.
- C. K. Holtzapple, S. A. Buckley and L. H. Stanker, Determination of four fluoroquinolones in milk by on-line immunoaffinity capture coupled with reversed-phase liquid chromatography, J. AOAC Int., 1999, 82(3), 607 CAS.
- T. L. Goodfriend, L. Levine and G. D. Fasman, Antibodies To Bradykinin And Angiotensin: A Use Of Carbodiimides In Immunology, Science, 1964, 144(3624), 1344 CAS.
- H. X. Chen and X. X. Zhang, Antibody development to testosterone and its application in capillary electrophoresis-based immunoassay, Electrophoresis, 2008, 29(16), 3406–3413 CrossRef CAS PubMed.
- M. P. Zhao, Y. Z. Li, Z. Q. Guo, X. X. Zhang and W. B. Chang, A new competitive enzyme-linked immunosorbent assay (ELISA) for determination of estrogenic bisphenols, Talanta, 2002, 57(6), 1205–1210 CAS.
- J. D. Beatty, B. G. Beatty and W. G. Vlahos, Measurement of monoclonal antibody affinity by non-competitive enzyme immunoassay, J. Immunol. Methods, 1987, 100(1–2), 173–179 CrossRef CAS PubMed.
- J. J. Pratt, Steroid immunoassay in clinical-chemistry, Clin. Chem., 1978, 24(11), 1869–1890 CAS.
- M. Y. Piñero, R. Garrido-Delgado, R. Bauza, L. Arce and M. Valcárcel, Easy sample treatment for the determination of enrofloxacin and ciprofloxacin residues in raw bovine milk by capillary electrophoresis, Electrophoresis, 2012, 33(19–20), 2978–2986 CrossRef PubMed.
- A. Juan-García, G. Font and Y. Picó, Determination of quinolone residues in chicken and fish by capillary electrophoresis-mass spectrometry, Electrophoresis, 2006, 27(11), 2240–2249 CrossRef PubMed.
- M. Petrovic, M. Gros and D. Barcelo, Multi-residue analysis of pharmaceuticals in wastewater by ultra-performance liquid chromatography-quadrupole-time-of-flight mass spectrometry, J. Chromatogr. A, 2006, 1124(1–2), 68–81 CrossRef CAS PubMed.
- M. P. Hermo, E. Nemutlu, S. Kır, D. Barrón and J. Barbosa, Improved determination of quinolones in milk at their MRL levels using LC-UV, LC-FD, LC-MS and LC-MS/MS and validation in line with regulation 2002/657/EC, Anal. Chim. Acta, 2008, 613(1), 98–107 CrossRef CAS PubMed.
- O. Szerkus, J. Jacyna, A. Gibas, M. Sieczkowski, D. Siluk, M. Matuszewski, R. Kaliszan and M. J. Markuszewski, Robust HPLC-MS/MS method for levofloxacin and ciprofloxacin determination in human prostate tissue, J. Pharm. Biomed. Anal., 2017, 132, 173–183 CrossRef CAS PubMed.
- M. Ferdig, A. Kaleta, T. D. T. Vo and W. Buchberger, Improved capillary electrophoretic separation of nine (fluoro)quinolones with fluorescence detection for biological and environmental samples, J. Chromatogr. A, 2004, 1047(2), 305–311 CrossRef CAS PubMed.
Footnote |
| † Electronic supplementary information (ESI) available. See DOI: 10.1039/c7ra12557g |
| This journal is © The Royal Society of Chemistry 2018 |