DOI:
10.1039/C7RA12629H
(Paper)
RSC Adv., 2018,
8, 3392-3398
Mechanism of byproducts formation in the isobutane/butene alkylation on HY zeolites
Received
21st November 2017
, Accepted 14th December 2017
First published on 17th January 2018
Abstract
Submicron-size HY zeolites with a particles size of 200–700 nm were synthesized employing a crystal precipitation method in this study. The catalytic activity for the isobutane/butene alkylation was evaluated. The results indicated that butene conversion was above 90% and the selectivity of expected products (C8) was nearly at 90% within 72 h. The micropores-blocking and coverage of acid sites resulting from high hydrocarbons increased the difficulty for the diffusion of products to the bulk and inhibited the adsorption of reactant on activity sites, which caused deactivation of catalyst. The ultimate C12 content in alkylate oil, stemmed from trimerization of butene, was reduced via the addition reaction with butene to C16 and the cracking to C5–C7. The formation mechanisms and transformation processes of byproducts in alkylate oil revealed that the source of C9–C11 switched from cracking of C16+ to the addition of C5–C7 carbocations with butene when acid sites concentration was reduced by accumulating oligomers.
1. Introduction
As a consequence of the strict environmental scrutiny and upgrading of vehicle technology, methyl-tert-butyl ether (MTBE) will gradually be replaced as it contaminates groundwater and harms human health by stimulating the central nervous system. Therefore, environment-friendly and high-octane replacements are considered as gasoline blending components. Such replacements mainly consists of isooctane meeting to the requirements of environment and fuel quality and can be produced via butene dimerization and subsequent hydrideation as well as isobutane/butene alkylation.1 Both these processes require conventionally used homogeneous and heterogeneous catalysts. The drawbacks of butene oligomerization are manifested in its complex process and lower butene conversion rate. In comparison, isobutane/butene liquid acid alkylation has been industrialized on a large scale due to its gentle operation conditions, higher butene conversion rate, and the complete utilization of the C4 fraction. Traditionally, HF and H2SO4 were the industrial alkylation catalysts, which have negative influence on environment and humans because of their corrosivity and toxicity. Therefore, massive efforts have been made to substitute the existing liquid acid catalysts, including investigating new solid acid catalysts (super solid acid, heteropolyacid and zeolites) and decreasing the critical reaction conditions.2 However, there are numerous limitations at an industrial scale, ascribed to fast deactivation caused by oligomerization of butene. Thus, solid acid catalysts for alkylation, particularly zeolites, are a promising research field due to outstanding advantages in environment protection.
Among the zeolites used in isobutane/butene alkylation, which include Y,3–8 X,9–11 β,12–15 mordenite,13,16 ZSM17 and MCM,18 the Y zeolites are the most studied because of their considerable activity for hydride transfer and large pore size.19 However, the controversy regarding the activity of the protonic form of Y zeolites towards alkylation has raged unabated. Querinl et al.20 reported that HY was not active for TMP formation due to a strong adsorption of the olefins and subsequent oligomerization as a consequence of very fast deactivation. Corma et al.18 investigated the impact of the unit cell size of steam-dealuminated Y zeolites and found that oligomerization continuously increased with the zeolite unit cell size although the maximum conversion of 2-butene was attained on samples with unit cell sizes between 2.435 and 2.450 nm. Although strong Brønsted acid sites that benefit alkylation can be achieved by ion-exchange with La3+, the alkylation efficiency on LaY was not satisfactory because of the short lifespan of the zeolite and low selectivity to isooctane.4 Hence, it is necessary to further study Y zeolites.
It is known that C8 hydrocarbons are the main products in C5+ alkylate over all types of zeolites and the distribution of individual components depends on the catalyst categories and reaction conditions. In order to increase the selectivity of desirable alkylate trimethylpentane (TMP), considerable research has been carried out to understand the formation mechanism of C8.21–24 However, the formation pathways of the byproducts were discussed roughly. It is expected that the C5–C7 hydrocarbon species are derived from the cracking of higher hydrocarbons by β-scission, and the C9+ hydrocarbon species are formed via butene oligomerization. However, the interesting phenomenon that the main byproduct of C9+ over solid acid catalysts is a C11 chain hydrocarbon rather than C12 has not been explained. The group25 also found that a coke precursor deposited on the surface of zeolites was comprised of long chain alkanes in which the number of carbon atoms was odd.
The objective of this study is to demonstrate that HY zeolites exhibit activity for isobutene/butene alkylation and reveal the formation mechanism of the main alkylation byproducts over HY zeolites.
2. Experimental section
2.1 Synthesis of HY zeolites
Sodium metasilicate, sodium aluminate, and sodium hydroxide were dissolved in deionized water according to the mole ratio 16Na2O![[thin space (1/6-em)]](https://www.rsc.org/images/entities/char_2009.gif) :Al2O3:15SiO2:300H2O. Subsequently, the mixture was aged at room temperature for 12 h to generate a crystallization directing agent. Then, the above mixture and directing agent were transferred into an autoclave and crystallized at 100 °C for 12 h according to the mole ratio of 2.7Na2O:Al2O3:8.4SiO2:200H2O. It is worth noting that Si derived from the guiding agent would not be lower than 90%. The obtained solution mixture was filtered through vacuum suction filtration and washed with deionized water. The resultant solid was dried at 120 °C overnight and calcined at 550 °C for 4 h to form the parent powder of NaY. HY zeolite powder was obtained by the ion-exchange between NaY powder and 1 mol L−1 NH4Cl aqueous solution, drying, and stepwise calcination. The above steps were repeated thrice. The final catalysts were prepared through a series of steps, including extrusion with a binder into cylindrical shape, drying at 120 °C for 12 h, and calcination at 350 °C for 2 h and then at 550 °C for 3 h.
:Al2O3:15SiO2:300H2O. Subsequently, the mixture was aged at room temperature for 12 h to generate a crystallization directing agent. Then, the above mixture and directing agent were transferred into an autoclave and crystallized at 100 °C for 12 h according to the mole ratio of 2.7Na2O:Al2O3:8.4SiO2:200H2O. It is worth noting that Si derived from the guiding agent would not be lower than 90%. The obtained solution mixture was filtered through vacuum suction filtration and washed with deionized water. The resultant solid was dried at 120 °C overnight and calcined at 550 °C for 4 h to form the parent powder of NaY. HY zeolite powder was obtained by the ion-exchange between NaY powder and 1 mol L−1 NH4Cl aqueous solution, drying, and stepwise calcination. The above steps were repeated thrice. The final catalysts were prepared through a series of steps, including extrusion with a binder into cylindrical shape, drying at 120 °C for 12 h, and calcination at 350 °C for 2 h and then at 550 °C for 3 h.
2.2 Characterization
X-Ray Powder Diffraction (XRD) spectra of the catalysts were recorded using a D8 Advance (Bruker, Germany) diffractometer operating at 40 mA and 40 kV using monochromated Cu Kα1 radiation (λ = 1.541 Å) in the 2θ range from 5° to 90°. The diffraction data was recorded using continuous scanning at a rate of 0.02° s−1. Scanning electron microscopy (SEM) images were collected on a ZEISS Gemini SEM300 at 5 kV. Powder samples extruded mouldings for SEM imaging were placed on a conductive adhesive. N2 adsorption–desorption studies were conducted at −196 °C after sample pretreatment under vacuum at 250 °C for 4 h. The specific surface area was determined by the Brunauer–Emmett–Teller (BET) method in the P/P0 range 0.05–0.2, and the pore size distribution was calculated by the Barrett–Joyner–Halenda (BJH) method using the desorption branch of the isotherm. Brønsted and Lewis acid concentrations were obtained from pyridine-IR spectra. Before measurement, the samples were pressed into self-supporting wafers and dried under vacuum at 400 °C for 1 h to remove water and weakly adsorbed deposits. Then, pyridine was adsorbed at 30 °C in vacuum for 2 h until no changes were observed in the spectrum. After weakly physisorbed pyridine was removed, the IR spectra were recorded at 200 °C.
2.3 Isobutane/butene alkylation test
Initially, 5 g fresh HY zeolite was loaded in the constant temperature section of a stainless tubular reactor with inner diameter of 12 mm and length of 50 cm. Prior to reaction, the catalysts were pretreated at 500 °C for 1 h in N2 at a flow rate of 40 mL min−1 in order to remove the water adsorbed over the zeolites. Then, the reactor was cooled by N2 to the reaction temperature and pressurized to 2.0 MPa. Finally, the isobutane/butene mixture with a molar ratio of I/O = 180 was pumped (SZWEICO, 2ZB-1L10A) to the reactor at a weight hourly space velocity (WHSV) of 7.5 h−1. The mixture of butenes consisted of 1-butene, 2-butenes, and isobutene at concentrations of 16.3, 83.1, and 0.6 wt%, respectively. The reaction was stopped when the conversion rate of butene was lower than 90% or time on stream (TOS) reached 72 h.
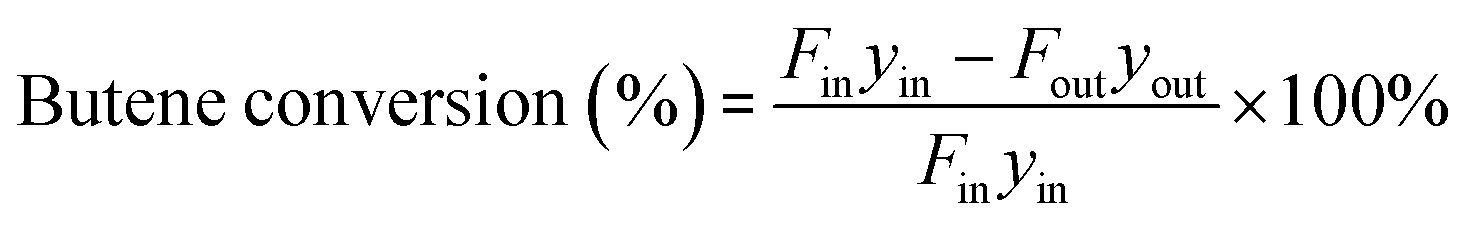
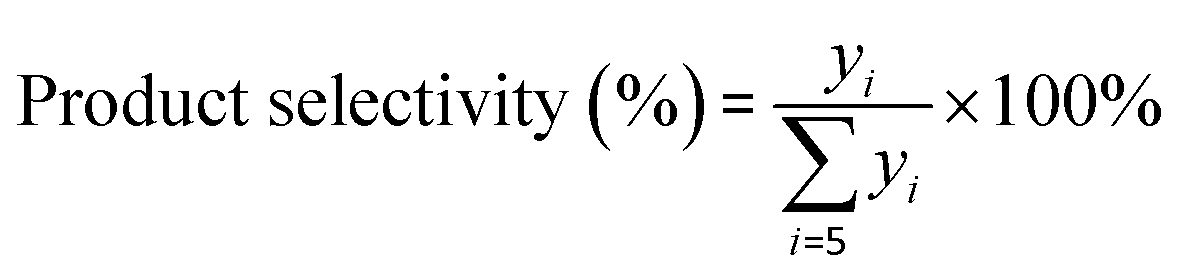
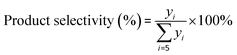
The components in the liquid-phase product were analyzed using a gas chromatograph GC-9720/FID with a capillary column (50 m × 0.2 mm × 0.5 μm Agilent-HP-PONA). The GC9790II/FID with a capillary column (30 m × 0.530 mm Agilent-GC-Alumina) was employed to determine the components of feedstock and effluent gas. The butene conversion and product selectivity could be calculated according to eqn (1) and (2).
| |
 | (1) |
| |
 | (2) |
where
Fin,
Fout and
yin,
yout refer to the molar flow and butene percentage at the reactor inlet and outlet, respectively, and
yi is the molar percent of product with
i number of carbons in the effluent.
2.4 Regeneration of used catalyst
The catalyst needed to be regenerated when the time on stream reached 72 h or the butene conversion decreased to 90%. The used catalysts were regenerated in situ at a temperature of 450 °C at atmospheric pressure for 12 h by passing air at a flow rate of 50 mL min−1. Subsequently, the reaction bed was cooled to 75 °C by N2 at a rate of 40 mL min−1 and then pressurized at 2.0 MPa. The alkylation reaction proceeded by purging feedstock at the same reaction conditions as fresh catalysts after the carbon deposit was wiped off.
3. Results and discussion
3.1 Characterization of catalysts
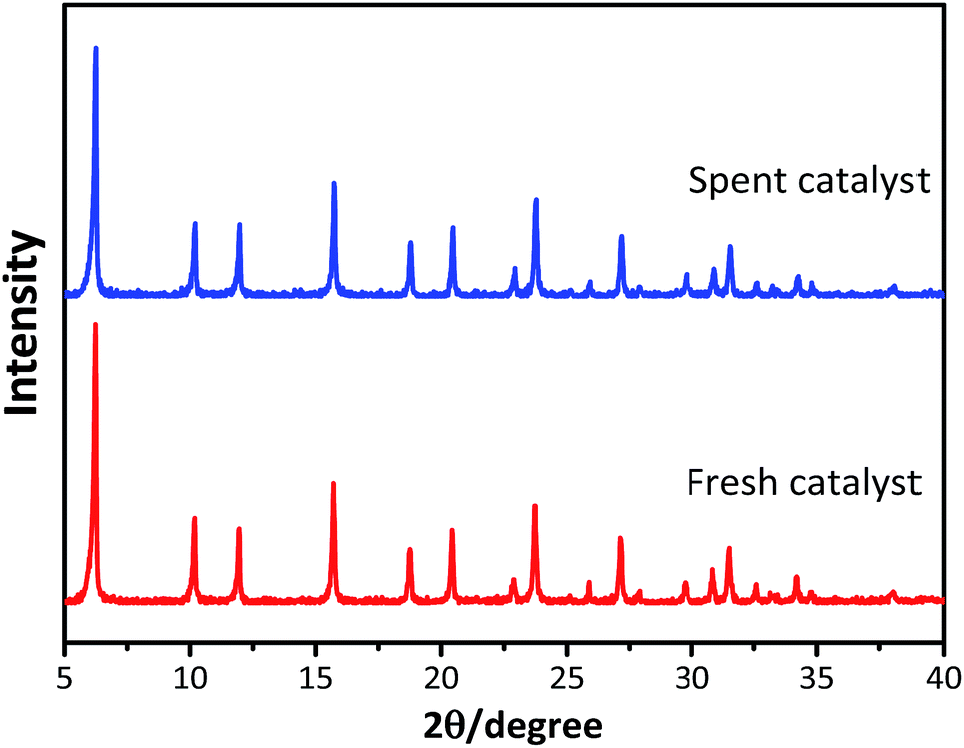
The powder XRD patterns of the synthesized and used catalysts (Fig. 1) exhibited characteristic peaks at 2θ = 6.25°, 10.19°, 11.96°, 15.72°, 18.76°, 20.44°, and 23.73°, in accordance with the reference patterns for HY zeolites in the Joint Committee on Powder Diffraction Standards (JCPDS) database, indicating that the synthesized HY zeolites were well-crystallized and pure. The inferior peak intensities of the spent zeolites when compared to that of fresh catalyst were due to the carbon deposits on the catalysts.
 |
| | Fig. 1 XRD patterns of fresh and spent catalysts. | |
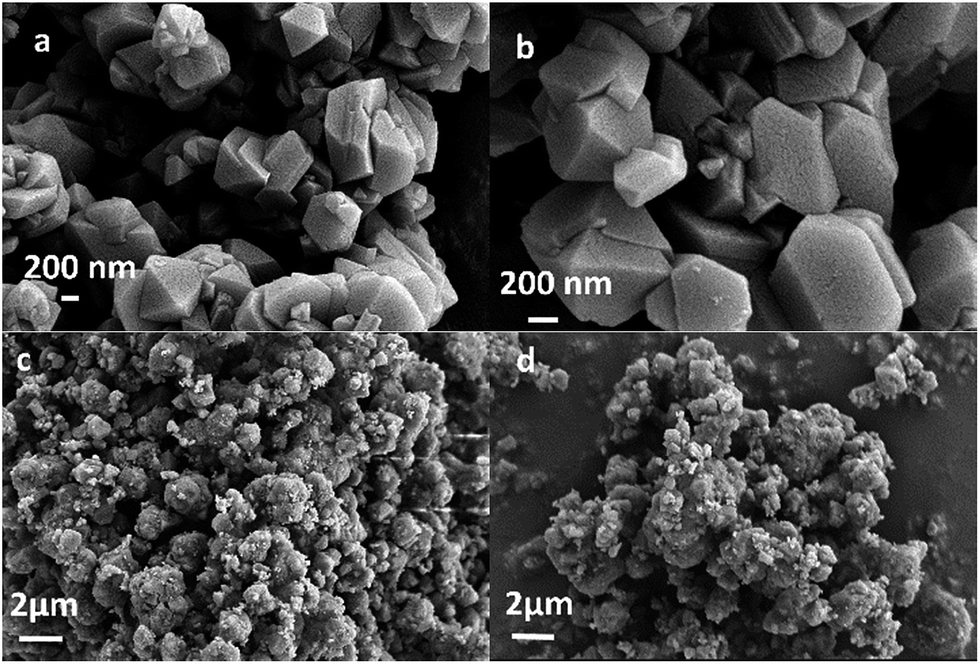
Fig. 2 displays the SEM images of the synthesized HY zeolites with prominent crystal morphology. The particles sizes ranged from 200 to 700 nm. However, visible agglomeration of the particles is observed and the entangled particles that are inserted in each other decrease the efficient surface for reaction. The agglomeration became more severe after deactivation (Fig. 2(d)) when compared to the fresh zeolites (Fig. 2(c)).
 |
| | Fig. 2 SEM images (a and b) HY powder before extrusion; (c) fresh HY; and (d) spent HY. | |
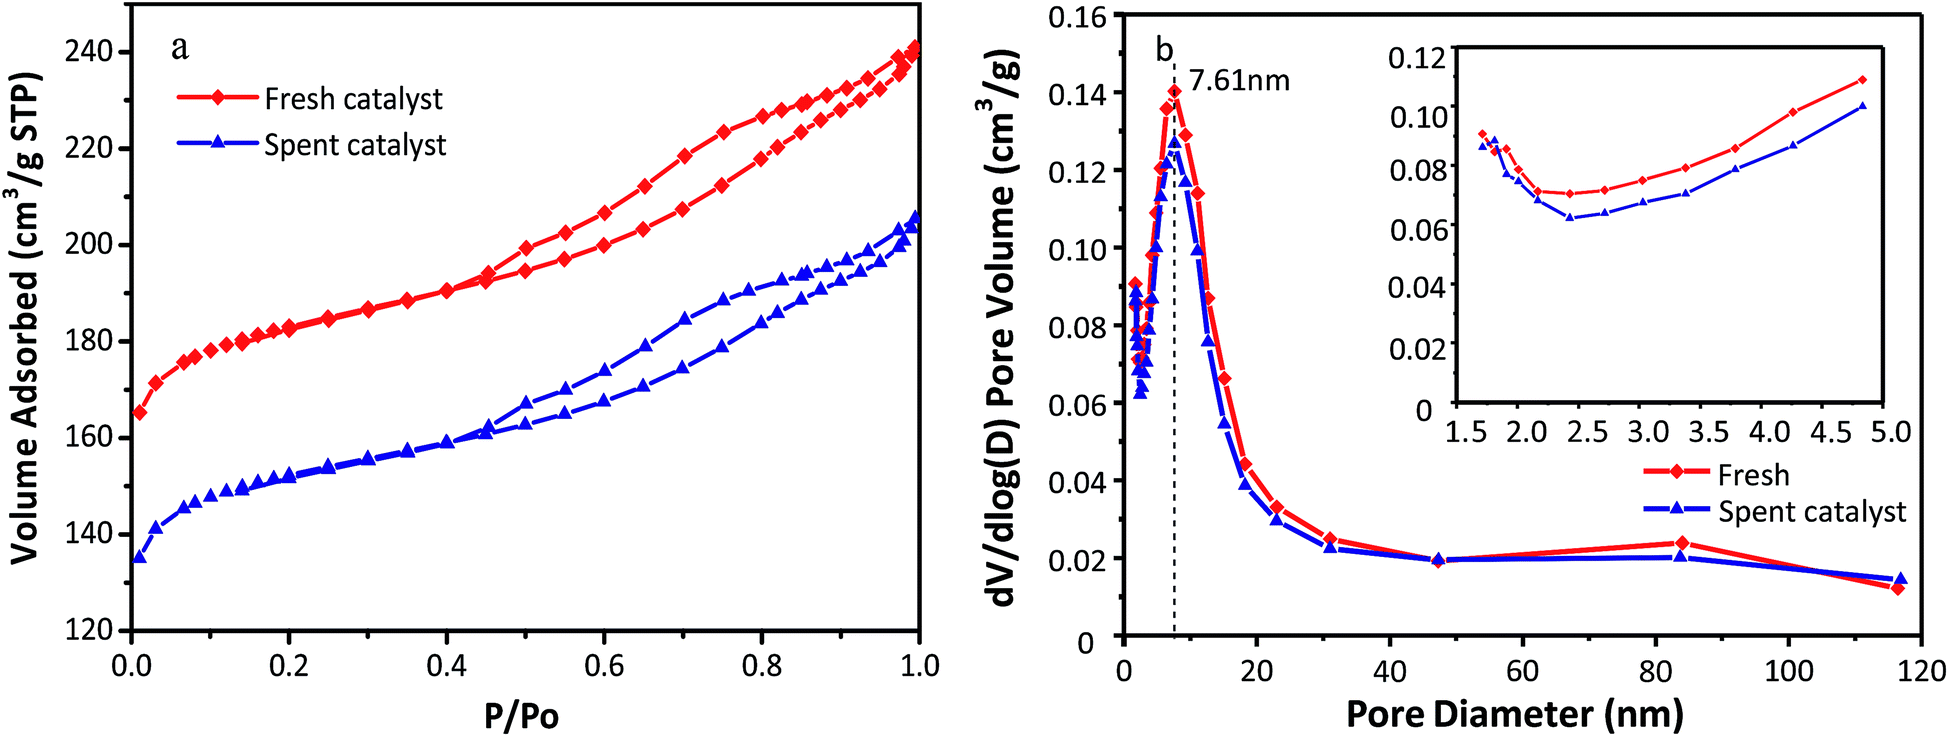
The N2 adsorption–desorption isotherms and pore size distributions of the fresh and used HY zeolites are depicted in Fig. 3(a) and (b). Both isotherms observed in Fig. 3(a) display type IV behavior with a hysteresis loop above p/p0 = 0.4, which can be typically observed in mesoporous materials with pore diameter up to ca. 50 nm. Moreover, a steep increase at p/p0 < 0.02 of the catalysts can be interpreted as microporous filling, while the other steep increase at 0.4 < p/p0 is caused by capillary condensation in the mesopores. The pore distribution has an insignificant change as observed in Fig. 3(b), where apparent mesopores with a specific diameter of 7.61 nm along with a narrow distribution are observed. In addition, the amount of pores with different sizes of catalysts decreased after the alkylation reaction. The reason for the above phenomenon could be that oligomers of olefins absorbed to the micro and mesopores cannot diffuse to the bulk phase. The concrete values of the textural properties of zeolites, including specific surface area and pore volume, are listed in Table 1. All the textural indictors of fresh catalysts declined after the alkylation reaction. In particular, the micropore specific surface area and micropore volume decrease by 18.8% and 19.1%, respectively. This was possibly resulted from bulk pores and covered surface with oligomers. The catalysts began to deactivate when large hydrocarbons generated in the micropores fail to diffuse to bulk phase.9
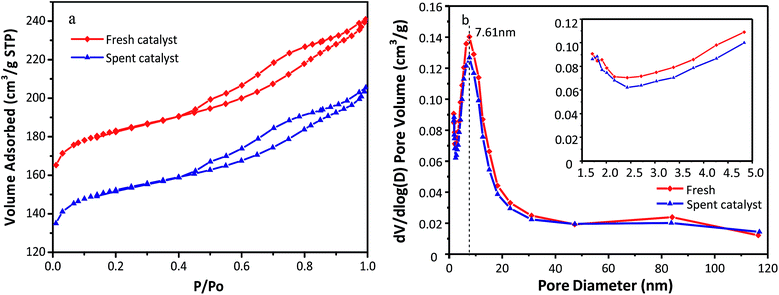 |
| | Fig. 3 (a) N2 adsorption–desorption isotherm and (b) pore sizes distribution of fresh and spent HY zeolites. | |
Table 1 Textural properties of fresh and used HY zeolites
| HY catalyst |
SBET (m2 g−1) |
Smicroa (m2 g−1) |
VPb (cm3 g−1) |
Vmicroc (cm3 g−1) |
Vmesod (cm3 g−1) |
| Smicro = t-plot micropore area. Vp = total pore volume. Vmicro = t-plot micropore volume. Vmeso = mesopore volume determined by BJH method. |
| Fresh |
588.3 |
479.8 |
0.360 |
0.235 |
0.125 |
| Spent |
490.6 |
389.7 |
0.305 |
0.190 |
0.115 |
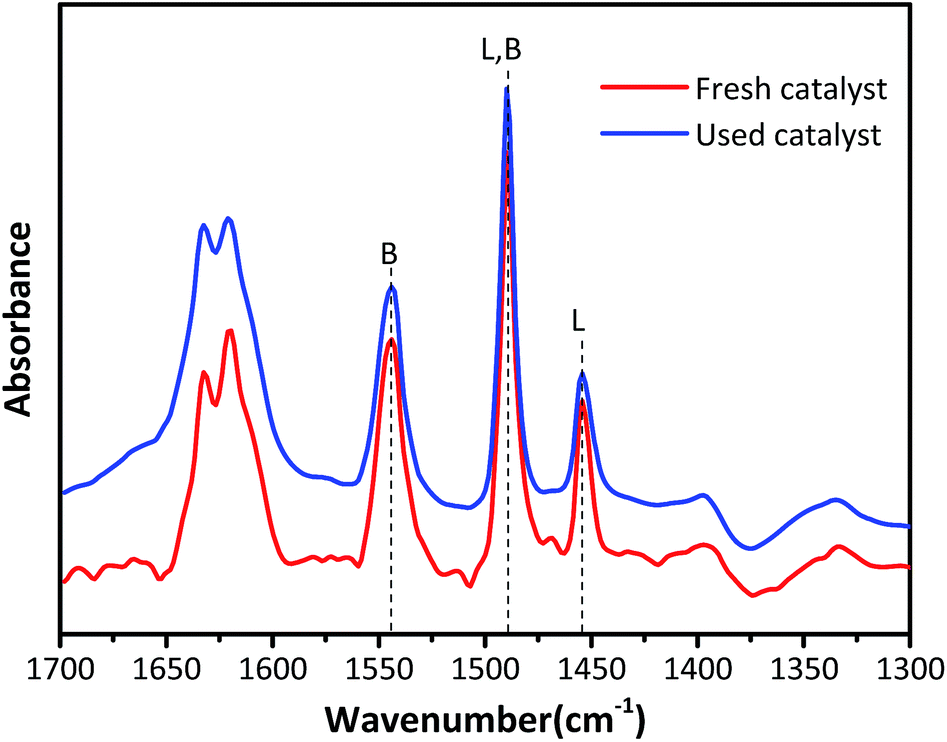
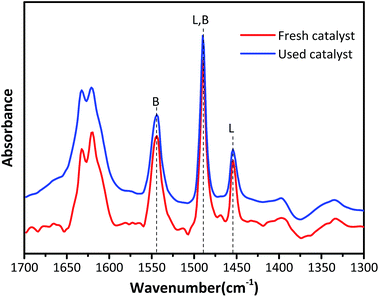
Fig. 4 exhibits the Py-IR spectra to qualitatively and quantitatively determine the Lewis acid and Brønsted acid concentrations in HY zeolites located at 1545 cm−1 and 1455 cm−1, respectively.26–28 The surface Brønsted (B) and Lewis (L) acid sites concentrations were calculated according to the equation published by Emeis29 and the results are summarized in Table 2. The Brønsted acid sites are dominant in both fresh and used HY zeolites, while the amount of Lewis acid sites is small. The amount of B and L acid types decreased by 19.7% and 3.4% after the alkylation reaction, respectively. The ratio of B/L declined from 3.8 to 3.22, demonstrating that Brønsted acid type was primarily responsible for alkylation and the decrease of Brønsted acid sites was the main reason for catalyst deactivation.
 |
| | Fig. 4 Py-IR profiles at the desorption temperature of 200 °C. | |
Table 2 Brønsted and Lewis acid sites concentrations of the fresh and used HY zeolites
| Catalyst |
CB (mmol g−1) |
CL (mmol g−1) |
B/L |
| Fresh |
0.1019 |
0.0263 |
3.8 |
| Used |
0.0818 |
0.0254 |
3.22 |
3.2 Alkylation activity of the synthesized catalysts
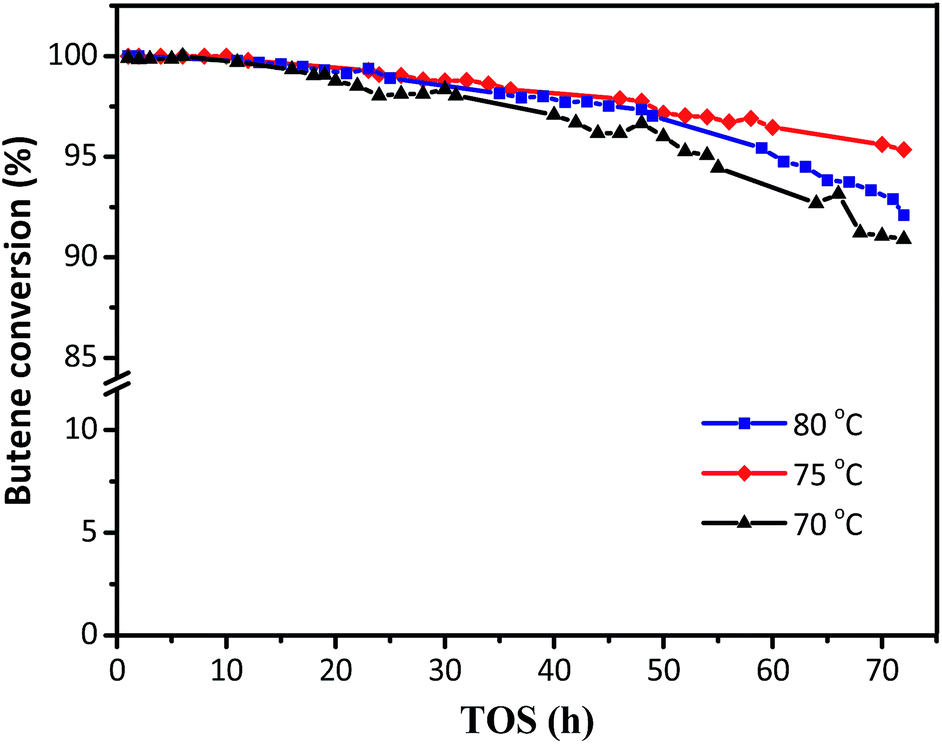
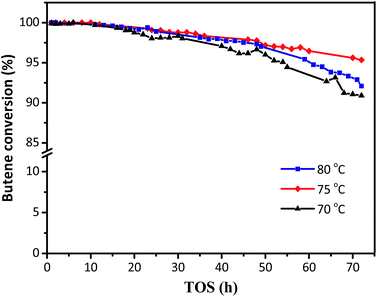
The activity of the synthesized HY zeolites for isobutane/butene alkylation was investigated. The butene conversions over time on stream at various temperatures (70, 75, and 80 °C) are shown in Fig. 5, where conversion gradually decreased from 100% in the initial 12 h to 91, 92, and 95% at the end of the reactions after 70 h, respectively. The minimum decrease in butene conversion was achieved at a reaction temperature of 75 °C. The possible reason was that lower temperature was not beneficial for the activation and diffusion of reactants and products as well as overcoming steric hindrance. However, higher temperature was more convenient for butene oligomerization resulting in a decline of activity centres.8 The covering surface and bulk pore values are summarized in Table 1 and Fig. 2, and the decrease of Brønsted acidities is illustrated in Fig. 4 and Table 2.
 |
| | Fig. 5 The effects of reaction temperatures on butene conversion. Reaction condition: the ratio of isobutane to butene (I/O = 180), P = 2.0 MPa, WHSV = 7.5 h−1. | |
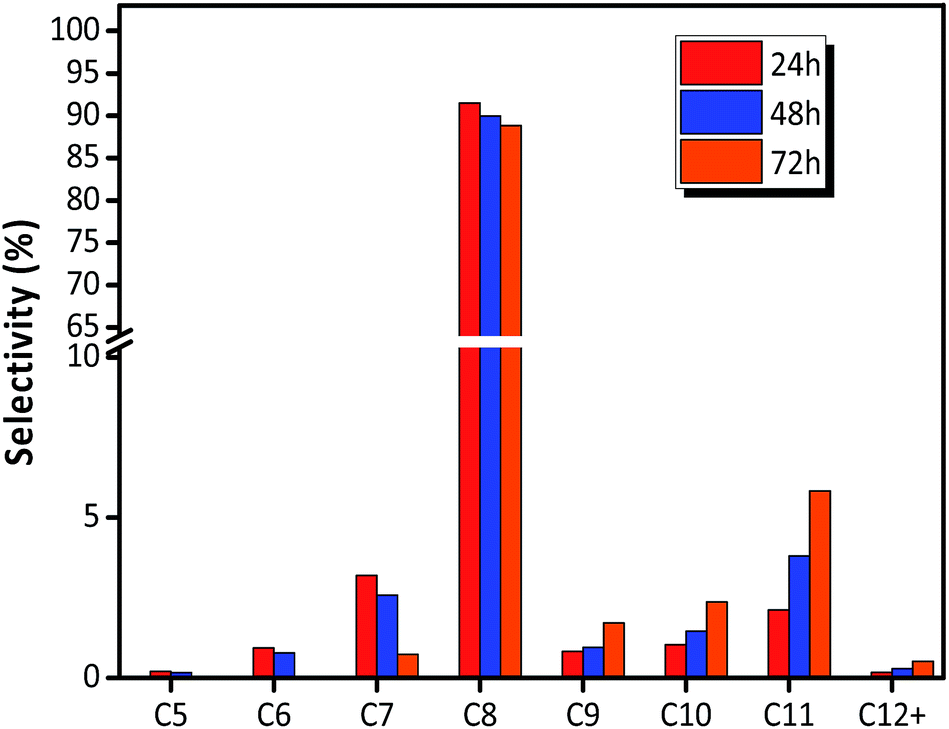
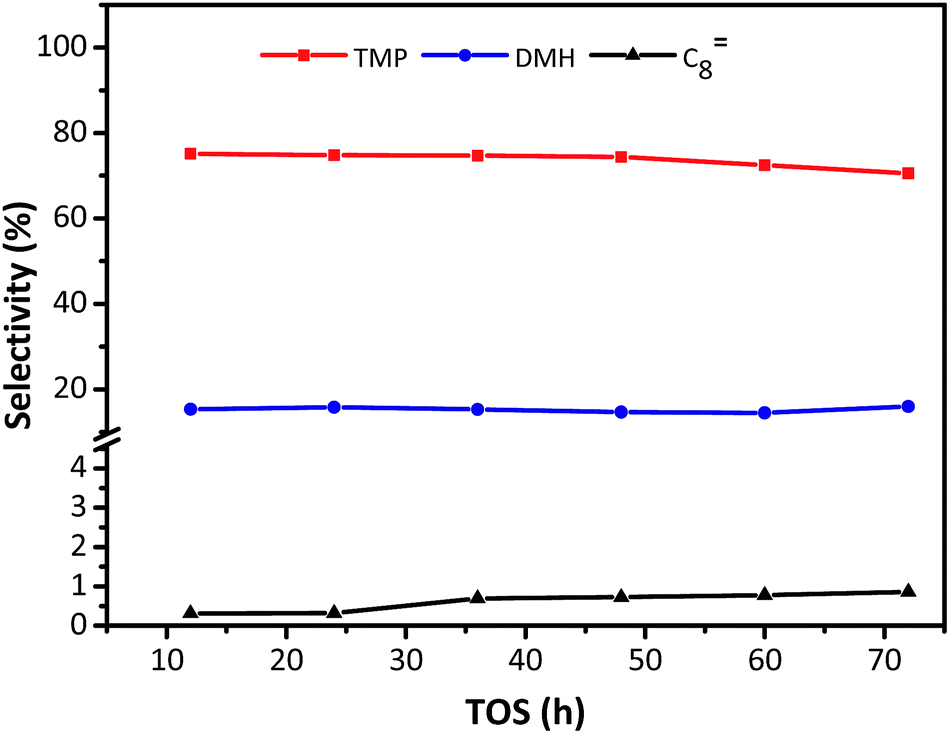
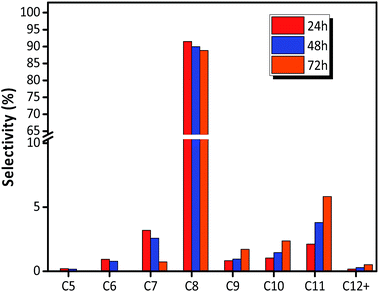
The distribution of individual components in the alkylate at the optimal temperature of 75 °C is shown in Fig. 6, revealing that the selectivity of C5–C7 and C8 decreased with TOS, but the selectivity of C9+ increased. The high selectivity of C8 hydrocarbon species (above 80%) and the low selectivity of C12+ (lower than 1% at 72 h), observed in Fig. 6, reflected that the synthesized HY zeolites had great stability and also, the oligomerization activity producing higher hydrocarbons (over C12) was limited in this stage due to a highly active catalyst. The selectivities of the main constituents of C8, namely, trimethylpentane, dimethylhexane (DMH), and C8![[double bond, length as m-dash]](https://www.rsc.org/images/entities/char_e001.gif) are described in Fig. 7. The selectivities of TMP and DMH were stable at 75 and 15%, respectively, while the selectivity of C8 was less than 1%. In general, C5–C7 species were derived from oligomers, such as C12+, through cleavage of C–C bonds, while C9+ species was generated from oligomerization of butene.23 Although both cracking and oligomerization require acid centers, the former took place on Brønsted acid centres and the latter primarily depended on Lewis acid centers. The paralleled selectivity tendencies of C5–C7 and C8 were in accordance with the requirement of the same Brønsted acid active sites for alkylation and cracking.30 In addition, the acidity strength needed by each reaction step in the process of alkylation was different: cracking > alkylation (electrophilic addition of butene to iso-C4H9+) > oligomerization (electrophilic addition of butene to sec-C4H9+).21 This indicated that oligomerization still proceeded stably when acidity centres were less in number and weaker. Therefore, the inhibiting effect of fewer acid centres on cracking was more distinct than for alkylation and addition reaction,21 so that the selectivity of C12+ increased with time on stream when the catalyst began to undergo deactivation.
are described in Fig. 7. The selectivities of TMP and DMH were stable at 75 and 15%, respectively, while the selectivity of C8 was less than 1%. In general, C5–C7 species were derived from oligomers, such as C12+, through cleavage of C–C bonds, while C9+ species was generated from oligomerization of butene.23 Although both cracking and oligomerization require acid centers, the former took place on Brønsted acid centres and the latter primarily depended on Lewis acid centers. The paralleled selectivity tendencies of C5–C7 and C8 were in accordance with the requirement of the same Brønsted acid active sites for alkylation and cracking.30 In addition, the acidity strength needed by each reaction step in the process of alkylation was different: cracking > alkylation (electrophilic addition of butene to iso-C4H9+) > oligomerization (electrophilic addition of butene to sec-C4H9+).21 This indicated that oligomerization still proceeded stably when acidity centres were less in number and weaker. Therefore, the inhibiting effect of fewer acid centres on cracking was more distinct than for alkylation and addition reaction,21 so that the selectivity of C12+ increased with time on stream when the catalyst began to undergo deactivation.
 |
| | Fig. 6 Selectivity of each component in alkylate (C5+) over HY zeolites. Reaction condition: the ratio of isobutane to butene (I/O = 180), P = 2.0 MPa, WHSV = 7.5 h−1. | |
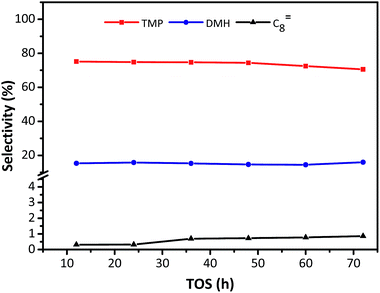 |
| | Fig. 7 Selectivity of individual C8 component in alkylate (C5+) vs. TOS over HY zeolites. Reaction condition: the ratio of isobutane to butene was I/O = 180, P = 2.0 MPa, WHSV = 7.5 h−1. | |
For electrophilic addition of butene, C12 directly derived from the trimerization of butene was the main component in C9–C12, and C9–C11 was scarcely included in the alkylate products. However, the reducing order of selectivity was C11 > C10 > C9 > C12+, as observed in Fig. 6, which was contrary to the viewpoint that higher hydrocarbon than C8 was simply formed by butene oligomerizing.14
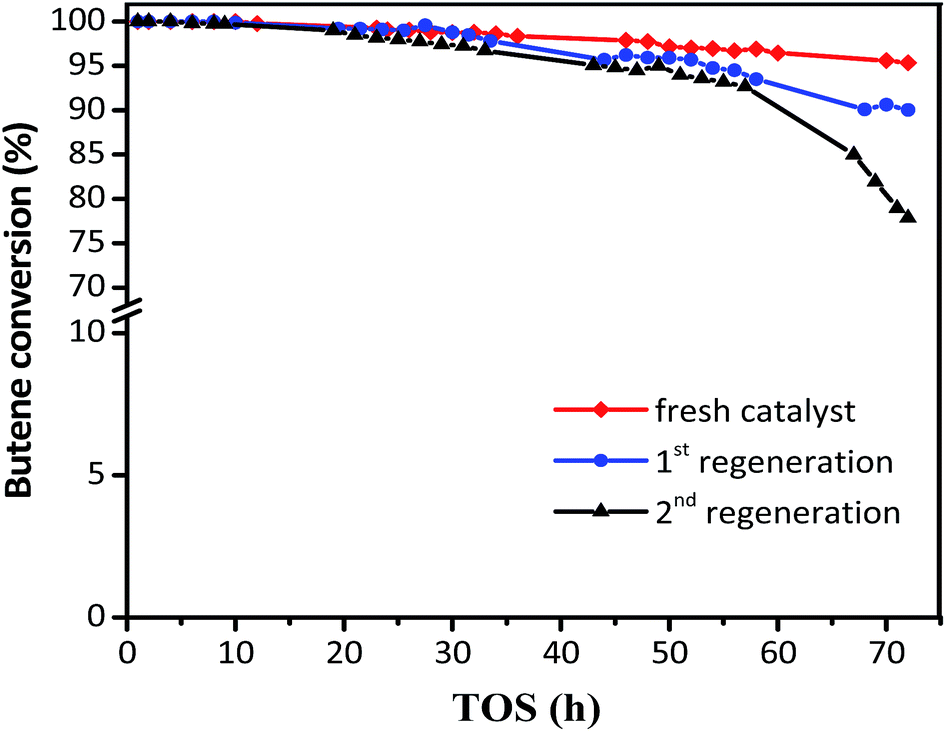
The regeneration effect is exhibited in Fig. 8, where the butene conversion recovered to 100% in the initial 10 h and then decreased at different gradients for the first and second regeneration. In addition, the product distribution (Table 3) showed that while the target TMP decreased from 72.51 to 69.36% for the first regeneration and 65.59% for the second regeneration, the selectivity of the alkylation byproducts increased, including those for C5–C7 and C9+. The initial butane conversion was 100% in 12 h for the regenerated catalysts, which was similar to that for the fresh catalysts, inferring that the regeneration process was efficient. However, the sharp descent gradient and unsatisfactory product distribution of spent catalysts after 15 h indicated that the stability of regenerated catalysts was inferior to that of the fresh samples, possibly because the coke could not be burned out completely. It can be considered that the used zeolites need to be regenerated once the butene conversion was lower than 100%, which could avoid the formation of intractable carbon deposits and facilitate the recovery of the activity of the catalyst.
 |
| | Fig. 8 Butene conversion with TOS in the presence of fresh and regenerated catalyst. Reaction condition: the ratio of isobutane to butene (I/O = 180), P = 2.0 MPa, WHSV = 7.5 h−1. | |
Table 3 Products distribution of the fresh and used catalysts
| Catalysts |
Fresh HY, % |
1st regeneration, % |
2nd regeneration, % |
| C5–C7 |
3.64 |
6.07 |
6.79 |
| C8 |
88.32 |
84.43 |
80.31 |
| TMP |
72.51 |
69.36 |
65.59 |
| DMH |
14.47 |
12.93 |
12.38 |
| C8 |
0.37 |
0.32 |
0.32 |
| C9+ |
8.05 |
9.51 |
12.90 |
3.3 Formation mechanism of alkylation byproducts
It is clear that both cracking and oligomerization occurred in the process of butene alkylation (Fig. 9). Theoretically, the number of carbon atoms in primary oligomers originating from butene oligomerization is a multiple of four. However, β-scission that can be easily initiated in longer chain hydrocarbons on acid sites, results in the carbon atom number of end products in alkylate oil ranging from 5 to 12. Cracking of C8 hardly took place in the alkylation conditions, supporting that C5–C7 components primarily stem from C12–C16.13,14 Moreover, C9–C11 components were produced through two routes: (1) cracking of C16+ from tetramerization of butene13 and (2) electrophilic addition of C5–C7 carbocation with C4H8. Hence, the formation pathways of alkylation byproducts can be described as shown in Fig. 10.
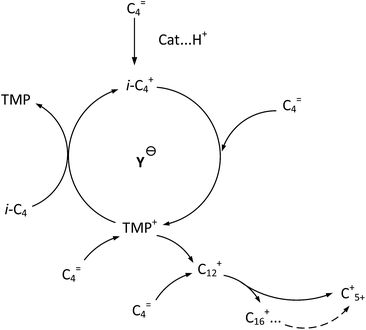 |
| | Fig. 9 Formation routes of target compound TMP and primary oligomers in isobutane/butene alkylation over zeolites.21,31 | |
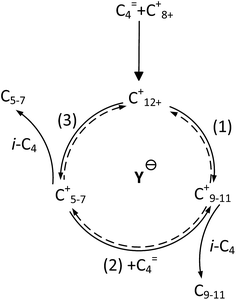 |
| | Fig. 10 Formation routes of alkylation byproducts. | |
As shown in Fig. 6, the selectivity of quantity of C5–C7 decreased gradually, but the selectivity of C9+ species increased with the deactivation of catalysts. The possible reason was that the acid strength of the catalyst was sufficient to promote hydride transfer and enable cracking at the initial stage of alkylation.32 Therefore, the cracking reaction rate, r3, of C12+ remained high and the selectivity of C5–C7 hydrocarbons was maximum. Nevertheless, the decreased content and strength of acid centers with catalysts deactivation, particularly Brønsted acid centers, enhanced oligomers but suppressed cracking more drastically when compared to the addition of butene with carbonations. This was because stimulation of cracking required stronger acidity.20
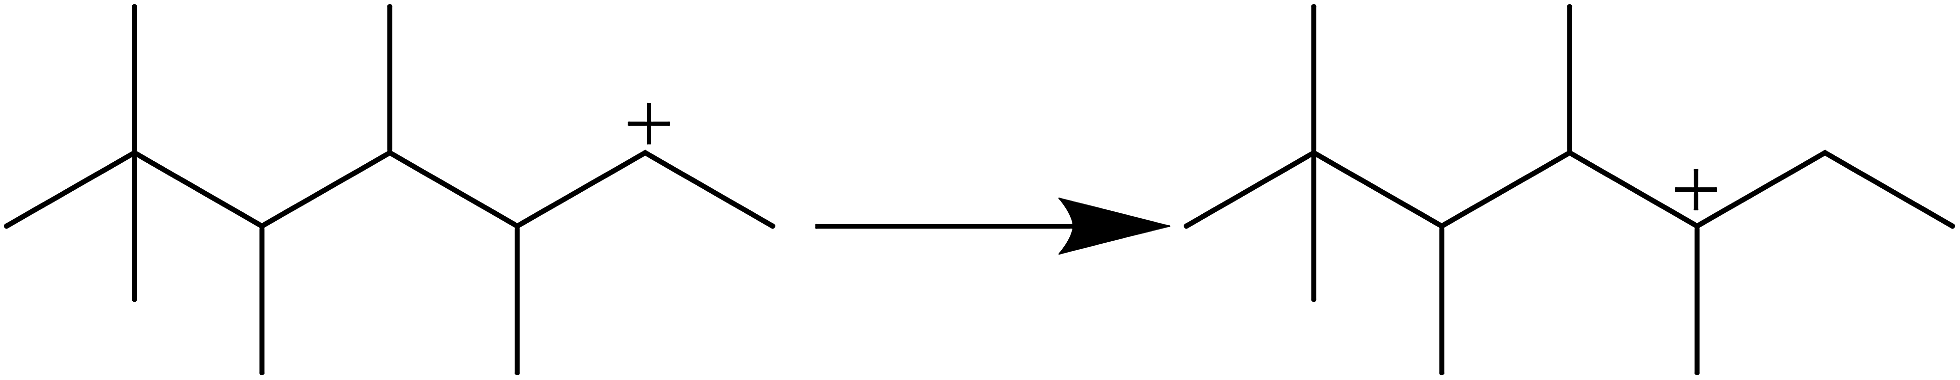
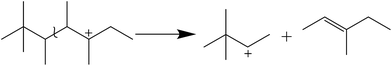
As shown in Fig. 6, there are no C1–C3 hydrocarbons, indicating that extended cracking of primary crackates scarcely occurred in the alkylation process. As a result, crackates of C12+ only included C4–C8, in which C4 and C8 were directly reversible reactants. Moreover, the existence of C5–C7 hydrocarbons indicated the possibility of hydride transfer in C12+ as shown in Scheme 1, where C12+ was the primary oligomer of 2-butene on HY zeolites.
 |
| | Scheme 1 Intramolecular hydride transfer. | |
In addition, the C6 species was generated via the cleavage of C–C bond as shown in Scheme 2. Similarly, C5 and C7 hydrocarbons were also formed by the β-scission of other C12+ isomers.
 |
| | Scheme 2 Cracking of long chain carbocation. | |
It is speculated that the higher the carbocation, the more carbon atoms are possessed by the primary products of cracking. Therefore, the selectivity of cracking products decreased in the following order: C7 > C6 > C5. Correspondingly, the selectivity decreasing in the order of C9–C11 can be explained based on two reasons: (1) the more alkyl groups in the carbocation chain, the faster the electrophilic addition rate because the products with more alkyl groups were more stable due to charge dispersion. (2) The higher the concentration of reactants, the easier the oligomerization reaction. It is necessary to emphasize that only C12 was detected in C12+ alkylate oil, possibly because chromatography function was limited and the higher carbon number components retained over catalysts.13 There was a greater potential for sequential addition of C12+ once it was formed via the addition of C8+ with butene, suggesting accumulation of C12 was few. Moreover, it was possible that C12 was converted into C5–C7. As a result, the selectivity of C9–C11 was higher than that of C12 though the relative rate of oligomerization increased.
4. Conclusions
Isobutane alkylation with butenes was carried out over synthesized HY zeolites in a tubular reactor. HY zeolites exhibited ideal activity and desirable selectivity of C8 hydrocarbon at 75 °C with a butane conversion rate above 95% and the selectivity of C8 near to 90%. However, the deactivation of catalysts was unavoidable due to the decrease of surface area and acid sites concentration. The selectivity of C5–C7 decreased because of the weakened cracking ability, resulting from the decreased acid sites especially Brønsted acid sites. Moreover, the enhanced selectivity of C9–C11 was due to the addition of C5–C7 carbocations with butane, which was another factor to decrease the accumulation of C5–C7. It is indispensable to further study the improvement measurements of particles dispersion and pores distribution of HY zeolites used in the alkylation of isobutane with butene.
Conflicts of interest
There are no conflicts to declare.
Acknowledgements
We thank the National Key Research and Development Plan (No. 2016YFC0303701), Beijing Novo Program Interdisciplinary Studies Cooperative project, Science Foundation of China University of Petroleum, Beijing (No. 2462014YJRC011, 201604) for the support.
References
- A. Sarkar, D. Seth and F. T. T. Ng, et al., Ind. Eng. Chem. Res., 2014, 53, 18982–18992 CrossRef.
- A. E. Koklin, V. M. K. Chan and V. B. Kazanskii, et al., Kinet. Catal., 2010, 51, 410–415 CrossRef CAS.
- R. Klingmann, R. Josl and Y. Traa, et al., Appl. Catal., A, 2005, 281, 215–223 CrossRef.
- C. Sievers, J. R. S. Liebert and M. M. Stratmann, et al., Appl. Catal., A, 2008, 336, 89–100 CrossRef CAS.
- J. a. V. Bokhoven, A. L. Roest and D. C. Koningsberger, J. Phys. Chem. B, 2000, 104, 6743–6754 CrossRef.
- L. Yuying, L. Yongxiang and L. Jun, et al., Acta Pet. Sin., 2014, 30, 765–771 Search PubMed.
- T. Juzsakova, A. Csavdari and A. Redey, et al., Environ. Eng. Manage. J., 2014, 13, 2343–2347 CAS.
- B. O. D. Costa and C. A. Querini, Chem. Eng. J., 2010, 162, 829–835 CrossRef.
- C. Sievers, I. Zuazo and A. Guzman, et al., J. Catal., 2007, 246, 315–324 CrossRef CAS.
- L. Patrylak, O. P. Pertko and S. V. Konovalov, et al., Curr. Catal., 2016, 5, 108–115 CrossRef.
- K. I. Patrilyak, L. K. Patrilyak and Y. G. Voloshina, et al., Theor. Exp. Chem., 2011, 47, 205 CrossRef.
- K. Yoo and P. G. Smirniotis, Appl. Catal., A, 2002, 227, 171–179 CrossRef.
- K. Yoo, E. C. Burckle and P. G. Smirniotis, J. Catal., 2002, 211, 6–18 CrossRef CAS.
- S. V. Nayak, P. A. Ramachandran and M. P. Dudukovic, Chem. Eng. Sci., 2010, 65, 335–342 CrossRef CAS.
- B. O. D. Costa and C. A. Querini, Appl. Catal., A, 2010, 385, 144–152 CrossRef.
- A. C. Oliveira, N. Essayem and A. Tuel, et al., J. Mol. Catal. A: Chem., 2008, 293, 31–38 CrossRef CAS.
- K. Yoo and P. G. Smirniotis, Appl. Catal., A, 2003, 246, 243–251 CrossRef CAS.
- A. Corma, A. Martínez and C. Martínez, J. Catal., 1994, 146, 185–192 CrossRef CAS.
- Z. Qin, K. A. Cychosz and G. Melinte, et al., J. Am. Chem. Soc., 2017, 139, 17273–17276 CrossRef CAS PubMed.
- C. A. Querinl and E. Roa, Appl. Catal., A, 1997, 163, 199–215 CrossRef.
- A. Feller, J. Catal., 2003, 220, 192–206 CrossRef CAS.
- A. Feller, I. Zuazo and A. Guzman, et al., J. Catal., 2003, 216, 313–323 CrossRef CAS.
- L. K. Patrilyak and P. I. Bartosh, Theor. Exp. Chem., 2003, 39, 177–183 CrossRef CAS.
- L. K. Patrylak and I. A. Repetskyi, Theor. Exp. Chem., 2013, 49, 143–157 CrossRef.
- H. Yigong and H. Yufeng, Chin. J. Catal., 2000, 21, 175–178 Search PubMed.
- H. J. Lee, D.-C. Kang and S. H. Pyen, et al., Appl. Catal., A, 2017, 531, 13–20 CrossRef CAS.
- L. b. Qin, J. Han and Y. Q. Zhan, et al., Energy Fuels, 2016, 30, 544–550 CrossRef CAS.
- L. b. Qin, J. Han and W. Y. Chen, et al., Appl. Therm. Eng., 2016, 94, 813–818 CrossRef CAS.
- C. A. Emeis, J. Catal., 1993, 141, 347–354 CrossRef CAS.
- D. H. Park, S.-S. Kim and T. J. Pinnavaia, et al., J. Phys. Chem. C, 2011, 115, 5809–5816 CAS.
- R. Nilton Jr and A. C. J. Mota, J. Braz. Chem. Soc., 2005, 16, 691–694 CrossRef.
- W. Xinxing, Q. Xiaolei and S. Jingming, et al., Ind. Catal., 2017, 25, 61–65 Search PubMed.
|
| This journal is © The Royal Society of Chemistry 2018 |
Click here to see how this site uses Cookies. View our privacy policy here. 
 Open Access Article
 This Open Access Article is licensed under a Creative Commons Attribution-Non Commercial 3.0 Unported Licence
 *a
*a