 Open Access Article
Pit evolution around the fusion line of a NiCrMoV steel welded joint caused by galvanic and stress-assisted coupling corrosion
Shuo Weng a,
Yuhui Huanga,
Fuzhen Xuan
 *a and
Fuqian Yang
 *b
*b
aKey Laboratory of Pressure Systems and Safety (MOE), School of Mechanical and Power Engineering, East China University of Science and Technology, Shanghai 200237, P. R. China. E-mail: fzxuan@ecust.edu.cn; Tel: +86 021 6425 2189
bMaterials Program, Department of Chemical and Materials Engineering, University of Kentucky, Lexington, KY 40513, USA. E-mail: fyang2@uky.edu
First published on 17th January 2018
Abstract
The corrosion of NiCrMoV steel welded joints is performed in an aqueous solution of 3.5 wt% NaCl at 180 °C in a container at a pressure of 0.8 MPa. The specimens in the shape of cylindrical tensile rods are immersed in the aqueous solution under the action of tensile stress in a range of 0 to 0.9 of the yield stress of the base metal. The experimental results suggest that there is macro-galvanic corrosion in the welded joint with the coarse-grained heat affected zone (CGHAZ) as anode due to the highest corrosion susceptibility of the CGHAZ. The CGHAZ has the highest positive current density in the welded joints as measured by the scanning vibrating electrode technique. The two-parameter Weibull distribution function, which is represented by the Weibull modulus and characteristic strength, is used to analyze the distribution of the depth of pits at different immersion times. Both the Weibull modulus and characteristic strength are calculated, and found to be dependent on the applied tensile stress. The values of the characteristic pit depth and the average pit depth reveal that there are two mechanisms controlling the corrosion of the NiCrMoV steel welded joints; one is galvanic corrosion, and the other is stress-assisted corrosion.
1. Introduction
The continuous increase in the power capacity of power plants has led to the challenge of manufacturing nuclear steam turbine rotors of large sizes. Welding has been extensively used in joining turbine rotors. The use of filler in the welding and the non-uniform distribution of microstructures formed during the welding have introduced a dissimilarity between the base metal (BM) and weld metal (WM), which can seriously deteriorate the structural integrity of the welded joints and have raised concerns over the performance and reliability of steam turbines due to possible reduction of the corrosion resistance.There are various factors controlling galvanic corrosion of welded joints or dissimilar metals (microstructures), including stress,1,2 relative size between anode and cathode,3–5 compositions (precipitation),6–10 microstructures,10–16 and temperature.5,17 In all the scenarios of stress-assisted corrosion, stress and stress-induced defects likely can accelerate local corrosion rates and cause early failure of mechanical structures. It is known that local corrosion likely occurs in heat affected zone (HAZ) in comparison with base metal and weld metal, since the differences in elemental constituents and microstructures can generate the gradient of corrosion potential, promoting local electrochemical reactions.4,18 Zhu et al.19 found that the corrosion rate of HAZ in the welded joint of 3Cr low alloy pipeline steel was the largest in a CO2-containing environment although galvanic corrosion with free potential being close to the coupled potential was negligible. Huang et al.4 reported the occurrence of severe corrosion in the fusion zone of Inconel 718 welded joint due to a relatively active corrosion potential and small area in comparison with the adjacent HAZ and BM. Zhang et al.20 reported that the HAZ of welded X70 pipeline steel had the largest dissolution current in near-neutral pH solution with hydrogen charging, and the current at the HAZ increased with the increase of applied stress. Ma et al.21 noted that the intercritical HAZ of the E690 welded joint was the most vulnerable location to stress corrosion cracking (SCC) in simulated marine environment containing SO2. Lu et al.22 studied the corrosion cracking in the HAZ of 316NG welding joint in high temperature water, and revealed higher corrosion-cracking susceptibility in the HAZ than in the base metal. Using welding process or cold working (CW), Yamazaki et al.23 introduced prior deformation in Alloy 600 materials, and investigated the effect of prior deformation on the SCC of Alloy 600 materials in a simulated pressurized water reactor primary water environment. They found extensive intergranular SCC in the HAZ of the Alloy 600, 8% and 20% CW Alloy 600 specimens. The crack growth rate in the HAZ of the Alloy 600 is compatible with that in the 8% CW base metal, significantly lower than that in the 20% CW base metal, and much higher than that in the as-received base metal.
There are reports on the cracking of welded joints associated with stress-assisted corrosion or strain-assisted corrosion.13,21,24–26 Using slow strain rate tensile (SSRT) test under controlled potential and U-bend static load tensile test at free corrosion potential, Li et al.13 examined the SCC of stainless steel transition welded joint, A508-309L/308L, in simulated pressured water reactor primary water environment, containing low levels of sulphate, at 292 °C, and found that there were two failure modes for the SCC during the slow strain rate test; one is for high applied potentials (≥−200 mV) – the maximum SCC crack growth rates were larger than 2 × 10⁻⁶ mm s−1 and the other one is for low applied potentials (≤−100 mV) – the specimens failed in ductile mode. Liu et al.26 studied the SCC behavior of welded API X70 pipeline steel in simulated underground water using the slow strain rate test, and observed the increase of the SCC susceptibility of the hardened microstructure likely due to hydrogen charging. Yeh et al.27 investigated the SCC of the transition regions of the welded joints of dissimilar metal welds between 304L stainless steel and Alloy 82 via slow strain rate tensile test at 280 °C in pure water with a dissolve oxygen level of 300 ppb, and found that the post-weld heat treatment of the welded joints had a detrimental effect on the degree of SCC. Note that most studies of the SSRT had increased tensile stress to fracture stress without intermediate pause, which makes it impossible to observe the transition of pit-to-cracking during the SSRT tests. Such an approach has hindered our understanding of the mechanisms controlling the transition of pit-to-cracking. Turnbull and his co-workers28,29 studied the transition of pit to crack in the SCC of a steam turbine disc steel in different corrosion environment under the action of tensile stress of 90% yield stress, and found that Cl− accelerated the pit growth and the probability for the transition of pit to crack. Luo et al.30 revealed the mechanism of pit initiation and development in the NiCrMoV steel welded joints with the solution of 180 °C, 3.5 wt% NaCl through the U-shaped specimens and deduced a mechanism-related model to describe the pit depth evolution. However, severe and nonuniform extremely plasticity existed on the surface of U-shaped specimens, which was ignored to describe its effect on the corrosion in that research. On the other hand, there is little studies focusing on pit evolution around fusion line caused by galvanic and stress-assisted coupling corrosion in the NiCrMoV steel welded joints, which have been extensively used in steam turbines rotors. It is of great importance to understand the stress effect on the galvanic corrosion of NiCrMoV steel welded joints in the simulated environment of low pressure nuclear steam turbines.
This work is focused on the effect of tensile stress on the galvanic corrosion of NiCrMoV steel welded joints in the simulated environment of low pressure nuclear steam turbines. The temporal evolution of pits formed during the immersion in the aqueous solution is analyzed through using the Weibull distribution. The effect of stress on the Weibull modulus and characteristic strength of the Weibull distribution of the pits is revealed.
2. Materials and experimentals
The welded joints of NiCrMoV rotor steel used in this work was prepared by the narrow gap tungsten insert gas (NG-TIG) welding and the narrow gap multilayer submerged arc welding (NG-SAW) techniques. Table 1 lists the chemical compositions of the base metal and the weld metal used in this work, which were determined by the energy disperse spectroscopy (EDS, Oxford). Post-weld heat treatment of the welded joints was performed at 580 °C for 20 hours to relieve the residual stresses generated during the welding and obtain relatively homogeneous microstructures.| C | Si | Mn | P | S | Cr | Ni | Mo | V | Cu | Fe | |
|---|---|---|---|---|---|---|---|---|---|---|---|
| BM | 0.22 | 0.10 | 0.21 | 0.01 | 0.01 | 2.3 | 2.2 | 0.7 | 0.1 | 0.05 | Bal. |
| WM | 0.12 | 0.2 | 1.48 | 0.005 | 0.005 | 0.57 | 2.18 | 0.51 | — | — | Bal. |
Specimens of the dimensions of 10 × 10 × 5 mm3 with the HAZ being the middle portion were cut from the welded joints. The specimens were wet-grounded, polished and chemically etched with 4% nitric acid and ethanol. An optical microscope was used to observe the microstructures of the welded joints. The microhardness of the welded joints was measured on a hardness tester with the peak load of 4.9 N and the holding time of 15 s.
The electrochemical properties of the welded joints were characterized over different regions, using electrochemical workstation (PARSTAT2273, AMETEK). The polarization behavior in 3.5 wt% NaCl solution was determined using a three-electrode electrochemical cell system with the specimens as the working electrode, a saturated calomel electrode (SCE) as the reference electrode, and a Pt electrode as the auxiliary electrode. Fig. 1 schematically shows the regions in the specimens used in electrochemical measurement, in which the specimen was used as the working electrode. The surface of the specimen was wet-grounded by a SiC paper of 2000 grits, and cleaned ultrasonically with deionized water and alcohol after the grinding. The working electrode (specimen) was mounted in epoxy resin with the grounded surface of ∼1 cm2 in area being exposed to an aqueous solution of 3.5 wt% NaCl. After immersing the working electrode in the aqueous solution at room temperature for 1 hour, the polarization experiments were carried out at a scanning rate of 1 mV s−1. The corrosion potential and corrosion current density of different regions were recorded.
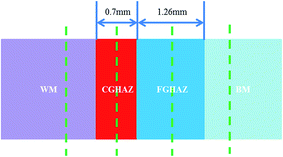 | ||
| Fig. 1 Schematic diagram showing that the specimen location in the different regions of welded joint used in the electrochemical measurement (CGHAZ: coarse-grained HAZ, FGHAZ: fine-grained HAZ). | ||
The scanning vibrating electrode technique (SVET) measurement was performed in the 3.5 wt% NaCl solution after immersing the specimens for 5 hours at room temperature using a Scanning Electrochemical Workstation (VersaSCAN, AMETEK, USA). The specimen was prepared with HAZ locating in the middle portion. The vibrating electrode was platinum–iridium with a tip diameter of 10 μm, and the electrolyte depth above the surface of the specimens was 1 mm. The distance between the tip and the surface of the specimens was 0.1 mm, and the scanning area was 4 × 14 mm2. The vibration frequency was 80 Hz, and the peak-to-peak amplitude was 30 μm.
To observe the evolution of damage on a reasonable time scale in laboratory for understanding the corrosive mechanisms in the aqueous solution of 3.5 wt% NaCl, the corrosion tests of the specimens were performed at 180 °C in a container at a pressure of 0.8 MPa. Fig. 2 shows schematically the self-loaded structure and the dimensions of the specimens for the corrosion test. Both the holding fixture and nut were made of the NiCrMoV steel, and Teflon film was used to separate the holding fixture from the self-loaded structure, which was made of 304 stainless steel. This design likely avoids the possibility of galvanic corrosion due to the material difference between the self-loaded structure and the holding fixture during the corrosion tests. There were two sauce washers in the series connection, which were used to limit possible relief of applied stress during the corrosion test. Tensile stress in a range of 0.3–0.9σY (σY is the yield stress of the base metal) was first applied to the specimens, which were then immersed in the 3.5 wt% NaCl solution.
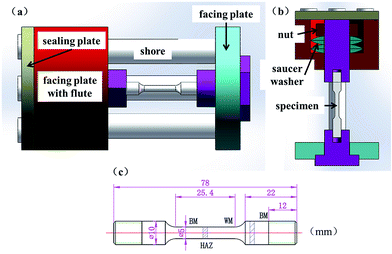 | ||
| Fig. 2 Schematic diagrams of: (a) overall view of the assembly, (b) sectional view of self-loaded frame and specimen, and (c) dimensions of specimen. | ||
Interrupt tests were used to examine the temporal evolution of the morphology of the welded joints during the corrosion test. The specimens removed from the container were firstly cleaned ultrasonically with deionized water and alcohol in order. SEM (scanning electron microscopy) was used to analyze the corrosive surface of the specimens on an EVOMA 15 (Zeiss) with a secondary electron detector at an accelerating voltage of 20 kV in a chamber with pressure less than 1.0 × 10⁻⁵ Pa. Infinite focus microscope (IFM, Alicona G4) was used to measure the depths of corrosion pits. After the surface characterization, the specimens were re-immersed in the 3.5 wt% NaCl solution to continue the corrosion test. The surfaces of the specimens subjected to the tensile stress of 0, 0.3, and 0.6σY were examined four times at the immersion time of 165, 588, 1080, and 1254 hours, and the surface of the specimen subjected to the tensile stress of 0.9σY was examined three times at the immersion time of 165, 588, and 1080 hours. All the specimens after the corrosion tests were cut along the direction perpendicular to the normal of the cross section of the pits to observe the detailed outline of pits.
3. Results
3.1 Microstructures observation and microhardness distribution
Fig. 3 shows typical microstructures of the materials near the welded joint. The base metal consists mainly of tempered martensites of large sizes with a small amount of granular tempered bainites (Fig. 3a). The average grain size of the base metal is ∼60.45 μm. There are granular tempered martensites distributed relatively uniformly in the fine-grained HAZ (FGHAZ) with an average grain size of ∼2.88 μm (Fig. 3b). The coarse-grained HAZ (CGHAZ) consists of tempered martensites of large sizes surrounded by a large amount of granular tempered bainites (Fig. 3c). The average grain size in the CGHAZ is ∼26.2 μm and much smaller than the base metal. In the weld metal, there are a large amount of tempered needlelike bainites and a small amount of randomly distributed δ-ferrites (Fig. 3e). Near the fusion interface, more δ-ferrites of relatively large sizes were formed due to the process of multi-welding at high temperature (Fig. 3d).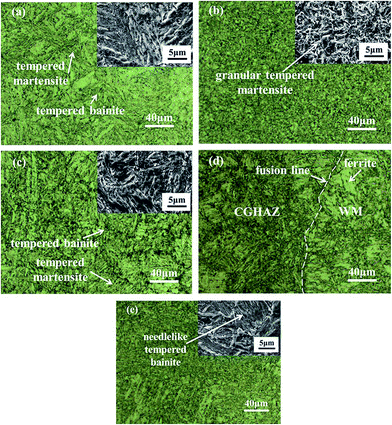 | ||
| Fig. 3 Microstructures around a welded joint; (a) base metal (BM), (b) fine-grained heat affected zone (FGHAZ), (c) coarse-grained heat affected zone (CGHAZ), (d) fusion zone and (e) weld metal (WM). | ||
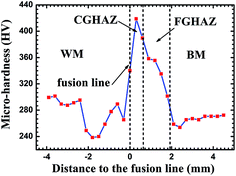
Fig. 4 shows the spatial distribution of microhardness of a welded joint. It is evident that the CGHAZ has the highest microhardness. The microhardness decreases from the highest value in the CGHAZ to that of the base metal with the increase of the distance to the fusion interface. The average hardness values of BM, FGHAZ, CGHAZ and CGHAZ are 266.2 HV, 337.6 HV, 382.9 HV, and 273.6 HV, respectively. The differences among the microhardnesses are due to the differences in the microstructures. It has been reported that ferrites have the smallest hardness, and martensites have the highest hardness among ferrites, bainites and martensites.31–33 Such a trend suggests that the fraction of ferrites decreases gradually from the CGHAZ to the WM according to the value of hardness in different regions. The CGHAZ has the highest hardness, which can be attributed to the presence of wider laths and carbide precipitates in the laths.14,32 The FGHAZ consisting of granular tempered martensites has a smaller hardness than that of lathy martensites and the CGHAZ. Note that the hardness is a function of grain size. The larger the grain size, the lower is the hardness.34,35 Thus, the BM with large grain sizes has a lower hardness than the CGHAZ.
3.2 Corrosive surface observation
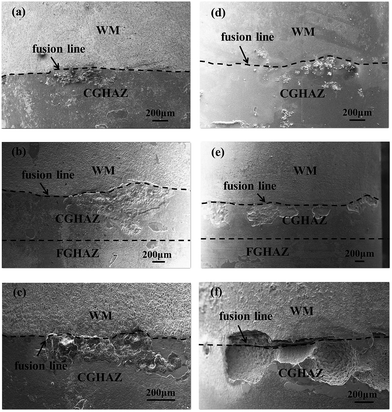
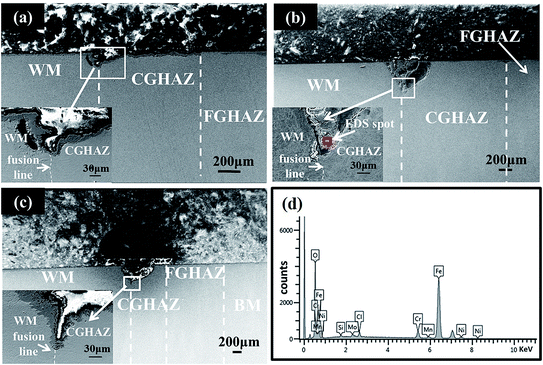
Fig. 5 shows the SEM images of the surfaces in the corroded welded joints at different immersion times at two different stress states; one was stress-free, and the other was subjected to a tensile stress of 0.9σY. Independent of the applied stress, oxidation occurred. There are oxides presented in the CGHAZ near the fusion interface for the immersion time of 165 hours for both welded joints, as shown in Fig. 5a and d. Note that relatively-uniformly distributed oxides were formed in the weld metal and the CGHAZ far away from the fusion line. From Fig. 5b and e, it is evident that there are corrosion pits distributing in the CGHAZ near the fusion line after both specimens were immersed for 588 hours. The formation of the pits is associated with the local separation of the oxide films from the welded joint, resulting in the penetration of chlorides through the oxidation films and the occurrence of corrosive attack, which eventually leads to the detachment of the oxidation films from the welded joint. It is evident that the number and average size of the pits presented in the CGHAZ without the action of stress are slightly less than the corresponding ones in the CGHAZ with the action of the tensile stress of 0.9σY. The average size of the pits increases after the specimens being immersed in the NaCl solution for 1080 hours (Fig. 5c and f). There likely existed the coalescences of the pits especially under the action of the tensile stress of 0.9σY, resulting in the formation of pits of large sizes. Also, the average depth of the pits formed under the action of the tensile stress of 0.9σY is much larger than that without the action of tensile stress.All the specimens after the corrosion tests were cut along the direction perpendicular to the normal of the cross section of the pits. The detailed profile of the pits were examined by SEM. Fig. 6a–c shows SEM images of the cross section of the corroded joints under the action of different tensile stresses at different immersion times. All the SEM images clearly reveal that the majority of the pits are located in CGHAZ, and the depths of pits near the fusion line are larger than those in other regions. Also, the average depth of the pits formed under the action of tensile stress is much larger than that without tensile stress, since tensile stress can cause the breakdown of oxide films and accelerate corrosive attack.36–38 The CGHAZ especially in the region near the fusion interface is more susceptive to corrosion than other regions in the welded joints.
From Fig. 6b and c, one can note that there exist cracks formed along the fusion line for the welded joint under the action of tensile stress. The cracks were filled with the products formed during the corrosion, suggesting the possibility of corrosion-induced crack. Fig. 6d depicts the EDS analysis of the chemical compositions of the corrosion products, shown in Fig. 6b, and Table 2 lists the chemical compositions of the corrosion products. The corrosion products likely consist of the oxides of Fe, Cr, Mo and Ni. The presence of Cl suggests that Cl also penetrated into the oxides, which severely accelerated the corrosive attack.
| Element | O | Si | Cl | Cr | Mn | Fe | Ni | Mo |
|---|---|---|---|---|---|---|---|---|
| Content | 25.21 | 0.51 | 1.28 | 4.18 | 0.61 | 64.30 | 2.12 | 1.79 |
3.3 Electrochemical measurements
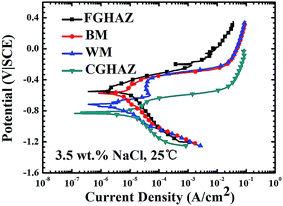
Fig. 7 shows the polarization curves of BM, FGHAZ, CGHAZ and WM in a welded joint. The corrosion potential and the corrosion current density of different regions are obtained from Fig. 7 and listed in Table 3. The corrosion potential of the CGHAZ (ca. −0.815 V|SCE) is the lowest, and the corrosion potential of the FGHAZ (ca. −0.540 V|SCE) is the highest. In general, the lower corrosion potential is, the higher the corrosion susceptibility is. The CGHAZ has the lowest resistance to corrosion in the 3.5 wt% NaCl solution. According to the theory of mixed potential,39,40 it needs to have electrochemically dissimilar metals, such as corrosion potential difference between materials, for galvanic corrosion to occur. The lowest corrosion potential of the CGHAZ suggests that the CGHAZ has the highest corrosion susceptibility for local galvanic corrosion and is anodically polarized through galvanic interaction with other regions of the welded joint. The corrosion current density of the CGHAZ (∼14.1 μA cm−2) is the largest and much larger than that of WM (∼3.84 μA cm−2) in accord with the results shown in Fig. 5a–c and 6a.| Zone | Corrosion potential (V) | Corrosion current (A cm−2) |
|---|---|---|
| BM | −0.575 | 7.37 × 10⁻⁶ |
| FGHAZ | −0.540 | 1.09 × 10⁻⁵ |
| CGHAZ | −0.815 | 1.41 × 10⁻⁵ |
| WM | −0.715 | 3.84 × 10⁻⁶ |
For local galvanic corrosion, the current density of anode is higher than that of cathode. The anode material dissolves and migrates to cathode, and corrosion occurs preferentially at anode. Fig. 8 shows the SVET current density map of the welded joint immersed in the 3.5 wt% NaCl solution at room temperature for 5 hours. The current density of the CGHAZ is positive and relatively high, suggesting that the local corrosion preferentially occurs in the CGHAZ.
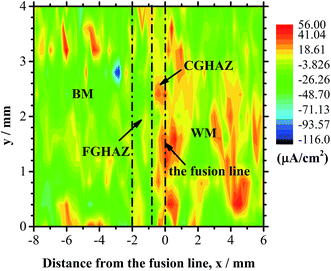 | ||
| Fig. 8 SVET current density maps showing the distribution of current density over the welded joint immersed in the solution of 3.5 wt% NaCl at room temperature for 5 hours. | ||
Fig. 9 shows the distribution of the average current density obtained from SVET current density map over the lines of Y = 0, 1.2, 2.4, and 3.6 mm in Fig. 8. It is evident that the average current density of the CGHAZ is the highest in accord with the SVET current density map, which also reflects obviously that CGHAZ reacts as the anode in the galvanic corrosion of welded joint. Both the electrochemical measurement and SVET measurement reveal that the CGHAZ has the highest corrosion susceptibility for local galvanic corrosion, which is supported by the immersion test.
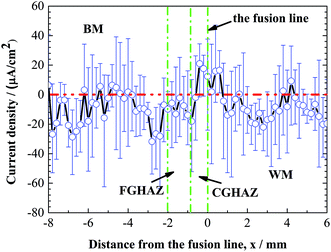 | ||
| Fig. 9 Distribution of average current density from the SVET current density map over the lines of y = 0, 1.2, 2.4 and 3.6 mm in Fig. 8. | ||
3.4 Analysis of pit growth in CGHAZ
From the results of the electrochemical measurement and immersion tests, it can be concluded that the CGHAZ is the most susceptive region of the welded joint, in which there exist lots of corrosion pits with larger dimensions than those in other regions due to local galvanic corrosion. It is of practical importance to examine the temporal evolution of the pits in the CGHAZ for assessing the structural durability of the welded joints used in nuclear steam turbine rotors.It is known that a Weibull distribution has been used to reasonably describe the likelihood of a pit to crack.29,41,42 Turnbull et al.42 had used Weibull statistics to analyze the evolution of stress corrosion cracks from corrosion pits, assuming that the initial distribution of stable pit depths can be defined by the three-parameter Weibull distribution. In addition, C. Chandrasatheesh et al.43 revealed the time of pit initiation and development follow the Weibull distribution. Following the approach given by Turnbull et al.,42 one can assume that the distribution of the pit depth can be described by the three-parameter Weibull distribution as
 | (1) |
 | (2) |
 | (3) |
Thus, the Weibull distribution function of the pit depth can be plotted linearly with the ordinate being lnln[1/(1 − F(x))] and the abscissa being ln![[thin space (1/6-em)]](https://www.rsc.org/images/entities/char_2009.gif) x.
x.
Fig. 10 shows the statistical distribution of the depth of the pits formed in the CGHAZ of the welded joints, which were immersed in the aqueous solution of 3.5% NaCl at 180 °C in a container at a pressure of 0.8 MPa under the action of different tensile stresses. Using eqn (3) to curve-fit the experimental data shown in Fig. 10, one obtains the parameters of m and x0, which are listed in Table 4. It is evident that the distribution of the pit depth can be described very well by the two-parameter Weibull distribution function, independent of the tensile stress applied.
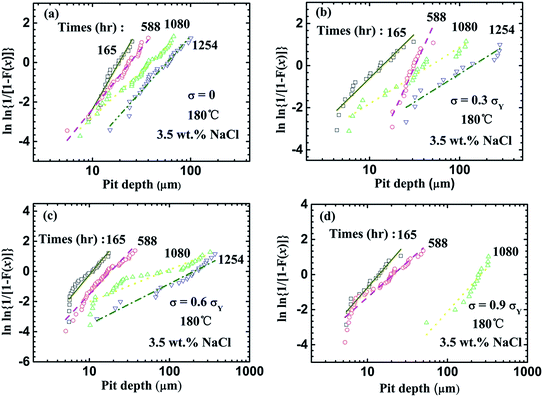 | ||
| Fig. 10 Weibull distribution of the depths of the pits formed in the CGHAZ of the welded joints under the action of different tensile stresses (σY); (a) 0, (b) 0.3, (c) 0.6, and (d) 0.9. | ||
| Tensile Stress (σY) | Immersion Time (hours) | |||||||
|---|---|---|---|---|---|---|---|---|
| 165 | 588 | 1080 | 1254 | |||||
| m | x0 | m | x0 | m | x0 | m | x0 | |
| 0 | 3.78 | 18.64 | 2.67 | 24.18 | 2.02 | 39.22 | 2.40 | 57.31 |
| 0.3 | 1.82 | 13.91 | 4.07 | 32.04 | 1.16 | 47.36 | 1.16 | 139.75 |
| 0.6 | 2.77 | 10.84 | 2.46 | 18.51 | 0.92 | 88.50 | 1.17 | 200.75 |
| 0.9 | 2.27 | 13.90 | 1.76 | 21.04 | 2.18 | 262.44 | — | — |
The Weibull modulus of m in eqn (2) represents the homogeneity of the Weibull distribution of the pit depth, and a high value of m indicates a high degree of homogeneity. Fig. 11 shows the Weibull modulus for the pit depth at different immersion times under the action of different tensile stresses. It is evident that the Weibull moduli of the pit depth at the immersion times of 165 and 588 hours are relatively larger than those at 1080 and 1254 hours, especially for the welded joints subjected to the tensile stress of 0.3 and 0.6σY. The results suggest that the nucleation of the corrosion pits, which depends on the distribution of defects, was statistically random at the beginning of the immersion corrosion tests. The pits grow deeper and wider during the corrosion tests, as shown in Fig. 5, and there are large differences in the pit depths after the immersion time is equal to or larger than 1080 hours. Such behavior is likely due to the coalescence of the existing pits and the formation of new pits after prolonged immersion test. In general, chlorides continuously migrate to the corroded surface during the immersion test, leading to the continuous dissolution of the material and the increase of the geometrical dimensions of the existing pits. Eventually, two or multiple pits will coalesce to form a “big” pit. It is also known that there likely exists an incubation time for the nucleation of new pits. One expects that new pits will form during the immersion test. Both the coalescence of corrosive pits and nucleation of new corrosive pits will alter the Weibull modulus of the corrosive pits.
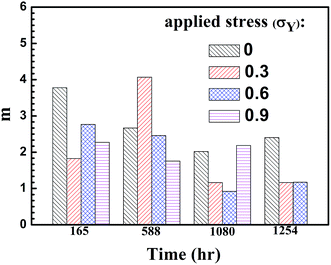 | ||
| Fig. 11 m values of the two-parameter Weibull distribution function of the pit depth at different immersion times. | ||
Note that the Weibull moduli for the corrosive pits formed without tensile stress generally are larger than those with the action of tensile stress at the same immersion time, except the case with the tensile stress of 0.3σY at the immersion time of 588 hours. The reason for such a difference is unclear. In addition, there is little change in the Weibull modulus for the corrosive pits formed with the tensile stress of 0.9σY, suggesting that there is little change in the relative distribution of the pit depth during the corrosion test and the evolution of corrosive pits and the pit depth was controlled mainly by the tensile stress.
Fig. 12 shows the characteristic pit depth for the corrosive pits formed under the action of different tensile stresses at different immersion times. The characteristic pit depth increases with increasing the immersion time, independent of the stress state, as expected. This result reveals the continuously corrosive attack experienced by the welded joints. There is a significant difference in the characteristic pit depth for the welded joints under the action of tensile stresses of 0.6 and 0.9σY, when the immersion time is equal to or larger than 1080 hours. This trend reveals the effect of tensile stress on the corrosion of the CGHAZ in the 3.5 wt% NaCl solution, i.e. tensile stress accelerates the corrosive attack to the CGHAZ and dissolution of the material in the CGHAZ.
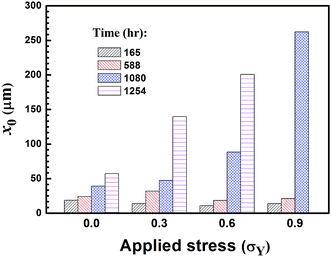 | ||
| Fig. 12 x0 values of the two-parameter Weibull distribution function of the pit depth for different tensile stresses. | ||
Using the Weibull distribution function, one can calculate the average pit depth. Fig. 13 depicts the variation of the average pit depth at different immersion times with tensile stress. For the immersion time equal to or less than 588 hours, the average depth of the corrosive pits is approximately adjacent independent of the tensile stress, i.e. the tensile stress has little effect on the corrosive attack and the evolution of the depth of the corrosive pits. The local galvanic corrosion likely is the dominant mechanism controlling the corrosion of the CGHAZ in the welded joints for the immersion time equal to or less than 588 hours under the experimental conditions. For the immersion time equal to or larger than 1080 hours, the average depth of the corrosive pits increases significantly with the increase of the tensile stress at the same immersion time, indicating that stress-assisted corrosion becomes the dominant mechanism controlling the corrosion of the CGHAZ for the experimental conditions. There exists an incubation period for the stress-assisted corrosion to become the dominant mechanism controlling the corrosion of the CGHAZ for the experimental conditions used.
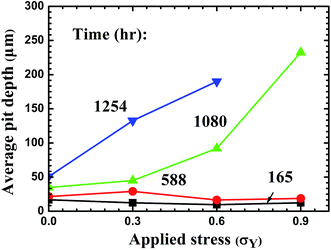 | ||
| Fig. 13 Variation of average pit depth in the CGHAZ with tensile stress for different immersion times. | ||
4. Discussion
From the electrochemical and SVET current density measurement, it can be concluded that the CGHAZ in the welded joint had the lowest corrosion resistance. The corrosion susceptibility of a material is a function of chemical composition and microstructures, such as grain size and precipitations. Both the FGHAZ and BM consisted predominately of tempered martensites, and WM consisted mainly of tempered bainites. The WM, CGHAZ, FGHAZ, and BM exhibit distinct corrosion susceptibility, as expected, since the corrosion susceptibilities of austenite, martensite, bainite and ferrite from the lowest to the highest are austenite, martensite, bainite and ferrite.8,11,15 The FGHAZ and BM have better corrosion resistance than the CGHAZ and WM. The smaller average grain size in the FGHAZ than the BM increases the corrosion resistance of the FGHAZ45,46 in accord with the current density distribution shown in Fig. 8 and 9. The small amount of δ-ferrites, which distributes randomly in the welded metal and has the highest corrosion susceptibility, can lead to the increase of the corrosion susceptibility of the WM.It is interesting to note that the corrosion resistance of the CGHAZ is smaller than the WM, which is in contrast to the corrosion susceptibility of the tempered martensites in the CGHAZ being less than that of the tempered bainites in the WM. Such behavior is likely due to the presence of granular tempered bainites around the tempered martensites in the CGHAZ, as shown in Fig. 3c. The granular tempered bainites around the tempered martensites likely introduce local micro-galvanic corrosion between martensite and bainite, which accelerates the corrosion of martensite on the microscale and increases the corrosion susceptibility of the CGHAZ.47
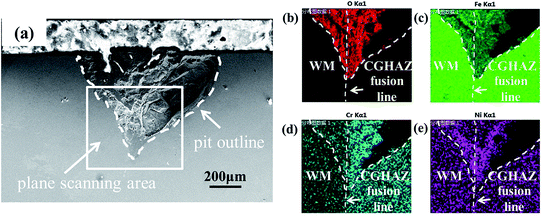
Fig. 14b–e show the EDS maps of elements around the corrosion pit shown in Fig. 14a. It is evident that the concentration of Cr in the CGHAZ is higher than that in the welded metal. There are reports48 that the well-known susceptibility of austenitic stainless steels to intergranular corrosion after heat-treatment in the temperature range of 550–800 °C is due to the depletion of Cr from regions of the alloy matrix adjacent to grain boundaries, resulting in the loss of the ability to form a passive film. However, Cr can react with C to form Cr23C6,48 which can precipitate in grain boundaries. As suggested by Weng et al.31 and Bilmes et al.,8 the precipitates of carbides likely increase the corrosion susceptibility of the CGHAZ. The higher concentration of Cr in the CGHAZ than the weld metal can cause a relatively large amount of the precipitates of carbides and reduce the corrosion resistance of the CGHAZ. Thus, it is a combining effect of the micro-galvanic corrosion, precipitates, and microstructures that determine the highest corrosion susceptibility of the CGHAZ in the welded joint.
As shown in Fig. 12 and 13, there exists significant change in the average pit depth and characteristic pit depth due to stress-assisted corrosion for the tensile stresses of 0.6 and 0.9σY for the immersion time equal to or larger than 1080 hours. Bockris et al.49 reported that elastic stress had no effect on the dissolution rate of iron while plastic stress caused the increase of anodic current. Wu et al.50 found that elastic stress had a limited effect on corrosion and the corrosion rate in comparison with plastic stress. Cheng and his co-workers51,52 studied the effect of applied stress on the anodic dissolution of X70 or X100 pipeline steel with micro-electrochemical measurements (scanning vibrating electrode technique and local electrochemical impedance spectroscopy) and found that the dissolution rate under the action of elastic tensile stress was not significant while the plastic stress accelerated the anodic dissolution obviously at crack tip due to stress concentration. Nishimura et al.53–55 observed that there were three regions on the corrosion-related cracking, including corrosion-dominated region, stress and corrosion-dominated region (which was referred to as stress corrosion cracking dominated region), and stress-dominated region. For an applied tensile stress less than the yield stress of a material, the failure of the material in a corrosive solution is dominated by corrosion.
In general, the corrosion of a material involves the migration/diffusion of ions/atoms, which is a thermal activation process. Under the action of mechanical stress, there are complex mechanochemical interactions or multiple physicochemical processes on the interface of material and solution during corrosion. The migration/diffusion of ions/atoms becomes stress-limited thermal activation process with the apparent activation energy (or energy barrier) being a function of stress. The rate of a global corrosion phenomenon is dependent on concentrations, concentration gradients, electric potentials, mechanical stresses, strain rate, etc.56,57 To have ions/atoms separate from the surface of a material in an aqueous solution, there must be a driving force larger enough to overcome the interaction between the ions/atoms and the material.
It is known that yield stress of a crystalline metal is associated with the motion of dislocations under the action of stress, which requires to break the atomic bonds around the dislocations. For the stress less than the yield stress, there is no enough force/energy to break the atomic bonds, and the probability of atomic migration is independent of stress, i.e. the elastic stress has no significant effect on the apparent activation energy. With the increase of the stress compatible with or larger than the yield stress, the atomic migration becomes stress-dependent.
Similarly, there exists stress effect on the corrosion of the welded joint. For the tensile stress less than the yield stress, the stress effect is limited, since the applied stress is not larger enough to overcome the bonding strength between ions/atoms and the material. With the immersion time less than 588 hours, the average depth of the corrosion pits formed is relatively small for the tensile stresses used. The corresponding plastic zone in the front of the pits is also relatively small, especially for the tensile stresses of 0 and 0.3σY, since the size of the plastic zone is proportional to (σ/σY)2 and approximately to the pit size of the crack-like shape. The material in the plastic zone experiences an effective stress with the magnitude of yield stress. There is limited material under the state of plastic deformation, which limits the growth rate of the corrosion pits. With the increase of the immersion time equal to or larger than 1080 hours, large and deep corrosion pits were formed for the tensile stresses of 0.6 and 0.9σY due to the large plastic zone formed in the front of the corrosion pits. The temporal evolution of the corrosion pits depends on the deformation state of the material around the pits, which is consistent with the results reported in literature.49,50,58
There are two different mechanisms controlling the corrosion of the NiCrMoV steel welded joints in the aqueous solution of 3.5 wt% NaCl at 180 °C in a container at a pressure of 0.8 MPa. The local galvanic corrosion likely is the dominant mechanism controlling the corrosion of the CGHAZ in the welded joints for the immersion time equal to or less than 588 hours under the experimental conditions. In this process, the initiation and growth of pits in the CGHAZ is mainly controlled by galvanic corrosion, relatively independent of the applied tensile stress. For the immersion time equal to or larger than 1080 hours, stress-assisted corrosion becomes the dominant mechanism controlling the corrosion of the CGHAZ for the experimental conditions, especially for the tensile stresses of 0.6 and 0.9σY. The dissolution rate of pit increases obviously since the deformation state around pit is plastic.
5. Conclusions
The corrosion of the NiCrMoV steel welded joints under the action of tensile stress is investigated in the aqueous solution of 3.5 wt% NaCl at 180 °C in a container at a pressure of 0.8 MPa. The following is the summary of the results.(1) The scanning vibrating electrode technique (SVET) measurement shows that the CGHAZ has the highest current density, which is in consistence with the lowest corrosion resistance measured from the polarization curves. And as the anode in the welded joint, CGHAZ corrodes preferentially due to galvanic corrosion.
(2) The two-parameter Weibull distribution function is used to describe well the distribution of the corrosion pits formed under the action of different tensile stresses at different immersion times. The Weibull moduli of the pit depth evolution suggests that the nucleation of the corrosion pits, which depends on the distribution of defects, is statistically random at the beginning of the immersion corrosion tests. The characteristic pit depth increases with increasing the immersion time, independent of the stress state. This result reveals that the welded joints continuously experience corrosive attack.
(3) The local galvanic corrosion likely is the dominant mechanism controlling the corrosion of the CGHAZ in the welded joints for the immersion time equal to or less than 588 hours under the experimental conditions. For the immersion time equal to or larger than 1080 hours, stress-assisted corrosion becomes the dominant mechanism controlling the corrosion of the CGHAZ for the experimental conditions, especially for the tensile stresses of 0.6 and 0.9σY.
Conflicts of interest
There are no conflicts of interest to declare.Acknowledgements
Supports from National Science Foundation of China (51325504, 51475167) and the Program of Shanghai Subject Chief Scientist (14XD1401300) are greatly acknowledged. The work reported here was partially funded by the Ministry of Education of China through a 111 Project.References
- Z. Wang, B. Liu, Y. Yang, N. Han, G. Zeng, A. Ren and T. Zhang, Eng. Failure Anal., 2016, 62, 21–38 CrossRef CAS.
- Q. Qiao, G. Cheng, W. Wu, Y. Li, H. Huang and Z. Wei, Eng. Failure Anal., 2016, 64, 126–143 CrossRef CAS.
- A. Stenta, S. Basco, A. Smith, C. B. Clemons, D. Golovaty, K. L. Kreider, J. Wilder, G. W. Young and R. S. Lillard, Corros. Sci., 2014, 88, 36–48 CrossRef CAS.
- C. A. Huang, T. H. Wang, W. C. Han and C. H. Lee, Mater. Chem. Phys., 2007, 104, 293–300 CrossRef CAS.
- Z. F. Yin, M. L. Yan, Z. Q. Bai, W. Z. Zhao and W. J. Zhou, Electrochim. Acta, 2008, 53, 6285–6292 CrossRef CAS.
- S. K. Das, P. Munda, S. G. Chowdhury, G. Das and R. Singh, Eng. Failure Anal., 2014, 40, 89–96 CrossRef CAS.
- B. T. Lu, Z. K. Chen, J. L. Luo, B. M. Patchett and Z. H. Xu, Electrochim. Acta, 2005, 50(6), 1391–1403 CrossRef CAS.
- P. D. Bilmes, C. L. Llorente, L. Saire Huamán, L. M. Gassa and C. A. Gervasi, Corros. Sci., 2006, 48(10), 3261–3270 CrossRef CAS.
- E. Mohammadi Zahrani, A. Saatchi and A. Alfantazi, Eng. Failure Anal., 2010, 17(4), 810–817 CrossRef CAS.
- A. I. Karayan and H. Castaneda, Eng. Failure Anal., 2014, 44, 351–362 CrossRef CAS.
- F. Mohammadi, F. F. Eliyan and A. Alfantazi, Corros. Sci., 2012, 63, 323–333 CrossRef CAS.
- L. W. Wang, Z. Y. Liu, Z. Y. Cui, C. W. Du, X. H. Wang and X. G. Li, Corros. Sci., 2014, 85, 401–410 CrossRef CAS.
- G. Li, E. Charles and J. Congleton, Corros. Sci., 2001, 43(10), 1963–1983 CrossRef CAS.
- P. B. Srinivasan, V. Muthupandi, W. Dietzel and V. Sivan, Mater. Des., 2006, 27(3), 182–191 CrossRef CAS.
- Y. Zhao, J. Dong, Y. Ma, L. Zhao and X. Pei, J. Mater. Sci. Technol., 2010, 26(5), 477–480 CAS.
- M. Shirinzadeh-Dastgiri, J. Mohammadi, Y. Behnamian, A. Eghlimi and A. Mostafaei, Eng. Failure Anal., 2015, 53, 78–96 CrossRef CAS.
- F. Varela, Y. Kurata and N. Sanada, Corros. Sci., 1997, 39(4), 775–788 CrossRef CAS.
- W. Wu, S. Hu and J. Shen, Mater. Des., 2015, 65, 855–861 CrossRef CAS.
- J. Zhu, L. Xu, Z. Feng, G. S. Frankel, M. Lu and W. Chang, Corros. Sci., 2016, 111, 391–403 CrossRef CAS.
- G. A. Zhang and Y. F. Cheng, Corros. Sci., 2009, 51(8), 1714–1724 CrossRef CAS.
- H. C. Ma, Z. Y. Liu, C. W. Du, H. R. Wang, X. G. Li, D. W. Zhang and Z. Y. Cui, Corros. Sci., 2015, 100, 627–641 CrossRef CAS.
- Z. Lu, T. Shoji, F. Meng, H. Xue, Y. Qiu, Y. Takeda and K. Negishi, Corros. Sci., 2011, 53(5), 1916–1932 CrossRef CAS.
- S. Yamazaki, Z. Lu, Y. Ito, Y. Takeda and T. Shoji, Corros. Sci., 2008, 50(3), 835–846 CrossRef CAS.
- P. B. Srinivasan, W. Dietzel, R. Zettler, J. F. Dos Santos and V. Sivan, Mater. Sci. Eng., A, 2005, 392(1–2), 292–300 CrossRef.
- A. Venugopal, K. Sreekumar and V. S. Raja, Metall. Mater. Trans. A, 2012, 43(9), 3135–3148 CrossRef CAS.
- Z. Y. Liu, C. W. Du, C. Li, F. M. Wang and X. G. Li, J. Mater. Eng. Perform., 2013, 22(9), 2550–2556 CrossRef CAS.
- Y. K. Yeh, G. R. Huang, M. Y. Wang and C. H. Tsai, Prog. Nucl. Energy, 2013, 63, 7–11 CrossRef.
- D. A. Horner, B. J. Connolly, S. Zhou, L. Crocker and A. Turnbull, Corros. Sci., 2011, 53(11), 3466–3485 CrossRef CAS.
- A. Turnbull and S. Zhou, Corros. Sci., 2004, 46(5), 1239–1264 CrossRef CAS.
- L. Luo, Y. Huang, S. Weng and F. Z. Xuan, Mater. Des., 2016, 105, 240–250 CrossRef CAS.
- S. Weng, Y. H. Huang, F. Z. Xuan and L. H. Luo, Procedia Eng., 2015, 130, 1761–1769 CrossRef.
- M. L. Zhu and F. Z. Xuan, Mater. Sci. Eng., A, 2010, 527(16–17), 4035–4042 CrossRef.
- D. I. Pantelis, E. Bouyiouri, N. Kouloumbi, P. Vassiliou and A. Koutsomichalis, Surf. Coat. Technol., 2002, 161(2–3), 125–134 CrossRef CAS.
- F. Mohammadi, F. F. Eliyan and A. Alfantazi, Corros. Sci., 2012, 63(12), 323–333 CrossRef CAS.
- M. Alizadeh and S. Bordbar, Corros. Sci., 2013, 70(3), 170–179 CrossRef CAS.
- R. W. Staehle, Corros. Sci., 2007, 49(1), 7–19 CrossRef CAS.
- H. Wang and E. H. Han, Electrochim. Acta, 2013, 90(5), 128–134 CrossRef CAS.
- J. Soltis, Corros. Sci., 2015, 90, 5–22 CrossRef CAS.
- K. B. Deshpande, Corros. Sci., 2010, 52(10), 3514–3522 CrossRef CAS.
- R. T. Mousavian, E. Hajjari, D. Ghasemi, M. K. Manesh and K. Ranjbar, Eng. Failure Anal., 2011, 18(1), 202–211 CrossRef CAS.
- I. Weibull, Adv. Aero. Sci., 1962, 335–356 CAS.
- A. Turnbull, L. N. McCartney and S. Zhou, Scr. Mater., 2006, 54(4), 575–578 CrossRef CAS.
- C. Chandrasatheesh, J. Jayapriya, R. P. George and U. Kamachi Mudali, Eng. Failure Anal., 2014, 42, 133–142 CrossRef CAS.
- H. A. Frederic and E. V. Zaretsky, J. Mech. Des., 1989, 112(2), 246–254 Search PubMed.
- S. Bordbar, M. Alizadeh and S. H. Hashemi, Mater. Des., 2013, 45, 597–604 CrossRef CAS.
- M. Alizadeh and S. Bordbar, Corros. Sci., 2013, 70, 170–179 CrossRef CAS.
- E. Liu, Y. Zhang, L. Zhu, Z. Zeng and R. Gao, RSC Adv., 2017, 7(71), 44923–44932 RSC.
- C. Tedmon, D. Vermilyea and J. Rosolowski, J. Electrochem. Soc., 1971, 118(2), 192–202 CrossRef CAS.
- A. Despic, R. Raicheff and J. O. M. Bockris, J. Chem. Phys., 1968, 49(2), 926–938 CrossRef CAS.
- T. Wu, M. Yan, J. Xu, Y. Liu, C. Sun and W. Ke, Corros. Sci., 2016, 108, 160–168 CrossRef CAS.
- X. Tang and Y. F. Cheng, Electrochim. Acta, 2009, 54(5), 1499–1505 CrossRef CAS.
- L. Y. Xu and Y. F. Cheng, Corros. Sci., 2012, 59, 103–109 CrossRef CAS.
- R. Nishimura and Y. Maeda, Corrosion, 2004, 60(7), 650–657 CrossRef CAS.
- R. Nishimura, Corros. Sci., 2007, 49(1), 81–91 CrossRef CAS.
- R. Nishimura and T. Yoshida, Corros. Sci., 2008, 50(4), 1205–1213 CrossRef CAS.
- G. Santarini, Corrosion, 1995, 51(9), 698–710 CrossRef CAS.
- D. Dwivedi, K. Lepková and T. Becker, RSC Adv., 2017, 7(8), 4580–4610 RSC.
- J. Ma, B. Zhang, J. Wang, G. Wang, E. H. Han and W. Ke, Corros. Sci., 2010, 52(9), 2867–2877 CrossRef CAS.
| This journal is © The Royal Society of Chemistry 2018 |

