 Open Access Article
High performance composites of spinel LiMn2O4/3DG for lithium ion batteries
X. D. Luoac,
Y. Z. Yin*b,
M. Yuana,
W. Zenga,
G. Lina,
B. Huangac,
Y. W. Liac and
S. H. Xiao *ac
*ac
aGuangxi Key Laboratory of Electrochemical and Magneto-chemical Functional Materials, College of Chemistry and Bioengineering, Guilin University of Technology, Guilin 541004, China. E-mail: 420466855@qq.com
bQinzhou University, Qinzhou Key Laboratory of Selenium-enriched Functional Utilization of Biowaste Resources, College of Petroleum and Chemical Engineering, Qinzhou 535011, Guangxi, China. E-mail: yinyanzhen2009@163.com
cGuilin University of Technology, Collaborative Innovation Center for Exploration of Hidden Nonferrous Metal Deposits and Development of New Materials in Guangxi, Guilin 541004, China
First published on 3rd January 2018
Abstract
A highly crystalline nanosized spinel LiMn2O4/3DG composite cathode material for high rate lithium ion batteries was successfully prepared by mixing spinel LiMn2O4 particles with reduced graphene oxide (3DG). Spinel LiMn2O4 and reduced three-dimensional graphene oxide were synthesized using a hydrothermal method and freeze-drying technology, respectively. The structure, morphology and electrochemical performance of the synthesized materials were characterized by X-ray diffraction (XRD), scanning electron microscopy (SEM), cyclic voltammetry (CV), electrochemical impedance spectroscopy (EIS) and galvanostatic charge–discharge techniques. The results showed that the LiMn2O4/3DG composites exhibited excellent rate capability and stable cycling performance. The discharge capacity was 131 mA h g−1 and the capacity remains at 89.3% after 100 cycles at a 0.5 C rate, while the discharge capacity was 90 mA h g−1 at 10 C. Compared with spinel LiMn2O4 materials, the LiMn2O4/3DG composites showed obvious improvement in electrochemical performance.
1. Introduction
Lithium ion batteries, with their high energy density, long cycle life, lack of a memory effect, low self-discharge rate, environmental friendliness and many other advantages, have become the primary choice of energy storage device in portable electronics, and have been intensively investigated for use in high power applications.1,2 LiMn2O4 is typically obtained by the reaction of a mixture of lithium salt (e.g. CH3COOLi·2H2O) and manganese oxides at around 750 °C in air for many hours. The high temperature could contribute to achieving highly crystalline spinel LiMn2O4, but it suffers from a problem by causing an oxygen deficiency, which would lead to faster capacity fading during cycling.3–5 In recent years, many other techniques have been reported in a large number of publications, such as hydrothermal and sol–gel methods,2 the Pechni method,6 spray drying,7 microemulsion8 and microwave hydrothermal techniques,9 and controlled crystallization.10Spinel LiMn2O4, as a most promising substitute for LiCoO2 in lithium ion battery cathode materials,11–13 is attracting more and more attention from the public. However, there are also some concerns, such as their large polarization at high charge–discharge rates which results in lower power density, and their unstable spinel structure which causes poor cycling performance.14–16 Based on this, various approaches have been studied to improve their electrochemical performance.17,18 Reducing the particle size and optimizing the morphology were considered good methods and have been widely applied in the previous work,18–21 such as the sol–gel,22 precipitation23 and hard-template routes,24 and the hydrothermal method.25,26 It has also been well established that doping and coating were desirable approaches to improve the power density.27–31 Yue et al.32 employed hydrothermal treatment to synthesize a LiMn2O4/C composite at a lower temperature than the conventional calcination method, and the composite material delivered a discharge capacity of 83 mA h g−1 at a high current density of 2 A g−1. Bak et al.33 successfully synthesized a spinel LiMn2O4/reduced graphene oxide hybrid via a microwave-assisted hydrothermal method, achieving an excellent rate capability. Zhan et al.34 used the hydrothermal method to prepare a 3DG/LFP/C composite, and the electronic conductivity and lithium ion diffusion rate were greatly enhanced.
Three-dimensional graphene, with its huge surface area,35–37 high number of three-dimensional porous channels and excellent conductivity, was undoubtedly a good choice as a carbon coating material. Using three-dimensional graphene was expected to improve the conductivity of the material38,39 and speed up the diffusion rate of lithium ions, thus increasing the electrochemical properties of the material.
In this work, we designed and synthesized optimized spinel LiMn2O4 and three-dimensional reduced graphene oxide using the hydrothermal method and freeze-drying technology, respectively. Based on this, a well-coated nanostructured LiMn2O4/3DG composite with excellent high rate capability and stable cycling performance was synthesized successfully.
2. Experimental
2.1. Synthesis of 3DG
Graphite oxide (GO) gel was synthesized from natural graphite using the modified Hummers method.40,41 The concentration was controlled at 4 mg mL−1. 10% mass content of NiCl2·6H2O was added into 50 mL graphite oxide solution. After being stirred until mixed evenly and subjected to ultrasound at room temperature for 2 h, the mixed solution was put into a 100 mL Teflon-lined stainless steel autoclave at 180 °C for 12 h, then cooled to room temperature. The three-dimensional graphene gel was taken out and cleaned with distilled water several times. After freezing, the three-dimensional graphene was placed in a freeze dryer for 72 h, and three-dimensional porous graphene was collected.2.2. Synthesis of the MnO2 material
MnSO4·H2O and Na2S2O8 were dissolved in deionized water in a specific stoichiometric ratio. After fully mixing, the solution was placed into a 100 mL Teflon-lined stainless steel autoclave at 100 °C for 10 h. After filtration, it was washed three times with deionized water and absolute ethanol, respectively. The washed black precipitate was dried at 80 °C for 20 h or longer to obtain the MnO2 precursors.2.3. Synthesis of LiMn2O4/3DG
Based on the prepared MnO2 precursors, LiOH·H2O was weighed and a specific proportion was used. After mixing in absolute ethanol, the mixture was dried at 80 °C. The mixture was fully ground whilst adding absolute ethanol, then annealed at 450 °C for 6 h in a Muffle furnace. The temperature was then raised to 750 °C for 18 h with a heating rate of 5 °C min−1. After cooling naturally to room temperature, the required spinel LiMn2O4 sample was obtained, labeled as the S-0 sample. 0.25 g 3DG and 0.75 g spinel LiMn2O4 were weighed respectively according to the mass ratio 1![[thin space (1/6-em)]](https://www.rsc.org/images/entities/char_2009.gif) :
:![[thin space (1/6-em)]](https://www.rsc.org/images/entities/char_2009.gif) 3, then the mixture was fully ground with a mortar and placed into the Muffle furnace at 200 °C for 4 h. 3DG/LiMn2O4 composites with different 3DG contents (15%, 25% and 35%) were prepared using the same method, and they were labeled as S-1, S-2 and S-3, respectively.
3, then the mixture was fully ground with a mortar and placed into the Muffle furnace at 200 °C for 4 h. 3DG/LiMn2O4 composites with different 3DG contents (15%, 25% and 35%) were prepared using the same method, and they were labeled as S-1, S-2 and S-3, respectively.
2.4. Characterization
The crystal structures of the materials were characterized with X-ray diffraction (XRD) measurements (Panalytical X’Pert PRO MRD, Holland) with Cu Kα radiation operating at a continuous scan of 2θ = 5–80° at a scan rate of 0.03° min−1. The microstructure of the samples was investigated by field emission scanning electron microscopy (FE-SEM SU5000). The mass percentage of 3DG in the composites was determined by thermogravimetric analysis (TGA) with a SDT-Q600 simultaneous thermogravimetric analyzer under an air atmosphere. Raman spectra were obtained using a Raman Spectrometer (LabRAM HR) with the laser as the excitation source at 532 nm.2.5. Electrochemical measurements
The electrochemical performance of the materials was assessed using 2016-type coin cells. Using the synthesized composite materials as the active material, the cathodes were prepared by mixing the active material, poly(vinylidene difluoride) (PVDF) and carbon black in a mass ratio of 8![[thin space (1/6-em)]](https://www.rsc.org/images/entities/char_2009.gif) :
:![[thin space (1/6-em)]](https://www.rsc.org/images/entities/char_2009.gif) 1
1![[thin space (1/6-em)]](https://www.rsc.org/images/entities/char_2009.gif) :
:![[thin space (1/6-em)]](https://www.rsc.org/images/entities/char_2009.gif) 1 in N-methyl-2-pyrrolidone solvent. Metallic lithium foil was used as the negative electrode. The electrolyte was 1 M LiPF6 solution in ethylene carbonate (EC) and dimethyl carbonate (DMC) (with a volume ratio of 1
1 in N-methyl-2-pyrrolidone solvent. Metallic lithium foil was used as the negative electrode. The electrolyte was 1 M LiPF6 solution in ethylene carbonate (EC) and dimethyl carbonate (DMC) (with a volume ratio of 1![[thin space (1/6-em)]](https://www.rsc.org/images/entities/char_2009.gif) :
:![[thin space (1/6-em)]](https://www.rsc.org/images/entities/char_2009.gif) 1), and Celgard 2300 polyethylene film was used as the separator. The battery was assembled in a high purity argon glove box, with relative water and oxygen standards of less than 0.1 ppm. Electrochemical impedance spectroscopy (EIS) and cyclic voltammetry (CV) were performed on an electrochemical workstation (CHI760e, Shanghai Chenhua Co., Ltd., China). Charge/discharge tests and rate tests were performed using the NEWARE battery test system (BTS-4000, Shenzhen New will Co., Ltd., China) with different current densities.
1), and Celgard 2300 polyethylene film was used as the separator. The battery was assembled in a high purity argon glove box, with relative water and oxygen standards of less than 0.1 ppm. Electrochemical impedance spectroscopy (EIS) and cyclic voltammetry (CV) were performed on an electrochemical workstation (CHI760e, Shanghai Chenhua Co., Ltd., China). Charge/discharge tests and rate tests were performed using the NEWARE battery test system (BTS-4000, Shenzhen New will Co., Ltd., China) with different current densities.
3. Results and discussion
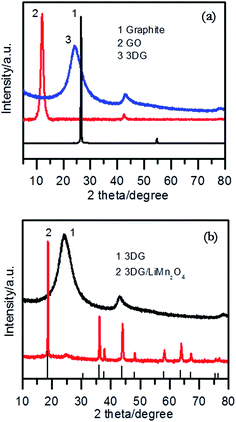
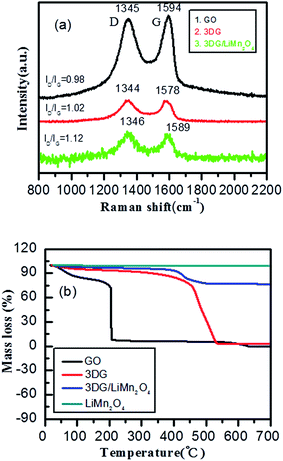
Fig. 1a shows the XRD patterns of graphite, graphite oxide and 3DG. It can be seen that the strong diffraction peak at 2θ = 26.5° corresponding to graphite disappeared, and a diffraction peak at about 2θ = 10.6° appeared, which is the characteristic peak of GO.42 We can see that the diffraction peak shifted to the right as graphite oxide was reduced, and a new diffraction peak for 3DG at 2θ = 24.2° appeared.43 This diffraction peak is relatively broad, which means that the structure of GO was randomly orientated, and that the diffraction was reflected from the side of the three-dimensional structure of GO.44 At the same time, a weaker peak for graphene at about 2θ = 43° was found through careful observation, which is the characteristic peak for graphene based on the chemical reduction of GO. As seen from Fig. 1b, the XRD pattern of 3DG/LiMn2O4 is in accordance with the standard pattern of LiMn2O4 (JCPDS card no. 35-0782).32,38 In addition, a weak diffraction peak at about 2θ = 24.2° corresponding to 3DG appeared, which meant that the 3DG/LiMn2O4 composites were successfully synthesized.To determine the state of the RGO, Raman spectroscopy was used. As seen in Fig. 2a, GO, 3DG and the composite all showed two peaks at approximately 1345 and 1590 cm, which were attributed to the D and G bands of carbonaceous materials, respectively.45 Typically, the D-peak represented a defect and an irregular structure at the edge of the graphene, and the G-peak illustrated the existence of graphitic carbon, representing an ordered sp2 bond structure.46,47 The integrity and order of the graphene crystal structure were characterized using the ratio of the intensity of the D peak and the G peak (ID/IG).48 If the ID/IG value was higher, it meant that the graphene had a higher degree of edge defects and less graphitization of carbon. The ID/IG value of GO was calculated to be 0.98. The edge defects increased and the average size of the sp2 region became smaller, causing an increase of the ID/IG value. This was a result of oxidized graphene film fragmentation in the process of GO being reduced. The ID/IG value of the 3DG/LiMn2O4 composite was greater than that of 3DG (1.12 > 1.02), indicating that the 3DG/LiMn2O4 composite had a higher degree of edge defects. Generally, defects in the carbon materials would result in irreversible lithium ion storage.49 Thus, the addition of 3DG to the 3DG/LiMn2O4 composite led to a larger irreversible capacity than that of LiMn2O4. In addition, the thermal stability of graphene was one of the important indicators of whether GO was being reduced, so we conducted thermogravimetric tests on graphene oxide and reduced graphene oxide samples at 20–750 °C under an air atmosphere. Fig. 2b shows the TGA curves of GO, 3DG, LiMn2O4 and the LiMn2O4/3DG (25% wt) composite. We can see that graphene oxide showed obvious weight loss at 50–100 °C and 150–200 °C, respectively. The first stage was attributed to the weight loss of residual moisture in graphene oxide, while the latter could be due to the mass weight loss of oxygen-containing groups (hydroxyl, epoxy, carbonyl, carboxyl, etc.) in graphene oxide.50,51 Compared to GO, the thermal stability of reduced graphene oxide was significantly improved. This was because the more completely the reduction reaction proceeded, the lower the content of residual labile oxygen-containing groups. Combined with the TGA curve of spinel LiMn2O4, the content of 3DG in the 3DG/LiMn2O4 composite could be preliminarily calculated to be about 21.9%.
SEM images of samples of GO, 3DG, spinel LiMn2O4 and the composite are shown in Fig. 3. As seen from Fig. 3a–c, GO consisted of a number of stacked single layers of graphene oxide, and the reduced three-dimensional graphene was a porous material composed of graphene sheets which were overlapping, wound and wrapped around each other, with the hole diameter ranging from a few nanometers to tens of microns. It was obvious from Fig. 3b that the monolayer three-dimensional graphene was very thin and had a huge surface area. Fig. 3d shows graphene after grinding, the three-dimensional structure of which has been entirely destroyed. Fig. 3e and f shows SEM micrographs of spinel LiMn2O4 and the 3DG/LiMn2O4 composite, respectively. It shows that most of the spinel LiMn2O4 nanoparticles have been embedded in the porous graphene, and only a small portion has been sandwiched between the graphene sheets or exposed to the graphene sheet, which might be due to the incomplete uniformity of the compound of three-dimensional graphene and the spinel LiMn2O4 nanoparticles.
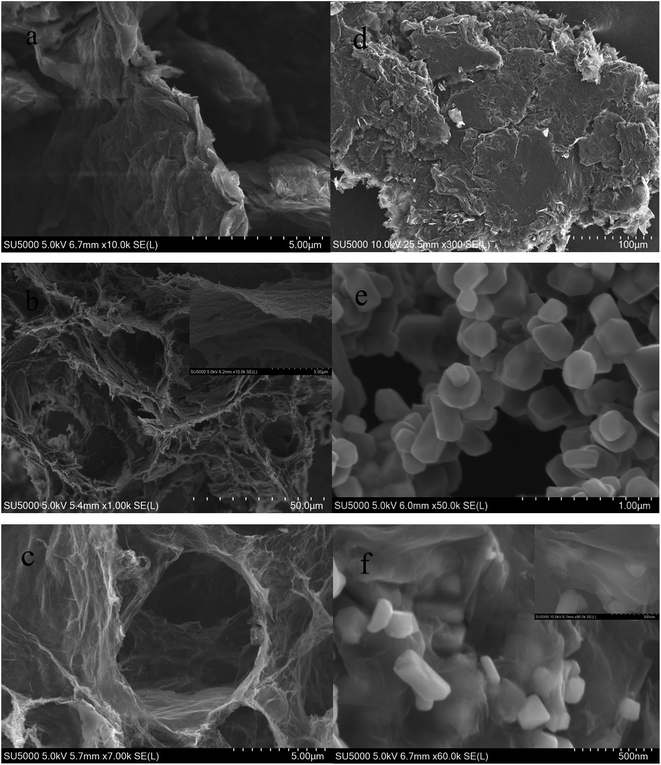 | ||
| Fig. 3 SEM images of (a) GO, (b and c) 3DG, (d) two-dimensional graphene, (e) spinel LiMn2O4 and (f) the 3DG/LiMn2O4 composite. | ||
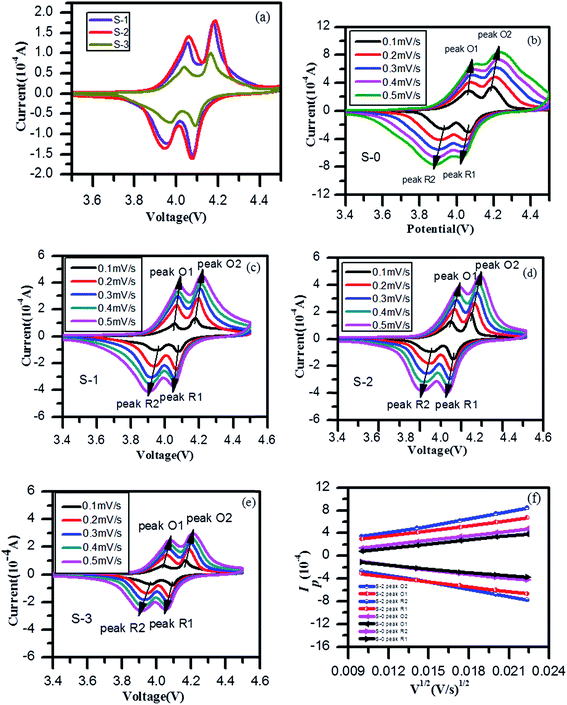
Fig. 4a shows CV curves at 0.1 mV s−1 of three different 3DG/LiMn2O4 composite samples. Two well-defined redox peaks appeared in the CV curves, corresponding to the two processes during which lithium ions were embedded in and removed from the lattice. It is clear from the figure that sample S-3, compared to the other two samples, had the smallest peak currents (Ip) according to the Randles–Sevcik equation:52,53
| Ip = (2.69 × 10⁵)n2/3SD1/2v1/2C0 |
| Diffusion coefficient (cm2 s−1) | ||||
|---|---|---|---|---|
| Oxidation peak 1 | Oxidation peak 2 | Redox peak 1 | Redox peak 2 | |
| S-0 | 1.28 × 10⁻¹¹ | 7.18 × 10⁻¹² | 1.18 × 10⁻¹¹ | 6.25 × 10⁻¹² |
| S-2 | 1.40 × 10⁻¹¹ | 7.60 × 10⁻¹² | 1.27 × 10⁻¹¹ | 8.07 × 10⁻¹² |
The cycling performance of spinel LiMn2O4 and its composites with different 3DG contents over a potential window of 3.0–4.4 V at a current density of 0.5 C are displayed in Fig. 5a. It was clear that the discharge capacity of sample S-2 was higher in each cycle than that of all the other samples. The first discharge capacity of sample S-2 was 131 mA h g−1, exhibiting a higher discharge capacity of 117 mA h g−1 after 100 charge–discharge cycles. While S-0 had only an initial discharge specific capacity of 126 mA h g−1, the discharge capacity was maintained at 110 mA h g−1 after 100 cycles. Compared to the capacity retention rate of 87.3% for sample S-0, the capacity retention rate of S-2 was 89.3% after 100 cycles, which was a favorable improvement, and it also confirmed that the 3DG/LiMn2O4 composite materials had a better cycling stability than spinel LiMn2O4. Fig. 5b illustrates the first charge and discharge curves of samples S-0 and S-2. Two pairs of obvious charge and discharge platforms at about 3.9 V and 4.1 V in both samples correspond to the two-step embedding and removal of lithium ions in different stages of the electrochemical reaction, which are also consistent with the CV curves. In detail, the two discharge platforms of sample S-2 are longer and more even than those of S-0, and this is also a result of smaller polarization. Sample S-2 therefore displayed better electrochemical performance.
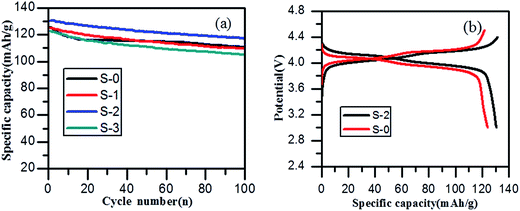 | ||
| Fig. 5 (a) Cycling performance and (b) first charge–discharge profiles of LiMn2O4 and LiMn2O4/3DG at 0.5 C. | ||
To further explore the electrochemical properties of spinel LiMn2O4 and its composites, the rate performance charts of the samples at different charge–discharge rates from 0.2 C to 10 C and then back to 0.2 C were investigated and are shown in Fig. 6a. It was found that sample S-2 delivered reversible capacities of 133 mA h g−1, 130 mA h g−1, 128 mA h g−1, 124 mA h g−1, 112 mA h g−1, 90 mA h g−1 and 128 mA h g−1 at current rates of 0.2 C, 0.5 C, 1 C, 2 C, 5 C, 10 C and finally 0.2 C, respectively, which were better than those of sample S-0 (127 mA h g−1, 121 mA h g−1, 117 mA h g−1, 110 mA h g−1, 80 mA h g−1, 36 mA h g−1 and 120 mA h g−1). Significantly, the discharge specific capacity had been improved especially in terms of the high charge and discharge rates. The specific capacity of S-0 at 10 C was only 36 mA h g−1, while sample S-2 achieved 90 mA h g−1. The better electrochemical performance of the LiMn2O4/3DG composite could be ascribed to the effective three-dimensional conductive network of 3DG, making the particles well connected. Simultaneously, the capacity retention of sample S-2 reached up to 96.2% after a series of charge and discharge cycles, higher than that of spinel LiMn2O4 by 1.7%. As seen in Fig. 6b and c, the charge–discharge platform shortens with an increase in rate, and the discharge specific capacity is constantly declining. This may be due to the fact that the lithium ion diffusion rate and electron transfer rate cannot meet the requirements of high rates, resulting in increased polarization. Different to sample S-0, the addition of 3DG in S-2 greatly improved the conductivity of the material, and the stability of the material was enhanced to some extent, causing a smaller polarization and a longer and more stable discharge platform, thus resulting in an excellent higher rate performance.
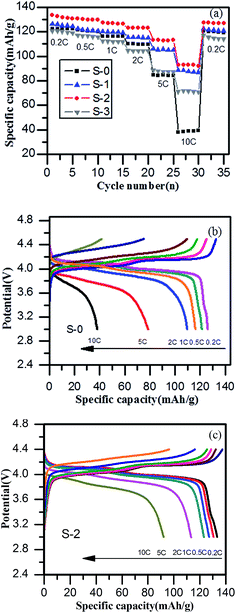 | ||
| Fig. 6 (a) The rate profiles of LiMn2O4 and the LiMn2O4/3DG composites, (b and c) charge–discharge profiles of LiMn2O4 and LiMn2O4/3DG composite at various rates. | ||
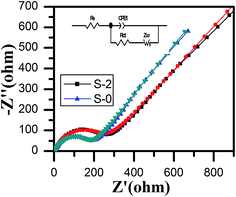
The electrochemical impedance spectra and fitting curves of the LiMn2O4 and LiMn2O4/3DG composite electrodes are displayed in Fig. 7. Both of the profiles consist of a semicircular curve from the high frequency region to the mid frequency region, and a straight line in the low frequency region. It was believed that the semicircle in the high frequency region was caused by charge transfer between the electrolyte and electrode interface, which was called charge-transfer resistance (RΩ), while the straight line in the lower frequency region was due to lithium ion diffusion in the crystal lattice of spinel LiMn2O4, namely the Warburg impedance (Zw).55 By fitting data, the charge transfer impedance values of samples S-0 and S-2 were determined to be 243 Ω and 180 Ω, respectively. Definitely, sample S-2 had a smaller impedance of lithium ion intercalation and de-intercalation of the crystal lattice than that of S-0, indicating that the addition of three-dimensional graphene improved the electronic conductivity of the material. It also increased the number of three-dimensional channels, which are beneficial for lithium ions to migrate, consistent with the SEM images and CV results. Therefore, by coating with three-dimensional graphene, the electrochemical performance of spinel LiMn2O4 has been greatly enhanced.
4. Conclusions
In conclusion, we have successfully synthesized nanoscale LiMn2O4/3DG (15 wt%, 25 wt% and 35 wt%) composites using a simple and low-cost route. XRD analysis confirmed that the graphene peak successfully appeared in the diffraction pattern of spinel LiMn2O4, but had no other side effects on the crystal structure. The CV results showed that the LiMn2O4/3DG (25 wt%) composite had the largest lithium ion diffusion coefficient. Benefiting from the huge surface area and rich three-dimensional porous channels of 3DG, the electronic conductivity of the material and lithium ion diffusion rate have been greatly improved. This research showed that spinel LiMn2O4, through three-dimensional graphene coating, could significantly enhance the rate performance and cycling performance, which is undoubtedly a novel option to improve performance for lithium ion battery cathode materials.Conflicts of interest
There are no conflicts to declare.Acknowledgements
This work was financially supported by the National Science Foundation of China (Grant No. 51364008, 51663020) and the Guangxi Natural Science Foundation (Grant No. 2017GXNSFFA198007).References
- J. Y. Luo, X. L. Li and Y. Y. Xia, Electrochim. Acta, 2007, 52, 4525–4531 CrossRef CAS.
- Y. L. Cui, W. J. Bao, Z. Yuan, Q. C. Zhuang and Z. Sun, J. Solid State Electrochem., 2012, 16, 1551–1559 CrossRef CAS.
- J. M. Tarascon and D. Guyomard, Electrochim. Acta, 1993, 38, 1221–1231 CrossRef CAS.
- T. Ohzuku, M. Kitagawa and T. Hirai, ChemInform, 1990, 21, 3169 Search PubMed.
- J. C. Hunter, J. Solid State Chem., 1981, 39, 142–147 CrossRef CAS.
- W. Liu, G. C. Farrington, F. Chaput and B. Dunn, J. Electrochem. Soc., 1996, 143, 879–884 CrossRef CAS.
- K. Vediappan, W. S. Kim and C. W. Lee, J. Nanosci. Nanotechnol., 2011, 11, 680 Search PubMed.
- A. Subramania, N. Angayarkanni and T. Vasudevan, Mater. Chem. Phys., 2007, 102, 19–23 CrossRef CAS.
- J. Feng, Z. Wang, B. Shen, L. Zhang, X. Yang and N. He, RSC Adv., 2014, 4, 28683–28690 RSC.
- G. Hu, J. Jiang, Z. Peng, K. Du, Y. Cao and J. Duan, J. Nanosci. Nanotechnol., 2013, 13, 2262–2265 CrossRef CAS PubMed.
- X. M. He, J. J. Li, Y. Cai, Y. Wang, J. Ying, C. Jiang and C. Wan, J. Solid State Electrochem., 2005, 9, 438–444 CrossRef CAS.
- X. Xiao, J. Lu and Y. Li, Nano Res., 2010, 3, 733–737 CrossRef CAS.
- T. J. Patey, R. Büchel, S. H. Ng, F. Krumeich, S. E. Pratsinis and P. Novák, J. Power Sources, 2009, 189, 149–154 CrossRef CAS.
- L. J. Xi, H. E. Wang, Z. G. Lu, S. L. Yang, R. G. Ma, J. Q. Deng and C. Y. Chung, J. Power Sources, 2012, 198, 251 CrossRef CAS.
- D. Guo, Z. Chang, B. Li, H. Tang and X. Z. Yuan, J. Solid State Electrochem., 2013, 17, 2849 CrossRef CAS.
- J. Luo, L. Cheng and Y. Xia, Electrochem. Commun., 2007, 9, 1404–1409 CrossRef CAS.
- J. Jiang, Q. Liu, L. Xu, J. Xu, J. Du, X. He and D. Li, J. Nanosci. Nanotechnol., 2016, 16, 12640–12643 CrossRef CAS.
- H. W. Lee, P. Muralidharan and D. K. Kim, J. Korean Ceram. Soc., 2011, 48, 379–383 CrossRef CAS.
- N. N. Sinha and N. Munichandraiah, J. Indian Inst. Sci., 2009, 89, 381–392 CAS.
- L. Xiao, Y. Guo, D. Qu, B. Deng, H. Liu and D. Tang, J. Power Sources, 2013, 225, 286–292 CrossRef CAS.
- M. A. Kiani, M. F. Mousavi and M. S. Rahmanifar, Int. J. Electrochem. Sci., 2011, 6, 2581–2595 CAS.
- X. M. Liu, Z. D. Huang, S. Oh, P. C. Ma, P. C. Chan, G. K. Vedam and J. K. Kim, J. Power Sources, 2010, 195, 4290–4296 CrossRef CAS.
- J. Xie, C. Y. Sun, T. J. Zhu, G. S. Cao, X. B. Zhao and S. C. Zhang, J. Solid State Electrochem., 2013, 17, 2589–2594 CrossRef CAS.
- J. Chen, N. Zhao and J. Zhao, J. Solid State Electrochem., 2017, 1–8 Search PubMed.
- Q. Jiang, X. Wang and H. Zhang, J. Electron. Mater., 2016, 45, 4350–4356 CrossRef CAS.
- H. Zou, B. Wang, F. Wen and L. Chen, Ionics, 2017, 23, 1083–1090 CrossRef CAS.
- Y. Wang, Y. Wang, E. Hosono, K. Wang and H. Zhou, Angew. Chem., Int. Ed., 2008, 47, 7461–7465 CrossRef CAS PubMed.
- G. Xu, Z. Liu, C. Zhang, G. Cui and L. Chen, J. Mater. Chem. A, 2015, 3, 4092–4123 CAS.
- P. Mohan and G. P. Kalaignan, J. Nanosci. Nanotechnol., 2014, 14, 5028–5035 CrossRef CAS PubMed.
- H. Zhang, Z. Li, S. Yu, Q. Xiao, G. Lei and Y. Ding, J. Power Sources, 2016, 301, 376–385 CrossRef CAS.
- S. Lee, Y. Cho, H. K. Song, K. T. Lee and J. Cho, Angew. Chem., Int. Ed., 2012, 51, 8748–8752 CrossRef CAS PubMed.
- H. Yue, X. Huang, D. Lv and Y. Yang, Electrochim. Acta, 2009, 54, 5363–5367 CrossRef CAS.
- S. M. Bak, K. W. Nam, C. W. Lee, K. H. Kim, H. C. Jung, X. Q. Yang and K. B. Kim, J. Mater. Chem., 2011, 21, 17309–17315 RSC.
- T. T. Zhan, W. F. Jiang, C. Li, X. D. Luo, G. Lin, Y. W. Li and S. H. Xiao, Electrochim. Acta, 2017, 246, 322–328 CrossRef CAS.
- T. Yang, Q. Guan, Q. Li, L. Meng, L. Wang, C. Liu and K. Jiao, J. Mater. Chem. B, 2013, 1, 2926–2933 RSC.
- T. T. Chen, W. L. Song and L. Z. Fan, Electrochim. Acta, 2015, 165, 92–97 CrossRef CAS.
- V. H. Luan, H. N. Tien and T. H. Le, J. Mater. Chem. A, 2012, 1, 208–211 RSC.
- C. Jiang, Z. Tang, S. Deng, Y. Hong, S. Wang and Z. Zhang, RSC Adv., 2017, 7, 3746–3751 RSC.
- J. Zhang, B. Zhou and B. Zhao, Chin. J. Chem., 2017, 35, 1601–1610 CrossRef CAS.
- M. S. Poorali and M. M. Bagheri-Mohagheghi, J. Mater. Sci.: Mater. Electron., 2016, 27, 260–271 CrossRef CAS.
- N. Justh, B. Berke, K. László and I. M. Szilágyi, J. Therm. Anal. Calorim., 2017, 1–6 Search PubMed.
- Y. Liao, Y. Huang, D. Shu, Y. Zhong, J. Hao, C. He and X. Song, Electrochim. Acta, 2016, 194, 136–142 CrossRef CAS.
- H. Liu, J. Zhang, B. Zhang, L. Shi, S. Tan and L. Huang, Electrochim. Acta, 2014, 138, 69–78 CrossRef CAS.
- B. Zhang, T. Wang, S. Liu, S. Zhang, J. Qiu, Z. Chen and H. Cheng, Microporous Mesoporous Mater., 2006, 96, 79–83 CrossRef CAS.
- S. Fu, L. Ma and M. Gan, J. Mater. Sci.: Mater. Electron., 2016, 1–9 Search PubMed.
- R. S. Diggikar, D. J. Late and B. B. Kale, RSC Adv., 2014, 4, 22551–22560 RSC.
- H. Xue, T. Wang, H. Guo, X. Fan, Z. Zhu, X. Pan and J. He, RSC Adv., 2014, 4, 57724–57732 RSC.
- R. Du, X. Tian, J. Yao, Y. Sun, J. Jin, Y. Zhang and Y. Liu, Diamond Relat. Mater., 2016, 70, 186–193 CrossRef CAS.
- K. Zhu, Y. Zhang and H. Qiu, J. Alloys Compd., 2016, 675, 399–406 CrossRef CAS.
- W. Cheng, C. Ding and X. Nie, ACS Sustainable Chem. Eng., 2017, 5, 5503–5511 CrossRef CAS.
- M. M. Viana, M. C. Lima, J. C. Forsythe, V. S. Gangoli, M. Cho, Y. Cheng and V. Caliman, J. Braz. Chem. Soc., 2015, 26, 978–984 CAS.
- Y. Mao, S. Xiao and J. Liu, Mater. Res. Bull., 2017, 96, 437–442 CrossRef CAS.
- J. Chen, L. Yang, S. Fang, S. I. Hirano and K. Tachibana, J.ournal of Power Sources, 2012, 200, 59–66 CrossRef CAS.
- M. Vujković, I. Stojković, N. Cvjetićanin and S. Mentus, Electrochim. Acta, 2013, 92, 248–256 CrossRef.
- N. Li, J. Liang, D. Wei, Y. Zhu and Y. Qian, Electrochim. Acta, 2014, 123, 346–352 CrossRef CAS.
| This journal is © The Royal Society of Chemistry 2018 |

