 Open Access Article
Synthesis of a novel polyphosphate and its application with APP in flame retardant PLA†
Ting Liu ab,
Jian Jinga,
Yan Zhang
 *b and
Zhengping Fangab
aMOE Key Laboratory of Macromolecular Synthesis and Functionalization, Department of Polymer Science and Engineering, Zhejiang University, Hangzhou, 310027, China
bLab of Polymer Materials and Engineering, Ningbo Institute of Technology, Zhejiang University, Ningbo, 315100, China. E-mail: hnpdszy@163.com
First published on 24th January 2018
Abstract
To improve the flame resistance of PLA, a novel phosphorus-containing flame retardant (PFRS) was synthesized via the A2 + B3 type reaction of bisphenolic acid-based monomer (DPM, A2) and phosphorus oxychloride (POCl3, B3). Flame retardant PLA composite containing 15 wt% PFRS could achieve an LOI value of 24.3%, as well as a UL-94 V2 rating. Based on the structure of PFRS, here, intumescent flame retardant (IFR) systems were prepared by combining PFRS with ammonium polyphosphate (APP). The resultant PLA/PFRS/APP samples showed excellent fire-resistance properties such as self-extinguishing behavior and extremely low heat release rates. The LOI value of PLA composite with the addition of 3.8 wt% PFRS and 11.2 wt% APP could reach 29.7% and pass UL-94 V0 rating, and the PHRR value decreased by 46% compared to pure PLA. Investigation of the morphologies of the charred residues by Scanning Electron Microscopy (SEM) and Raman spectroscopy revealed the intrinsic charring ability of IFR systems to form a heat-protective intumescent-like barrier on the surface of PLA.
1. Introduction
For the past few years, biodegradable polymers have attracted widespread attention due to the lack of the petroleum resources and the increasing environmental consciousness.1,2 Polylactic acid (PLA), derived from starches and sugars, is regarded as one of the most promising polymer materials for the markets of packaging, textiles, coatings, biomedical devices, transportation, and electrical and electronic equipment.3–8 PLA has a high degree of transparency, good workability and mechanical properties.9–11 However, similar to petrochemical plastics, PLA suffers from its inherent inflammability on account of its molecular structure and chemical constitution.12 Specifically, PLA is susceptible to be ignited with negligible chars, has a relatively low limiting oxygen index (LOI) and high heat release rate (HRR), and is unable to meet the UL-94 V0 level.13 The high flammability of PLA limits its fields of application. Therefore, it is an urgent task to render PLA with flame-retardant properties.The approach of blending PLA resin with flame-retardant additives is regarded as the most effective way to prepare flame retardant PLA.14 Halogenated flame retardants are widely used for capturing free radicals and hence remove the capability of the flame propagation.15,16 However, halogenated additives tend to release a lot of smoke and toxic gases that are harmful to human health and environment.17,18 As we know, intumescent flame retardant (IFR) is considered as a promising halogen-free flame retardant due to its advantages of high efficiency, low toxicity, low smoke and no molten dropping during burning.19–23 However, traditional IFR additives exhibit low flame-retardant efficiency in PLA with only UL-94 V2 rating was achieved.24 In most cases, the hybrid IFR systems have improved flame-retardancy of polymer materials efficiently such as metal complexes/APP epoxy resins,25,26 hyperbranched char foaming agent/APP retarded PLA blends,27 and LDH/intumescent flame retarded PLA compounds.28 Chen29 et al. combined chitosan (CS) with APP to product flame-retardant PLA, and found that PLA composite containing 2% CS and 5% APP could reach LOI value of 33.1% and PHRR decrease to 425.6 kW m−2. Tang30 et al. reported that the co-addition of organo-modified sepiolite (OSEP) and IFR could significantly reduce the PHRR and THR values of PLA during combustion. All above mentioned ways have taken advantage of the synergistic effect among components to realize the development of high-effect green flame retardant systems.
Inspired by these works, a novel green polyphosphate flame retardant (PFRS) was synthesized by using diphenolic acid (DPA) as one of the raw materials. As is known, DPA is a potential platform chemical derived from biomass.31,32 Structure and properties of PFRS were well characterized by nuclear magnetic resonance (1H NMR, 13C NMR and 31P NMR), Fourier transform infrared (FTIR) and thermo gravimetric analysis (TGA). PFRS was deemed as acid source and carbon source in view of its unique structure. Therefore, IFR systems could be produced by combining PFRS with APP (acid source and gas source). The flame-retardant properties of PLA/PFRS and PLA/PFRS/APP systems were investigated in this study. Limiting oxygen index, vertical burning test, thermo gravimetric analysis and cone calorimetry tests were used to evaluate the thermostability and flame-retardant properties of various PLA composites. In addition, the morphology and structure of char residues were investigated by Scanning Electron Microscope (SEM) and Raman spectra. According to the data obtained, the flame retardant PLA composite was optimized and the mechanism was also clarified.
2. Experimental section
2.1. Materials used
DPA-based monomer (DPM) was synthesized in our laboratory according to references bibliography,33 yield: 55%. Ammonium polyphosphate (APP) with 32% phosphorus content and degree of polymerization (DP) > 1000 was obtained from Hangzhou JLS Flame Retardants Chemical Co., Ltd, China. PLA (Ingeo3052D, MFI = 10–25 g 10 min−1, density = 1.24 g cm−3) was supplied from Nature Works, American. Other materials were purchased from Sinopharm Chemical Reagent Co., Ltd, China. In particularly, phosphorus oxychloride (POCl3) was distilled over calcium hydride and triethylamine (TEA) was disposed by 4A molecular sieve over 48 h prior to use.2.2. Synthesis of polyphosphate flame retardant
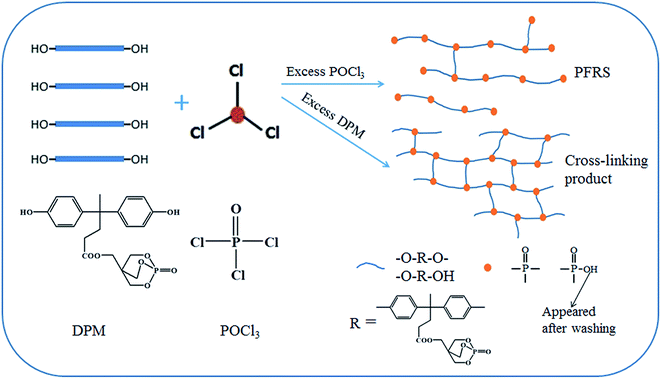
Polyphosphate flame retardant (PFRS) was synthesized via the condensation reaction between DPM and POCl3. Here, DPM is an A2 monomer (“A” represents hydroxyl group) and POCl3 is a B3 monomer (“B” stands for acyl chloride group) in this reaction which means PFRS was synthesized by using an A2 + B3 approach. In order to investigate the synthesis pathway of polyphosphate, a series of condensation reactions with different molar ratios of DPM to POCl3 were conducted in this work.A mixture of 15.0 g DPM and 130 mL acetonitrile was added into a 250 mL completely-dried three-necked round bottom flask equipped with mechanical stirrer, reflux condenser and nitrogen inlet. The equipment was then cooled to 0 °C by an external ice-salt bath. When the reactants were dissolved completely, X mL (X = 3.68, 3.06, 2.14, 1.53, 0.92) POCl3 in 20 mL acetonitrile was added drop wise for about 1 h at 0–5 °C with constant stirring speed. In order to accelerate this acylation reaction, 9.3 mL TEA was added into the flask as absorb acid agent at intervals of an hour for three times. After that, the temperature was raised to 50 °C and continued for 2 h. Finally, the reaction kept for another 6 h under the temperature of 80 °C. After reaction finished, products in solution and precipitate were collected respectively at room temperature.
As for the products in solution, the solvent was evaporated by rotary evaporation at reduced pressure and the residue after evaporation was washed with hot deionized water for three times. These obtained solids were dried at 80 °C by a vacuum oven for 12 h.
As for the precipitate, the yield of precipitate appeared to change along with the mixture proportion of POCl3, which was analyzed with the method of Soxhlet extraction. According to the Soxhlet's procedure,34 the precipitate samples were dried in a vacuum oven at 80 °C for 12 h, then grounded into small particles and placed in a porous bag-type filter paper. Thereafter, the filter paper was placed in an extraction chamber, which was suspended above a flask containing the solvent acetonitrile. Then, a condenser was arranged on the extraction chamber. Finally, the equipment was heated to the reflux temperature and acetonitrile evaporated and moved up into the condenser, where it was converted into a liquid that trickled into the extraction chamber which loading with specimens. Extraction was continued for 12 h under this condition. After extraction, the residues were collected, dried completely and recorded the weight, these insoluble matters were identified as cross-linking products.
2.3. Fabrication of flame-retardant PLA composites
PLA pellets were dried in a vacuum oven at 90 °C for 12 h to remove any moisture content. Thereafter, all desired flame retardant PLA composites were prepared in a melt mixer (Thermo Haake Rheomixer, Polylab, Germany) at 170 °C with a rotor speed of 60 rpm for 8 min. Finally, the blends were preheated in a mold at 170 °C for 5 min, followed by hot-press at 20 MPa for 2 min, and then transferred to cold-press at 25 °C for 3 min. These obtained sheets were used for later analyses and tests. In our study, 15 wt% intumescent flame retardant (consisting of APP and PFRS) were added into PLA matrix and the synergistic flame-retardant effect of PFRS/APP in PLA was studied. In addition, neat PLA, PLA/PFRS and PLA/APP with 15 wt% loadings were prepared by the same process for comparison. The formulations of flame retardant PLA studied in this work are shown in Table 1.| Sample | Composition (wt%) | ||
|---|---|---|---|
| PLA | PFRS | APP | |
| PLA | 100 | 0 | 0 |
| PLA/15PFRS | 85 | 15 | 0 |
| PLA/7.5PFRS/7.5APP | 85 | 7.5 | 7.5 |
| PLA/5PFRS/10APP | 85 | 5 | 10 |
| PLA/3.8PFRS/11.2APP | 85 | 3.8 | 11.2 |
| PLA/3PFRS/12APP | 85 | 3 | 12 |
| PLA/15APP | 85 | 0 | 15 |
2.4. Instruments and characterizations
1H NMR, 13C NMR and 31P NMR measurements were carried on a Varian Unity Inova spectrometer (Advance 2B, Bruker, Germany) which was operated at 500 MHz, using DMSO-d6 as the solvent. The Fourier transform infrared (FTIR) spectra were collected with a FTIR spectrometer (Vector-22, Bruker, Germany) using KBr pellets. Thermal gravimetric analyses (TGA) were taken by thermo gravimetric analyzer (209 F1, Netzsch, Germany) in a nitrogen atmosphere at a heating rate of 20 °C min−1 within temperature range 50 °C to 900 °C. Limiting oxygen index (LOI) values were tested on an Oxygen Index Detector (HC-2, Jiangning Analysis Instrument Company, China) according to ASTM D2863, with the specimen dimension of 150 mm × 6 mm × 3 mm. The vertical flame tests were performed on a Horizontal and Vertical Burning Tester (CZF-III, Jiangning Analysis Instrument Company, China), and the UL 94 classification was determined by applying ASTM D3801 standard to sheets of 127 mm × 12.7 mm × 3 mm. The cone calorimetry tests were conducted according to ISO 5660 standard using a FTT Cone Calorimeter with the dimension 100 mm × 100 mm × 3 mm of square specimens irradiated at a heat flux of 35 kW m−2. Scanning Electron Microscopy (SEM) images were obtained with a scanning electron microscope (S-4800, Hitachi, Japan) at an accelerating voltage of 3 kV. Raman spectroscopy was handled on an Invia Raman spectrophotometer (59T087, Renishaw, UK) with argon ion laser having excitation wavelength of 514 nm. Thermal gravimetric analyses coupled to Fourier transform infrared spectroscopy (TGA-FTIR) measurements were performed with a thermo gravimetric analyzer (209 F1, Netzsch, Germany) coupling with a FTIR spectroscopy (Thermo Nicolet iS10, Thermosher, Germany). The volatiles evolved from TG could be transport to the gas cell of FTIR through a transfer pipe by the suitable gas flow. The test procedure for TGA was 20 °C min−1 from 25 °C to 800 °C under N2 atmosphere.3. Results and discussion
3.1. Synthesis and characterization of PFRS
In this A2 + B3 reaction, DPM derived from DPA has been studied and considered as excellent intermediate A2 compound to fabricate organophosphorus flame retardants in our laboratory,33,35 which is due to its structure containing bihydroxy. Besides that, DPM also has a caged bicyclic phosphate (PEPA) in its molecular. In order to make more functional structure in one molecular and then achieve better flame retardancy, we used POCl3 as a B3 compound to react with DPM on the basis of polycondensation mechanism.It is interested to find that the structure of products appeared to change along with the mixture proportion of reactant POCl3. In order to investigate the synthesis mechanism, a series of reactions with different DPM/POCl3 molar ratios were carried out. It can be found that the products would be precipitated off in the case of an excess addition of DPM such as nDPM![[thin space (1/6-em)]](https://www.rsc.org/images/entities/char_2009.gif) :
:![[thin space (1/6-em)]](https://www.rsc.org/images/entities/char_2009.gif) nPOCl3 = 1
nPOCl3 = 1![[thin space (1/6-em)]](https://www.rsc.org/images/entities/char_2009.gif) :
:![[thin space (1/6-em)]](https://www.rsc.org/images/entities/char_2009.gif) 0.7. Conversely, when the addition of DPM was not excessive such as nDPM
0.7. Conversely, when the addition of DPM was not excessive such as nDPM![[thin space (1/6-em)]](https://www.rsc.org/images/entities/char_2009.gif) :
:![[thin space (1/6-em)]](https://www.rsc.org/images/entities/char_2009.gif) nPOCl3 = 1
nPOCl3 = 1![[thin space (1/6-em)]](https://www.rsc.org/images/entities/char_2009.gif) :
:![[thin space (1/6-em)]](https://www.rsc.org/images/entities/char_2009.gif) 1.2 and 1
1.2 and 1![[thin space (1/6-em)]](https://www.rsc.org/images/entities/char_2009.gif) :
:![[thin space (1/6-em)]](https://www.rsc.org/images/entities/char_2009.gif) 1, the reaction products mainly existed in solution. FTIR spectrum was used to analyse these products and the representative results were presented in Fig. 1. It was obvious that the absorption peak of –OH bond shifted to lower wave numbers with the increase addition of POCl3, which was due to the growing number of red-shift hydrogen bonds.36 Furthermore, the relative absorption intensity of the peak at 1289 cm−1 (–P
1, the reaction products mainly existed in solution. FTIR spectrum was used to analyse these products and the representative results were presented in Fig. 1. It was obvious that the absorption peak of –OH bond shifted to lower wave numbers with the increase addition of POCl3, which was due to the growing number of red-shift hydrogen bonds.36 Furthermore, the relative absorption intensity of the peak at 1289 cm−1 (–P![[double bond, length as m-dash]](https://www.rsc.org/images/entities/char_e001.gif) O) was enhanced along with increasing addition of POCl3, it was due to the increased content of POCl3 units.
O) was enhanced along with increasing addition of POCl3, it was due to the increased content of POCl3 units.
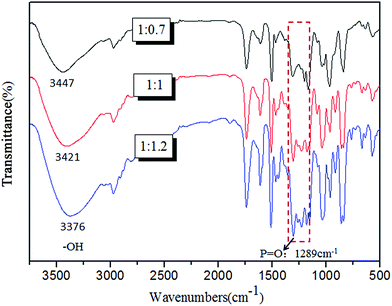 | ||
Fig. 1 FTIR spectra of the precipitate products with nDPM![[thin space (1/6-em)]](https://www.rsc.org/images/entities/char_2009.gif) : :![[thin space (1/6-em)]](https://www.rsc.org/images/entities/char_2009.gif) nPOCl3 = 1 nPOCl3 = 1![[thin space (1/6-em)]](https://www.rsc.org/images/entities/char_2009.gif) : :![[thin space (1/6-em)]](https://www.rsc.org/images/entities/char_2009.gif) 0.7 and the solution products with nDPM 0.7 and the solution products with nDPM![[thin space (1/6-em)]](https://www.rsc.org/images/entities/char_2009.gif) : :![[thin space (1/6-em)]](https://www.rsc.org/images/entities/char_2009.gif) nPOCl3 = 1 nPOCl3 = 1![[thin space (1/6-em)]](https://www.rsc.org/images/entities/char_2009.gif) : :![[thin space (1/6-em)]](https://www.rsc.org/images/entities/char_2009.gif) 1, 1 1, 1![[thin space (1/6-em)]](https://www.rsc.org/images/entities/char_2009.gif) : :![[thin space (1/6-em)]](https://www.rsc.org/images/entities/char_2009.gif) 1.2. 1.2. | ||
When the addition of POCl3 was excessive, phosphate groups become the main end groups. Such structures could bring out products good solubility. Accordingly, the proportion of the insoluble matters was usually characterized by their degree of cross-linking (DC), which was determined here by using equation as follows:
| DC = C/(B + C) × 100% |
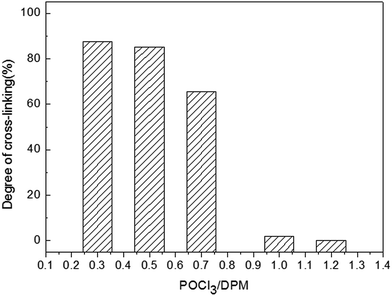
B and C referred to the weight of soluble and cross-linking products in this reaction. Experimentally, DC was determined by Soxhlet's procedure as mentioned in part 2.2, and the results were presented in Fig. 2. The values of DC for the reaction were found to be smaller with increasing addition of POCl3, which was agreed with the FTIR spectra. On basis of the above results, it can be demonstrated that the synthesis pathway of this reaction as is shown in Scheme 1.
However, the cross-linking product was poor in processing performance due to the insolubility and infusibility. In consideration of the compatibility with PLA, only PFRS synthesized under reactants molar ratios DPM![[thin space (1/6-em)]](https://www.rsc.org/images/entities/char_2009.gif) :
:![[thin space (1/6-em)]](https://www.rsc.org/images/entities/char_2009.gif) POCl3 = 1
POCl3 = 1![[thin space (1/6-em)]](https://www.rsc.org/images/entities/char_2009.gif) :
:![[thin space (1/6-em)]](https://www.rsc.org/images/entities/char_2009.gif) 1 was studied in this work.
1 was studied in this work.
3.2. The detailed characterization of PFRS
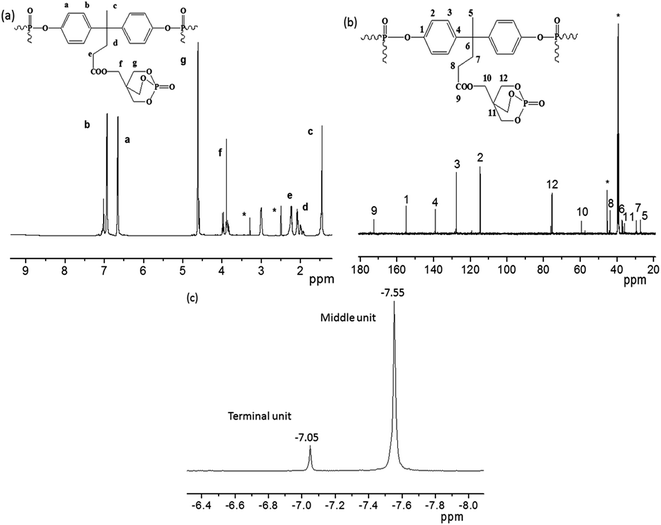
1H NMR spectrum of PFRS in Fig. 3(a) reveals that no peaks appeared at 9.21 ppm (hydroxyl group in DPM), which demonstrates that the bonds between DPM and POCl3 were successfully formed during the production of PFRS. There were two peaks at δ = 6.66 ppm (Ha) and δ = 6.96 ppm (Hb), which were ascribed to the protons of phenyl groups. The peaks at 2.23 ppm (Hc), 1.46 ppm (Hd) and 2.07 ppm (He) may be due to the hydrogen atoms present in methyl and methylene groups of DPM subunit, respectively. Furthermore, the peaks for the chemical shifts of methylene protons in PEPA moiety appeared at δ = 3.89 ppm (Hf) and δ = 4.63 ppm (Hg).The 13C NMR spectrum further supports the structure of PFRS as shown in Fig. 3(b). The peaks observed at 155.0 (C1), 114.7 (C2), 127.7 (C3), 139.1 (C4), 27.3 (C5), 36.9 (C6), 29.4 (C7), 43.7 (C8) ppm were assigned to the carbon atoms in the DPA subunit. The peak at δ = 172.7 ppm may be due to the carbon of ester carbonyl (C9). The peaks at 59.4 (C10), 36.0 (C11) and 75.5 (C12) ppm were attributed to the carbon atoms in caged PEPA subunit. See from Fig. 3(c), the higher peak at −7.55 ppm could be assigned to the phosphorus atoms in middle units and the lower peak at −7.05 ppm was correspond with the terminal group phosphorus atoms.
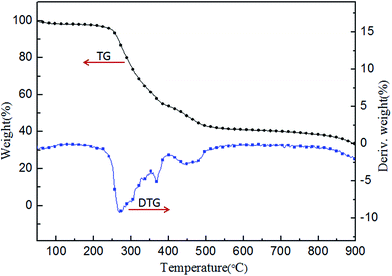
The TG and DTG curves of PFRS in nitrogen atmosphere are presented in Fig. 4. PFRS exhibited a three-steps decomposition in the temperature ranges of 50–180 °C, 250–400 °C, and 400–900 °C in accordance with water and small molecules like phosphoric falling off, the further carbonization and the thermal degradation of char residue, respectively.37 Besides, the residue of PFRS at 600, 700 and 800 °C was 42.1%, 41.0%, and 39.3%, respectively. It suggested the potential charring ability of PFRS.
3.3. Flammability of PLA composites
The LOI values and the vertical burning test (UL-94) results of various samples are shown in Table 2. Pure PLA was inflammable with a LOI value of 20.0% and no rating in UL-94 test. The LOI values of PLA with 15 wt% PFRS or 15 wt% APP increased to 24.3% and 26.0%, respectively, but could only attain UL-94 V2 rating. However, with the combination of APP and PFRS, all the PLA/PFRS/APP samples exhibited higher LOI values and UL-94 rating level (V0), compared with PLA/15PFRS and PLA/15APP. Especially for PLA/3.8PFRS/11.2APP, it had the highest LOI value of 29.7% among all the PLA systems. From the vertical burning test results, PLA/3.8PFRS/11.2APP composites could self-extinguish within 10 s and prevented flame propagation to a great extent.| Sample | LOI (%) | UL-94 rating | t1a (s) | t2b (s) | Dripping | Igniting cotton |
|---|---|---|---|---|---|---|
| a t1: the burning time after first ignition.b t2: the burning time after second ignition. | ||||||
| PLA | 20.0 | Failed | — | — | Yes | Yes |
| PLA/15PFRS | 24.3 | V2 | 10 | 9 | Yes | Yes |
| PLA/7.5PFRS/7.5APP | 28.3 | V0 | 1 | 3 | Yes | No |
| PLA/5PFRS/10APP | 28.8 | V0 | 1 | 1 | Yes | No |
| PLA/3.8PFRS/11.2APP | 29.7 | V0 | 0 | 1 | Yes | No |
| PLA/3PFRS/12APP | 28.6 | V0 | 0 | 1 | Yes | No |
| PLA/15APP | 26.0 | V2 | 13 | 5 | Yes | Yes |
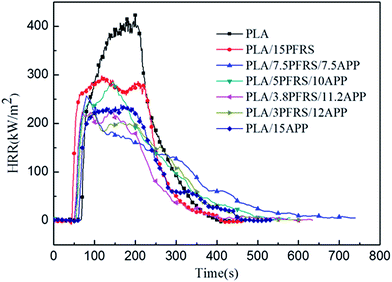
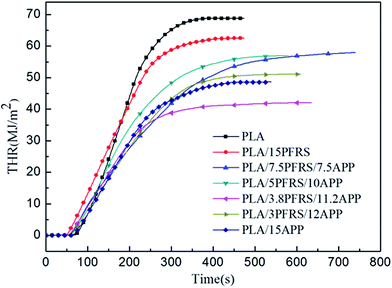
Cone calorimetry had been employed to investigate the dynamic combustion behaviors of PLA and PLA composites, which could provide various parameters such as time to ignition (TTI), peak heat release rate (PHRR), total heat release (THR) and residue mass (RM). HRR and THR curves of various PLA samples are illustrated in Fig. 5 and 6, and more detailed information from cone calorimetric test are listed in Table 3.
| Sample | TTI (s) | PHRR (kW m−2) | THR (MJ m−2) | RM (%) | FIGRA (kW m−2 s−1) |
|---|---|---|---|---|---|
| PLA | 68 ± 1 | 419 ± 3 | 70.3 ± 0.1 | 1.6 ± 0.2 | 2.2 |
| PLA/15PFRS | 52 ± 0 | 362 ± 13 | 61.5 ± 0.9 | 6.2 ± 0.7 | 2.2 |
| PLA/7.5PFRS/7.5APP | 54 ± 1 | 257 ± 6 | 57.9 ± 3.4 | 11.5 ± 1.7 | 2.1 |
| PLA/5PFRS/10APP | 56 ± 0 | 287 ± 8 | 57.0 ± 0.7 | 10.2 ± 0.5 | 1.7 |
| PLA/3.8PFRS/11.2APP | 54 ± 2 | 227 ± 3 | 41.9 ± 0 | 22.6 ± 0 | 1.4 |
| PLA/3PFRS/12APP | 57 ± 0 | 232 ± 5 | 52.0 ± 0.5 | 13.5 ± 0 | 1.5 |
| PLA/15APP | 62 ± 0 | 239 ± 3 | 48.5 ± 0.5 | 19.4 ± 0.6 | 1.6 |
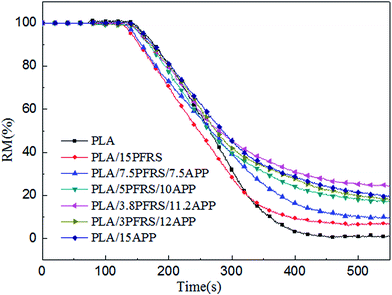
With the incorporation of 15 wt% PFRS into PLA, the TTI was shortened to 52 seconds. It was because of the early degradation of PFRS to produce phosphate which could promote a heat-protective char layer on the surface of PLA. Seen from Fig. 5 and 6, PHRR of neat PLA appeared at 419 kW m−2 and THR was 70.3 MJ m−2. When 15 wt% PFRS was added, the PHRR of PLA reduced to 316.6 kW m−2 and THR decreased to 61.5 MJ m−2. And then different proportions of APP and PFRS were added into the system, it is found that PLA systems have achieved further declines of PHRR and THR. The PHRR of PLA/3.8PFRS/11.2APP has decreased by 46% and 40% compared with that of neat PLA, respectively. In addition, the mass loss curves of PLA and PLA blends are displayed in Fig. 7. The combination of PFRS and APP could increase the residue weight of PLA with varying degrees. Among PLA/PFRS/APP samples, PLA/3.8PFRS/11.2APP presented the maximum final residue of 22.6 wt% while that of PLA/15PFRS and PLA/15APP was 6.2 wt% and 19.4 wt%, respectively. The improvement of the residue weight may be the important factor for its excellent flame-retardant properties.
In addition, the Fire Growth Rate (FIGRA) index was proposed to estimate the fire hazard of PLA blends more clearly. FIGRA was calculated by the ratio of PHRR and the time at peak heat release occurs, which became a heat acceleration parameter to judge both the scale of a fire and the predicted fire spread rate in reality. The higher the FIGRA value is, the quicker the fire spreads and propagates.38–40 PLA/3.8PFRS/11.2APP sample had a minimum FIGRA value of 1.4 kW m−2 s−1, which was lower than that of PLA/15PFRS and PLA/15APP. It indicated that PLA/3.8PFRS/11.2APP had a relative slower speed of fire propagation.
All above change trends were similar to the results of LOI and vertical burning test. So it was concluded that there existed a most appropriate PFRS/APP weight ratio (3.8/11.2) of intumescent flame retardant PLA systems, which had the best fire-resistant properties with the suitable proportion of acid source, carbon source and gas source. When adding 15 wt% PFRS or APP into PLA matrix alone, the flame retardancy of the system was unsatisfactory due to the absence of gas source or carbon source.
3.4. Characterization of char residue
Fig. 8 exhibits the digital photographs of char residues of PLA and flame-retardancy PLA composites after cone tests. Obviously, neat PLA was almost combusted completely and remained negligible char. When adding PFRS into PLA, the weight of residue had a modest increase and the char layer was visibly thin and weak. Seen from the cone tests data, a further increased amount of final residue was left for PLA/PFRS/APP composites such as PLA/7.5PFRS/7.5APP and PLA/3.8PFRS/11.2APP composites. However, PLA/7.5PFRS/7.5APP composite leaded an unexpanded and collapsed char layer, possibly due to its insufficient blowing agent. Among all the samples, PLA/3.8PFRS/11.2APP composite engendered a most considerable and coherent intumescent char residue as shown in Fig. 8(e) and (f). Generally, the intumescent char residue could slow the heat and mass transmission between condensed and gas phases and prevent the underlying materials from further combustion.41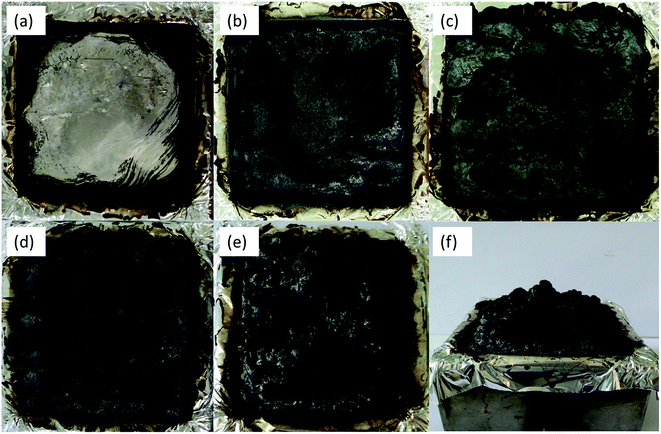 | ||
| Fig. 8 Digital photos of the residues after cone test for (a) PLA, (b) PLA/15PFRS, (c) PLA/15APP, (d) PLA/7.5PFRS/7.5APP and (e and f) PLA/3.8PFRS/11.2APP. | ||
Raman spectroscopy is a significant approach to characterize carbonaceous materials. The structure of char residue was presented by Raman spectra in Fig. 9. We can see two remarkable peaks at 1350 and 1580 cm−1, regarding as D and G peaks. The ratio of the relevant intensity of D to G peak (ID/IG) was used for assessing the graphitization degree of char residue. A lower ratio of ID/IG indicates the higher graphitization degree and thermal stability of char structure.42 For PPA/15PFRS, the ID/IG value was about 0.91. The incorporation of APP had a noteworthy impact on the intensity ratio ID/IG such as the ID/IG values of PLA/7.5PFRS/7.5APP and PLA/3.8PFRS/11.2APP reduced from 0.91 to 0.76 and 0.71, respectively, which were higher than that of PLA/15APP (0.85). This further implied that a higher graphitized carbons in the char layer of PLA/3.8PFRS/11.2APP composite, which was able to hinder the transfer of volatile and heat flux during the PLA combustion.
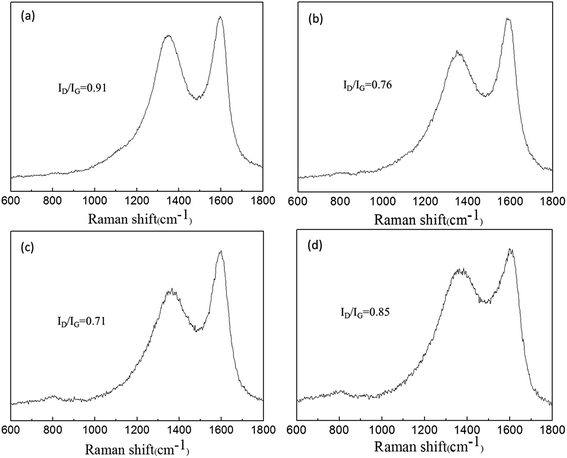 | ||
| Fig. 9 Raman spectra of the char residues of (a) PLA/15PFRS, (b) PLA/7.5PFRS/7.5APP, (c) PLA/3.8PFRS/11.2APP and (d) PLA/15APP. | ||
Scanning Electron Microscopy (SEM) was further applied to investigate the morphologies of the char residues after cone calorimeter tests, as shown in Fig. 10. Obviously, PLA/15PFRS had a poor char layer with many large holes and cracks. However, a distinct improvement on the quality of char layer for PLA/PFRS/APP composites was achieved. It could be seen that the holes and cracks became remarkably shrunken on the surface of the char residue of PLA/3.8PFRS/11.2APP composite and the char layer became more smooth and coherent. Moreover, many folds could be found in the char structure of PLA/3.8PFRS/11.2APP, which might be the intumescent bubbles broke during the burning because of the inner pressure of char residue. These coherent and intumescent features together rendered the charred residue with excellent barrier against the transmission of heat and volatiles, which was in agreement with the results of Raman spectra.
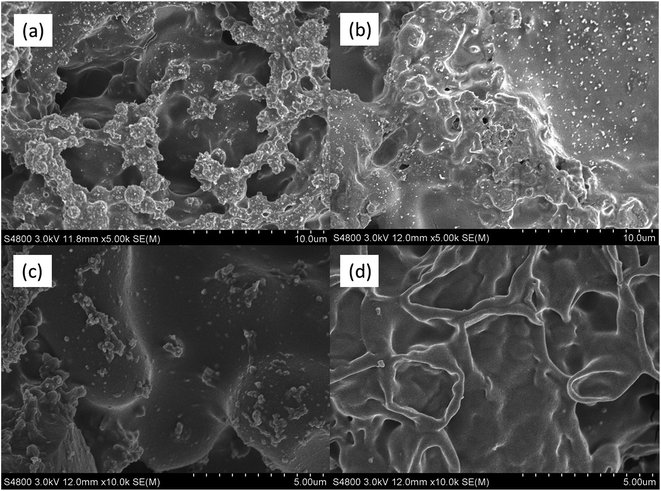 | ||
| Fig. 10 SEM micrographs of the residues after cone calorimeter test for PLA/15PFRS (a and c) and PLA/3.8PFRS/11.2APP (b and d). | ||
The above analysis of flammability and char residue revealed that the combination of 3.8 wt% PFRS and 11.2 wt% APP constituted an effective IFR system and hence facilitated the formation of a compact char layer. This compact char layer was helpful for condensed phase mechanism to play its role.
3.5. Thermal decomposition of PLA composites
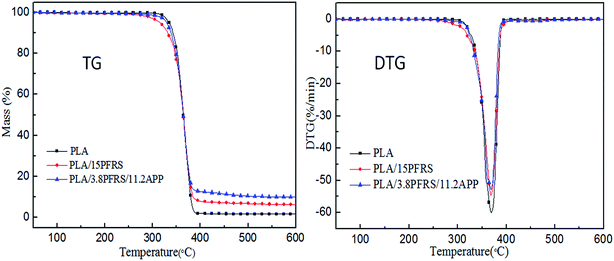
Thermal stability of various PLA composites under nitrogen atmosphere was studied by TGA, as shown in Table 4 and Fig. 11. The temperature at 5 wt% weight loss was assigned as Tonset and the maximum decomposition temperature was denoted as Tmax. The maximum weight loss rate referred to the maximum rate of decomposition, which was the peek value of Y-axis in the DTG curves. As for virgin PLA, it started to decompose at 334.4 °C and Tmax appeared at 369.4 °C. Tonsets of the PLA/15PFRS and PLA/3.8PFRS/11.2APP were a bit earlier than neat PLA, which would be attributed to the earlier pyrolysis of flame retardants to generate matters such as phosphoric acid as discussed in part 3.2. No visible variation of Tmax was observed for PLA composites, which means the addition of flame retardants changed the thermal decomposition behaviour of PLA in a minor way.13 The residue weight of PLA composites was evaluated by experimental and theoretical values. Pure PLA has the residue weight of 1.66% at 600 °C. It was interesting to find that the experimental residue weight of PLA/15PFRS was lower than the theoretical value. Conversely, the experimental residue weight of PLA/3.8PFRS/11.2APP was 9.9 wt%, which was higher than the theoretical value (5.4 wt%). It indicated that most pyrolysis products of PFRS evaporated into gas phase instead of remaining in solid phase to participate in char-forming. However, PFRS/APP flame-retardant systems could decompose to catalyze the char production of PLA composites in solid phase like most condensed-phase active flame retardants. This corresponded with the results of cone calorimeter tests. Besides, the maximum weight loss rate was a useful way to evaluate the thermal stability. PLA with the addition of 3.8 wt% PFRS and 11.2 wt% APP displayed the lowest weight loss rate of 52.9%/min, indicating its slowest degradation of PLA matrix.37| Sample | Tonset (°C) | Tmax (°C) | Residue weight at 600 °C (wt%) | The maximum weight loss rate (%/min) | |
|---|---|---|---|---|---|
| Experimental | Theoretical | ||||
| PLA | 334.3 | 369.4 | 1.6 | 0 | 60.0 |
| PLA/15PFRS | 315.7 | 368.7 | 6.1 | 7.4 | 54.7 |
| PLA/3.8PFRS/11.2APP | 329.3 | 368.4 | 9.9 | 5.4 | 52.9 |
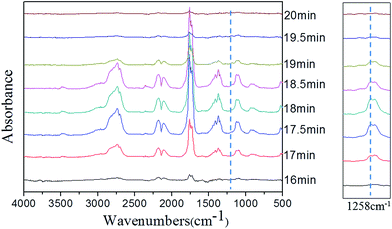
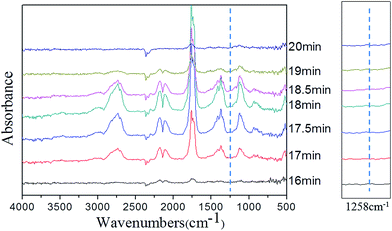
In order to clarify the gas-phase actions of PFRS and PFRS/APP systems, TG-FTIR was employed to study the evolved gas products of PLA and its composites during thermal degradation in N2. Fig. 12(a) presented the FTIR spectra of gas products at Tmax. It was obvious that the main degradation products for flame-retardant PLA were not altered compared with those of pure PLA. However, there was a significant delay and decrease of the peak appeared at 3002 cm−1 (C–H stretching) for flame-retardant PLA, as shown in Fig. 12(b). Pure PLA decomposed to release many hydrocarbons into gas phase from 15 min to 19 min, while the absorbance of hydrocarbons for flame-retardant PLA had a distinct decrease and delayed until 16 min. It implied that flame retardants could slow down the PLA degradation, and more hydrocarbons left in solid phase to form charring residues. Fig. 13 and 14 exhibited the TG-FTIR spectra of flame-retardant PLA during the timeframe of thermal degradation. Clearly, PLA/15PFRS could generate the P![[double bond, length as m-dash]](https://www.rsc.org/images/entities/char_e001.gif) O (1258 cm−1) volatiles from 17 min to 19 min, which were deemed as free radical scavengers and had excellent quenching effect for flame-inhibition in gas phase.43,44 However, there were no peaks at 1258 cm−1 of PLA/3.8PFRS/11.2APP during the degradation process, indicating the presence of phosphorus-containing fragments were left in solid phase to catalyze the char production of PLA as discussed in thermal gravimetric analyses. Furthermore, this char residue prevented hydrocarbons entering into gas phase and hence there was a sharp drop of the absorbance in Fig. 12(b). All above came to a conclusion that the flame retardant mechanism of PFRS was depending on the simultaneous actions in gas phase and condensed phase, while PFRS/APP system was mainly related to condensed-phase mechanism.
O (1258 cm−1) volatiles from 17 min to 19 min, which were deemed as free radical scavengers and had excellent quenching effect for flame-inhibition in gas phase.43,44 However, there were no peaks at 1258 cm−1 of PLA/3.8PFRS/11.2APP during the degradation process, indicating the presence of phosphorus-containing fragments were left in solid phase to catalyze the char production of PLA as discussed in thermal gravimetric analyses. Furthermore, this char residue prevented hydrocarbons entering into gas phase and hence there was a sharp drop of the absorbance in Fig. 12(b). All above came to a conclusion that the flame retardant mechanism of PFRS was depending on the simultaneous actions in gas phase and condensed phase, while PFRS/APP system was mainly related to condensed-phase mechanism.
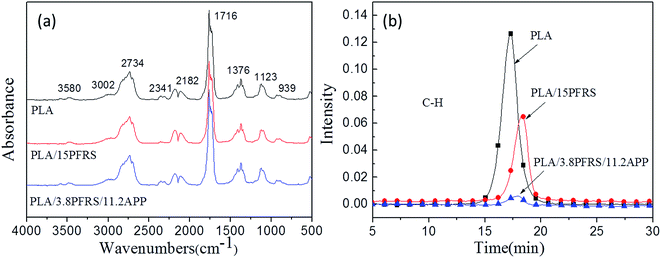 | ||
| Fig. 12 (a) FTIR spectra of gas products at Tmax and (b) absorbance of hydrocarbons for PLA and its composites. | ||
4. Conclusions
In this study, a novel phosphorus-containing flame retardant (PFRS) was successfully synthesized via the reaction of A2 monomer DPM and B3 monomer POCl3. The synthesis was well investigated by different spectroscopic and analytical techniques. Then, PFRS was combined with APP to form intumescent flame retardant PLA systems. The thermal stability and flame-retardant properties were studied by TGA, LOI, UL-94 and cone calorimeter tests, and the results showed that PFRS/APP systems could be effective to improve the final residue weight and flame-retardant properties of PLA. PLA with the loading of 3.8 wt% PFRS and 11.2 wt% APP achieved the best flame-retardant properties. Moreover, the investigation of the structure and morphology of char residue by SEM and Raman spectroscopy indicated that PLA/3.8PFRS/11.2APP formed a compact, coherent char residue during combustion, which was an excellent barrier against the transmission of heat and volatiles. Besides, the data of evolved gaseous pyrolysis products proved that the flame retardant mechanism of PFRS was a cooperation of gas-phase and condensed-phase mechanism, while PFRS/APP system mainly relied on the condensed-phase mechanism.Conflicts of interest
There are no conflicts to declare.Acknowledgements
This work was supported by the National Natural Science Foundation of China (grant number 51628302), the Ningbo Science and Technology Innovation Team (grant number 2015B11005) and the Natural Science Foundation of Ningbo (grant number 2016A610209).References
- X. Wen, J. Gong, H. O. Yu, Z. Liu, D. Wan, J. Liu, Z. W. Jiang and T. Tang, J. Mater. Chem., 2012, 22, 19974–19980 RSC.
- S. M. Li, J. Ren, H. Yuan, T. Yu and W. Z. Yuan, Polym. Int., 2010, 59, 242–248 CrossRef CAS.
- D. Garlotta, J. Polym. Environ., 2001, 9, 63–84 CrossRef CAS.
- M. Jamshidian, E. A. Tehrany, M. Imran, M. Jacquot and S. Desobry, Compr. Rev. Food Sci. Food Saf., 2010, 9, 552–571 CrossRef CAS.
- K. Tao, J. Li, L. Xu, X. L. Zhao, L. X. Xue, X. Y. Fan and Q. Yan, Polym. Degrad. Stab., 2011, 96, 1248–1254 CrossRef CAS.
- M. Shabanian, N. J. Kang, D. Y. Wang, U. Wagenknecht and G. Heinrich, Polym. Degrad. Stab., 2013, 98, 1036–1042 CrossRef CAS.
- M. Murariu, L. Bonnaud, P. Yoann, G. Fontaine, S. Bourbigot and P. Dubois, Polym. Degrad. Stab., 2010, 95, 374–381 CrossRef CAS.
- F. H. Liao, L. Zhou, Y. Q. Ju, Y. Y. Yang and X. L. Wang, Ind. Eng. Chem. Res., 2014, 53, 10015–10023 CrossRef CAS.
- R. Auras, B. Harte and S. Selke, Macromol. Biosci., 2004, 4, 835–864 CrossRef CAS PubMed.
- B. Gupta, N. Revagade and J. Hilborn, Prog. Polym. Sci., 2007, 32, 455–482 CrossRef CAS.
- E. T. H. Vink, K. R. Rabago, D. A. Glassner, B. Springs, R. P. O'Connor, J. Kolstad and P. R. Gruber, Macromol. Biosci., 2004, 4, 551–564 CrossRef CAS PubMed.
- X. Y. Shan, L. Song, W. Y. Xing, Y. Hu and S. M. Lo, Ind. Eng. Chem. Res., 2012, 51, 13037–13045 CrossRef CAS.
- S. Bourbigot and G. Fontaine, Polym. Chem., 2010, 1, 1413–1422 RSC.
- Y. P. Song, D. Y. Wang, X. L. Wang, L. Lin and Y. Z. Wang, Polym. Adv. Technol., 2011, 22, 2295–2301 CrossRef CAS.
- M. Alaee, P. Arias, A. Sjodin and A. Bergman, Environ. Int., 2003, 29, 683–689 CrossRef CAS PubMed.
- V. M. Fonseca, V. J. Fernandes, A. S. Araujo, L. H. Carvalho and A. G. Souza, J. Therm. Anal. Calorim., 2005, 79, 429–433 CrossRef CAS.
- Q. L. Tai, R. K. K. Yuen, W. Yang, Z. H. Qiao, L. Song and Y. Hu, Composites, Part A, 2012, 43, 415–422 CrossRef CAS.
- T. Kashiwagi, F. M. Du, J. F. Douglas, K. I. Winey, R. H. Harris and J. R. Shields, Nat. Mater., 2005, 4, 928–933 CrossRef CAS PubMed.
- B. Li and M. J. Xu, Polym. Degrad. Stab., 2006, 91, 1380–1386 CrossRef CAS.
- M. Gao and S. S. Yang, J. Appl. Polym. Sci., 2010, 115, 2346–2351 CrossRef CAS.
- S. B. Nie, L. Song, Y. Q. Guo, K. Wu, W. Y. Xing, H. D. Lu and Y. Hu, Ind. Eng. Chem. Res., 2009, 48, 10751–10758 CrossRef CAS.
- H. Y. Ma, L. F. Tong, Z. B. Xu, Z. P. Fang, Y. M. Jin and F. Z. Lu, Polym. Degrad. Stab., 2007, 92, 720–726 CrossRef CAS.
- H. Y. Ma, L. F. Tong, Z. B. Xu and Z. P. Fang, Appl. Clay Sci., 2008, 42, 238–245 CrossRef CAS.
- S. Bourbigot, S. Duquesne, G. Fontaine, S. Bellayer, T. Turf and F. Samyn, Mol. Cryst. Liq. Cryst., 2008, 486, 1367–1381 Search PubMed.
- J. S. Wang, Y. Liu, H. B. Zhao, J. Liu, D. Y. Wang, Y. P. Song and Y. Z. Wang, Polym. Degrad. Stab., 2009, 94, 625–631 CrossRef CAS.
- D. Y. Wang, Y. Liu, X. G. Ge, Y. Z. Wang, A. Stec, B. Biswas, T. R. Hull and D. Price, Polym. Degrad. Stab., 2008, 93, 1024–1030 CrossRef CAS.
- C. H. Ke, J. Li, K. Y. Fang, Q. L. Zhu, J. Zhu, Q. Yan and Y. Z. Wang, Polym. Degrad. Stab., 2010, 95, 763–770 CrossRef CAS.
- D. Y. Wang, A. Leuteritz, Y. Z. Wang, U. Wagenknecht and G. Heinrich, Polym. Degrad. Stab., 2010, 95, 2474–2480 CrossRef CAS.
- C. Chen, X. Y. Gu, X. D. Jin, J. Sun and S. Zhang, Carbohydr. Polym., 2017, 157, 1586–1593 CrossRef CAS PubMed.
- G. Tang, D. Deng, J. Chen, K. Q. Zhou, H. Zhang, X. J. Huang and Z. J. Zhou, J. Therm. Anal. Calorim., 2017, 130, 763–772 CrossRef CAS.
- P. Zhang, L. B. Wu, Z. Y. Bu and B. G. Li, J. Appl. Polym. Sci., 2008, 108, 3586–3592 CrossRef CAS.
- Y. Liu, Y. Zhang and Z. P. Fang, Bioresources, 2012, 7, 4914–4925 Search PubMed.
- J. Jing, Y. Zhang, X. L. Tang and Z. P. Fang, RSC Adv., 2016, 6, 49019–49027 RSC.
- W. B. Jensen, J. Chem. Educ., 2007, 84, 1913–1914 CrossRef CAS.
- J. Jing, Y. Zhang and Z. P. Fang, Polymer, 2017, 108, 29–37 CrossRef CAS.
- Q. Z. Li, X. L. An, B. Gong and J. B. Cheng, Spectrochim. Acta, Part A, 2008, 69, 211–215 CrossRef PubMed.
- P. Y. Wen, X. F. Wang, W. Y. Xing, X. M. Peng, B. Yu, Y. Q. Shi, G. Tang, L. Song, Y. Hu and R. K. K. Yuen, Ind. Eng. Chem. Res., 2013, 52, 17015–17022 CrossRef CAS.
- B. Messerschmidt and P. van Hees, Fire Mater., 2000, 24, 121–130 CrossRef CAS.
- B. Schartel and T. R. Hull, Fire Mater., 2007, 31, 327–354 CrossRef CAS.
- S. Nazare, B. Kandola and A. R. Horrocks, Fire Mater., 2002, 26, 191–199 CrossRef CAS.
- Z. B. Shao, C. Deng, Y. Tan, L. Yu, M. J. Chen, L. Chen and Y. Z. Wang, J. Mater. Chem. A, 2014, 2, 13955–13965 CAS.
- C. A. Amarnath, C. E. Hong, N. H. Kim, B. C. Ku, T. Kuila and J. H. Lee, Carbon, 2011, 49, 3497–3502 CrossRef CAS.
- X. L. Hu, Y. Wang, J. R. Yu, J. Zhu and Z. M. Hu, J. Appl. Polym. Sci., 2018, 135 DOI:10.1002/app.45904.
- L. J. Li, Y. J. Chen, L. J. Qian, B. Xu and W. Xi, J. Appl. Polym. Sci., 2018, 135 DOI:10.1002/app.45960.
Footnote |
| † Electronic supplementary information (ESI) available. See DOI: 10.1039/c7ra12582h |
| This journal is © The Royal Society of Chemistry 2018 |

