
 Open Access Article
 This Open Access Article is licensed under a Creative Commons Attribution-Non Commercial 3.0 Unported Licence
Preparation of curcuminoid microemulsions from Curcuma longa L. to enhance inhibition effects on growth of colon cancer cells HT-29
Yen Chu Chen and
Bing Huei Chen *
*
Department of Food Science, Fu Jen Catholic University, New Taipei City 242, Taiwan. E-mail: 002622@mail.fju.edu.tw; Fax: +886-2-22093271; Tel: +886-2-29053626
First published on 9th January 2018
Abstract
The objectives of this study were to extract curcuminoid from Curcuma longa L. (C. longa), a vital medicinal plant demonstrated to possess many biological activities, and prepare the curcuminoid extract and microemulsion for studying the inhibition mechanism of HT-29 colon cancer cells. Results showed that a total of 3 curcuminoids including curcumin, demethoxycurcumin (DMC) and bisdemethoxycurcumin (BDMC), were separated within 10 min by using an Eclipse XDB-18 column and a gradient mobile phase of 0.1% formic acid solution (A) and acetonitrile (B). The curcuminoid microemulsion composed of soybean oil, Tween 80, ethanol and water was prepared with a high stability and mean particle size of 10.9 nm, zeta-potential of −65.2 mV and encapsulation efficiency of 85.7%. Both curcuminoid extract and microemulsion were effective in inhibiting HT-29 cell growth with the IC50 being 3.83 and 2.51 μg mL−1 after 24 h incubation, respectively, but further reduced to 2.23 and 1.94 μg mL−1, after 48 h incubation. Both treatments could decrease the proportion of both viable and necrosis cells and increase the proportion of both early and late apoptosis cells in a dose-dependent manner, with the cell cycle arrested at the S phase. Also, both treatments could up-regulate p53 expression and down-regulate cyclin A and CDK2 expressions through a p21-independent pathway. In addition, the expressions of Bax and cytochrome C as well as the activities of caspase-8, caspase-9 and caspase-3 increased for the curcuminoid extract, while the curcuminoid microemulsion showed the same trend with the exception that an insignificant change (p > 0.05) in Bax expression was observed. Collectively, this study demonstrated that the curcuminoid microemulsion prepared from C. longa may possess great potential for the treatment of colon cancer in the future.
1. Introduction
Curcuma longa L. (C. longa), a well-known traditional medicinal herb mainly produced in India, has been demonstrated to possess vital biological activities such as anti-oxidation, anti-inflammation, anti-diabetes and anti-cancer,1 which can be attributed to the presence of curcuminoids including curcumin, demethoxycurcumin (DMC) and bisdemethoxycurcumin (BDMC).2 However, because of instability and low aqueous solubility, curcuminoids were readily metabolized to other products after in vivo administration and resulted in low bioavailability and biological activity.3 Thus, finding an appropriate way to enhance curcuminoid bioavailability and improve therapeutic efficiency of chronic diseases is extremely important.Nanotechnology belongs to a science dealing with particle sizes in the range of 1–100 nm. Due to a large increase in both surface area and surface atoms, many chemical and physical properties of nanoparticles such as stability, bioavailability, solubility and absorption characteristics can be different from non-nanoparticles.4 Thus, nanotechnology finds wide application in food science, nutritional science, environmental science, pharmaceutical science and biomedical science. Among the various nanosized systems in food application, both microemulsion and nanoemulsion have received considerable attention in the past two decades due to their ease of preparation, high stability, enhancement of aqueous solubility, and capability of encapsulating unstable bioactive compounds to elevate bioavailability.5
Based on a report published by Ministry of Health of Taiwan in 2015,6 malignant tumor is the leading cause of death with colon cancer ranking 3rd, which may be associated with age, heredity and dietary factors such as low intake of fibers and micronutrients and high intake of fat. It has been well documented that the frequent consumption of foods rich in phytochemicals such as curcuminoids can reduce the incidence of colon cancer.7 Nevertheless, as mentioned above, the extremely low bioavailability and stability of curcuminoids in vivo can limit the therapeutic efficiency of colon cancers.
Numerous studies dealing with the biological activities of curcuminoids have been published. For instance, Ak and Gulcin8 reported that curcumin (15–45 ppm) was effective in inhibiting hydroperoxide formation and scavenging reactive oxygen species (ROS) such as hydrogen peroxide and superoxide anion as well as free radicals such as DPPH˙, ABTS˙, and DMPD˙. In an anti-inflammatory study dealing with the effect of curcumin (0.5–8 μM) on macrophage cells RAW 264.7, the expression of pro-inflammatory inducible nitric oxide synthase (iNOS) and activity of iNOS promoter was inhibited for further reduction in nitric oxide (NO) production,9 as the overproduction of NO can cause excessive expansion of blood vessels for tissue impairment. In another study Jiang et al.10 also reported that curcumin (5–50 μM) was effective in inhibiting growth of melanoma cells A375, MV3 and M14, with the IC50 being 8.29, 18.29 and 14.25 μM, respectively. Similarly, following treatment of hepatoma cells HepG2 and breast cancer cells MCF-7 and MDA-MB-231 with curcumin (5.19–162.3 μM), DMC (4.73–147.9 μM) and BDMC (4.35–135.9 μM), the maximum inhibition percentage ranged from 23.5–63.4%.11 A dose-dependent cytotoxicity of liposomal curcumin was shown towards head and neck squamous cells CAL27 and UM-SCC1 cells with an optimal growth inhibition at 200 μM and 50 μM, respectively.12 In a later study, Yallapu et al.13 demonstrated that the curcumin-loaded poly(lactic-co-glycolic acid) nanoparticle (2.5–40 μM) could inhibit prostate cancer cells C4-2, DU-145 and PC-3 dose-dependently with an IC50 value of 9.5, 4.9 and 20.4 μM, respectively. However, a larger IC50 value was shown for free curcumin (11.2, 7.6 and >40 μM) at the same dose range. In a study dealing with comparison of inhibitory effects of curcumin (5–100 μM) on osteosarcoma cells (MG-63) and normal osteoblast cells, Chang et al.14 showed <50% cell viability with MG-63 cells at 25 μM, whereas a >80% cell viability was shown for normal cells. Also, 5 curcumin-loaded liposome formulations in the dose range (5–50 μM) were shown to inhibit pancreatic cancer cells BxPC-3 with an IC50 value ranging from 1.92–3.4 μM, which was lower than that obtained for free curcumin (5.84 μM).15 In a later study Chang and Chen2 developed a curcuminoid nanoemulsion composed of curcuminoid extract, Tween 80 and water and studied its inhibition effect on lung cancer cells A549 and H460 growth, the IC50 was shown to be 3.9 and 2.9 ppm, respectively, with the cell cycle being arrested at G2/M phase for subsequent activation of pro-apoptotic proteins such as caspase-3, leading to cell apoptosis. More recently, Wang et al.16 reported a higher anti-lung cancer activity towards A549 cells by curcumin-loaded nanostructured lipid carriers prepared by fast emulsification and low-temperature solidification, with an IC50 value of 5.66 mg L−1 which was lower than for free curcumin (9.81 mg L−1). In addition, several comprehensive reviews on anticancer activity of curcumin and their analogues have been reported.17–19 However, the effect of curcuminoid microemulsion or nanoemulsion on inhibition of colon cancer cells and tumor growth was less explored.
The objectives of this study were to extract curcuminoids from Curcuma longa L. for preparation of curcuminoid extract and microemulsion and study their inhibition effects on growth of colon cancer cells HT-29.
2. Materials and methods
2.1. Materials
A total of 6 kg Curcuma longa L. was purchased from a Chinese drug store located at Taipei city and was washed, cut into pieces, freeze-dried, placed into separate bags and vacuum sealed for storage at −20 °C for use.Curcumin standard was obtained from Enzo Life Science Co. (Farmingdale, NY, USA), while DMC, BDMC and internal standard methyl red were from Sigma-Aldrich Co. (St. Louis, MO, USA). The HPLC-grade solvent acetonitrile was from Merck (Darmstadt, Germany), while both ethanol (99.9%) and formic acid were from Sigma-Aldrich Co. Deionized water was made using a Milli-Q water purification system from Millipore Co. (Bedford, MA, USA). Soybean oil was procured from Taiwan Sugar Co. (Tainan, Taiwan), while Tween 80 was from Yi-Da Co. (Taipei, Taiwan). Potassium dihydrogen phosphate was also from Sigma-Aldrich Co.
2.2. Cell culture reagents
Human colon cancer cell HT-29 and human lung fibroblast cell MRC-5 were a gift from Dr Rwei-Fen Huang of the Nutritional Science Department, Fu Jen University (Taipei, Taiwan), which was originally obtained from Bioresource Collection and Research Center (BCRC) at Taiwan Food Industry Research and Development Institute (FIRDI, Hsinchu, Taiwan). Both McCoy's 5A medium and minimum essential medium (MEM) were from Sigma-Aldrich Co. Fetal bovine serum (FBS) and 0.25% trypsin–EDTA were from HyClone Co. (Logan, UT, USA). Sodium pyruvate, non-essential amino-acid and penicillin–streptomycin were from Gibco Co. (CA, USA). Both sodium chloride and potassium chloride were from J. T. Baker Co. (Center Valley, PA, USA). Trypan blue (0.4%), dimethyl sulfoxide (DMSO), propidium iodide (PI), RNase A, sodium dodecyl sulfate (SDS), Tween 20, ethylenediaminetetraacetic acid (EDTA) and bovine serum albumin (BSA) were from Sigma-Aldrich Co. 3-(4,5-Dimethylthiazol-2-yl)-2,5-diphenyl tetrazolium bromide (MTT), Triton X-100, glycerol, glycine, Tris(hydroxylmethyl)aminomethane, phenylmethanesulfonyl fluoride (PMSF), ammonium persulfate (AP) and acrylamide (30%) were from USB Co. (Cleveland, OH, USA). Both Bradford reagent protein assay and Clarity Western ECL substrate were from Bio-Rad Co. (Hercules, CA, USA). Both caspase 3 assay kit and FITC Annexin V apoptosis detection kit were from BD Bioscience Co. (San Jose, CA, USA). Both caspase 8 and caspase 9 fluorometric assay kits were from Bio Vision Co. (Milpitas, CA, USA).The following primary antibodies: mouse anti-cyclin A and rabbit anti-bax were from EMD Millipore Co. (Bedford, MA, USA); mouse anti-p21, mouse anti-cytochrome C and mouse anti-CDK2 were from BD Bioscience Co.; both mouse anti-p53 and mouse anti-GAPDH were from Novus Bio Co. (Littletown, Co, USA).
The following secondary antibodies: goat anti-mouse-IgG-HRP was from Jackson Immune Research Lab (West Grove, PA, USA); anti-rabbit IgG and horseradish peroxidase linked whole antibody from donkey were from GE Healthcare Co. (Little Chalfont, Buckinghamshire, UK).
2.3. Extraction and HPLC analysis of curcuminoids
A dried curcuma powder sample (5 g) was mixed with 50 mL anhydrous ethanol in a tube, after which the mixture was sonicated at 40 kHz (100 W) for 1 h and then centrifuged at 4000 rpm (4 °C) for 10 min. The supernatant was collected, evaporated to dryness, dissolved in 20 mL anhydrous ethanol and filtered through a 0.22 μm membrane filter for storage at −20 °C. An HPLC method developed by Chang and Chen2 was modified to separate, identify and quantify the various curcuminoids in curcuma samples. An Agilent Eclipse XDB C18 column (150 × 4.6 mm ID, 5 μm particle size) and a gradient mobile phase of 0.1% formic acid in water (A) and acetonitrile (B) was used: 60% A and 40% B in the beginning, raised to 50% B in 3 min, maintained for 3 min, raised to 90% B in 12 min and returned to 40% B in 14 min. Three curcuminoids including curcumin, DMC and BDMC were separated within 10 min with flow rate at 1 mL min−1, column temperature at 35 °C and detection wavelength at 425 nm. In addition, curcumin, BMC and BDMC were identified by comparing retention time, absorption spectra and mass spectra of unknown peaks with reference standards. For method validation, both limit of detection (LOD) and limit of quantitation (LOQ) as well as recovery and both intra-day and inter-day variability were determined using the same approach as described by Chang and Chen.2 Likewise, an internal standard (methyl red) was used for quantitation of curcumin, DMC and BDMC in curcuma samples based on the method by Chang and Chen.22.4. Preparation of curcuminoid microemulsion
Initially the 1.35 mL curcuminoid extract containing curcuminoid at 22.2 mg mL−1 was collected and evaporated to dryness under nitrogen. Then 0.1 g (1%) of soybean oil was added to dissolve the residue, followed by adding 0.3 g (3%) of anhydrous ethanol as cosolvent. After mixing homogeneously, 1.4 g (14%) Tween 80 was added and stirred, followed by adding 8.2 g (82%) of deionized water for mixing. After sonication for 30 min, a 10 mL microemulsion containing 3 mg mL−1 curcuminoid was prepared. Based on the relative percentage of 3 curcuminoids as determined by HPLC, their individual concentration was calculated to be 623, 3106.5 and 4777.2 μM for BDMC, DMC and curcumin, respectively.2.5. Determination of curcuminoid microemulsion characteristics
For measurement of particle size distribution, 100 μL of curcuminoid microemulsion were collected separately, diluted with 50 mM of potassium dihydrogen phosphate solution (pH 5.5) 50 times and poured into a polystyrene tube for determination by a dynamic light scattering instrument (DLS) (Brookhaven Instruments Co., Holtsville, NY, USA). The data was analyzed by a BIC particle sizing 90 plus software system.For zeta potential determination, 100 μL of curcuminoid microemulsion was collected and diluted with deionized water 50 times. Then 200 μL sample was collected in a tube for measurement at 25 °C by a zeta potential analyzer (Horiba Scientific Co., Kyoto, Japan).
For particle size and shape determination, 100 μL of microemulsion was collected and diluted with deionized water 100 times, after which 20 μL was collected and dropped on copper grid for 30 seconds. The extra sample was then removed with a filter paper, followed by adding phosphotungstic acid (1%) for negative staining for 30 seconds, removing the excess acid with a filter paper, and placing in an oven for complete drying for subsequent analysis by a transmission electron microscope (TEM) (JEOL Co., Tokyo, Japan) by enlargement 300![[thin space (1/6-em)]](https://www.rsc.org/images/entities/char_2009.gif) 000 times under 120 kVA.
000 times under 120 kVA.
For encapsulation efficiency study, a method as described by Bisht et al.20 was followed. In brief, a 10 μL sample of curcuminoid microemulsion was mixed with 490 μL of deionized water and then the solution was diluted with deionized water 50 times, followed by collecting a portion in a tube containing a dialysis membrane with the MW cut-off at 3 kDa. After centrifuging at 12000 rpm (25 °C) for 30 min, free curcuminoid could pass through the membrane and enter into the lower layer solution, in which a portion (300 μL) was collected, evaporated to dryness under nitrogen, dissolved in anhydrous ethanol, and filtered through a 0.22 μm membrane filter for HPLC analysis of curcuminoids. The encapsulation efficiency of curcuminoid was then calculated using the same formula as described by Chang and Chen.2
For storage stability study, curcuminoid microemulsion was stored at 4 °C and 25 °C for 90 days, during which particle size distribution and zeta potential were determined every 15 days by DLS and zeta potential analyzer, respectively. Meanwhile, the appearance of curcuminoid microemulsion was observed by eye during storage to judge if there was any phase separation phenomenon occurred.
For thermal stability study, a portion (200 μL) of curcuminoid microemulsion was collected and poured into a tube for a total of 32 tubes separately, followed by heating in a water bath (30, 40, 50, 60, 70, 80, 90 and 100 °C) for 0.5, 1, 1.5 and 2 h. Then the particle size distribution and zeta potential were analyzed for each curcuminoid microemulsion. Also, all the curcuminoid microemulsions after heating were analyzed for curcuminoid contents by HPLC. Briefly, a portion (500 μL) of sample was collected, followed by adding 1 mL of anhydrous ethanol for microemulsion disruption, dissolving in 500 μL anhydrous ethanol and filtering through a 0.22 μm membrane filter for HPLC analysis.
2.6. Cell culture
Human colon cancer cell lines HT-29 was cultured in the McCoy's medium, which was prepared by mixing 700 mL of deionized water, 1 L of medium powder, 2.2 g of sodium bicarbonate, 100 mL of FBS, and 10 mL of penicillin–streptomycin followed by diluting to 1 L with deionized water and adjusting pH to 7.2–7.4. Human lung fibroblast cell lines MRC-5 was cultured in the Eagle's minimum essential medium, which was prepared by mixing 700 mL of deionized water, 1 L of medium powder, 1.5 g of sodium bicarbonate, 100 mL of FBS, 10 mL of penicillin–streptomycin, 10 mL of sodium pyruvate (100 mM) and 10 mL of non-essential amino acid (10 mM), followed by diluting to 1 L with deionized water and adjusting pH to 7.2–7.4. After preparation, both mediums were filtered through a 0.22 μm membrane filter and stored at 4 °C. For subculture, both HT-29 and MRC-5 cells were cultured in a 10 cm plate separately and incubated in a 37 °C incubator (5% CO2) for 3–4 days. After about 80% of cell confluency was attained, the medium was removed and washed with PBS. Then 1 mL of 0.25% trypsin–EDTA was added and incubated for 10 min for cell loss, followed by adding 1 mL medium, transferring into a tube and centrifuging at 1500 rpm (25 °C) for 5 min. The supernatant was discarded, 1 mL medium was added for cell dispersion, and a portion of cells was collected for seeding in fresh medium.2.7. Cell morphology
Cells were seeded in a 6-well plate with each well containing 5 × 10⁵ cells and then incubated for 24 h for cell adhesion, after which the medium was discarded and different doses of curcuminoid extracts and microemulsions were added separately for incubation for 24 h and 48 h. Then the cell morphology was observed under a microscope.2.8. MTT assay
Cells were seeded in a 96-well plate with each well containing 1 × 10⁴ cells and then incubated for 24 h for cell adhesion, after which the medium was discarded and various doses (1.5, 3, 4.5, 6 and 7.5 μg mL−1) of curcuminoid extracts and microemulsions were added separately (200 μL each) for further incubation for 24 h and 48 h. Then the medium was removed, followed by adding 200 μL of MTT solution (0.5 mg mL−1 in PBS), incubating for 2 h, adding 100 μL DMSO to dissolve purple crystal (formazan) and measuring absorbance at 570 nm with an ELISA reader, the relative cell survival rate and IC50 (concentration of 50% inhibition) were calculated.22.9. Cell cycle analysis
Cells were seeded in a 6-well plate with each well containing 1 × 10⁶ cells and cultured for 24 h for cell adhesion, after which 3 doses (3, 4.5 and 6 μg mL−1) of curcuminoid extracts and microemulsions were added separately for further incubation for 48 h. Then the medium was transferred to a tube and 0.5 mL of trypsin–EDTA (0.25%) was added for incubation for 10 min for cell loss, followed by adding 0.5 mL medium, centrifuging at 1500 rpm for 5 min, removing supernatant, adding PBS (0.5 mL) twice, adding 1 mL of 70% ethanol (4 °C) and cooling overnight for cell fixation. Next, cells were centrifuged again at 1500 rpm for 5 min. After removing the supernatant, PBS (0.5 mL) was added twice, followed by adding 0.8 mL of PBS, 0.1 mL of RNase A (1 mg mL−1) and 0.1 mL of propidium iodide (PI) (100 μg mL−1), reacting at 37 °C for 30 min in the dark, filtering through a 40 μm nylon screen, and analyzing cell cycle distribution including sub-G1, G0/G1, S and G2/M phases, by a flow cytometer.2.10. Annexin V/PI staining assay
Cells were seeded in a 6-well plate with each well containing 1 × 10⁶ cells and incubated for 24 h for cell adhesion. Then the medium was discarded and various doses (3, 4.5 and 6 μg mL−1) of curcuminoid extracts and microemulsions were added separately for further incubation for 48 h. The medium was transferred to a tube and 0.5 mL of trypsin–EDTA (0.25%) was added for incubation for 10 min for cell loss, followed by centrifuging at 1500 rpm for 5 min, removing supernatant, washing with PBS twice, suspending cells with the binding buffer (0.1 mL), adding 5 μL of annexin V-fluorescein isothiocyanate (FITC) and 10 μL of PI for reaction in the dark for 15 min for analysis of both early and late apoptotic cells as well as necrotic cell populations by a flow cytometer.2.11. Western blotting
Prior to protein extraction, cells were cultured using the same procedure as cell cycle analysis with the exception that each well contained 5 × 10⁵ cells and 50 μL of cell lysis buffer was added after centrifugation for sonication at 4 °C for 30 min for protein extraction and then centrifuged again at 12000 rpm (4 °C) for 30 min. The supernatant was collected and stored at −80 °C. Protein was quantified based on the standard curve of bovine serum albumin (BSA), which was obtained by plotting 8 concentrations of BSA (6.25, 12.5, 25, 50, 75, 100, 125 and 150 μg mL−1) containing the Bradford reagent against absorbance at 595 nm.
For protein expressions analysis, the cell lysate was mixed with sample buffer and heated in a 95 °C water bath for 5 min, after which a 40 μg sample was collected in a tank for protein separation at 90 V for 20 min and then at 110 V for 90 min on 12% SDS-polyacrylamide gel. Next, the polyvinylidene fluoride (PVDF) membrane was activated for 1 min and soaked in transfer buffer, followed by transblotting at 100 V (4 °C) for 1 h, soaking in blocking buffer again, adding TBST (0.05% Tween 20 in TBS) for washing 3 times, and adding diluted primary antibodies in the following ratio: p53 (1:1000), p21 (1:200), cyclin A (1:1000), CDK2 (1:1000), Bax (1:1000) and cytochrome C (1:500). After shaking at 4 °C for 24 h, TBST was added for washing 3 times and the secondary antibody horseradish peroxidase (HRP) (1:5000) was added, followed by washing with TBST 3 times, adding the chemiluminescence (ECL) reagent for reaction for 5 min, and detection by a BioSpectrum imaging system.
2.12. Activities of caspase-3, caspase-8 and caspase-9
All the activities of caspase-3, caspase-8, caspase-9 were analyzed using the commercial fluorescence assay kits. For caspase-3, 25 μL of the cell lysate was mixed with 100 μL of the 1× HEPES buffer 4-(2-hydroxyethyl)-1-piperazineethanesulfonic acid, followed by reacting in a 37 °C water bath for 1 h in the dark, transferring to a 96-well plate and measuring absorbance with excitation at 380 nm and emission at 440 nm. For caspase-8 and caspase-9, 50 μL of the cell lysate was mixed with 50 μL of the 2× reaction buffer, followed by reacting in a 37 °C water bath for 1 h in the dark, transferring to a 96-well plate and measuring absorbance with excitation at 400 nm and emission at 505 nm.2.13. Statistical analysis
All the data were analyzed using the statistical analysis system21 and subjected to analysis of variance by ANOVA as well as Duncan's multiple range test for significance in mean comparison (p < 0.05).3. Results and discussion
3.1. HPLC analysis of curcuminoids in C. longa
Fig. 1 shows the HPLC chromatogram of curcuminoid standards (A) and curcuminoid extract (B). By employing the gradient mobile phase shown in the method section, a total of 3 curcuminoids including BDMC, DMC and curcumin were separated within 10 min and identified based on maximum absorption wavelength and mass spectra (Table 1),22,23 with the peak purities being 98.9, 99.4 and 98.3%, respectively. For method validation, the LOD of BDMC, DMC and curcumin were 0.006, 0.006 and 0.004 ppm, respectively, while the LOQ were 0.018, 0.017 and 0.011 ppm. The relative standard deviation (RSD) of intra-day variability of BDMC, DMC and curcumin were 2.6, 1.3 and 1%, respectively, whereas the RSD of the inter-day variability were 1.6, 1.2 and 1.1%, implying that a high repeatability and reproducibility was accomplished by using this method. The linear regression equations of BDMC, DMC and curcumin were y = 1.9312x + 0.2047, y = 1.9841x + 0.1279 and y = 3.593x + 0.1416, respectively, with the coefficient of determination (R2) being 0.9986, 0.9978 and 0.9985. Following quantitation based on sample dry weight, curcumin was present in the largest amount (2632.1 μg g−1), followed by DMC (1568.8 μg g−1) and BDMC (287.2 μg g−1). However, based on the sample extract, the contents of BDMC, DMC and curcumin were 71.8 μg mL−1 (233 μM), 392.2 μg mL−1 (1160 μM), and 658 μg mL−1 (1788 μM), respectively. In a previous study Ashraf et al.24 reported that C. longa produced in the south region of India possessed the highest amount of curcuminoids (50.27 mg g−1), while that produced in the west region of India contained the lowest amount (14.08 mg g−1). Similarly, Li et al.25 determined the curcuminoid contents in roots and rhizomes in 4 varieties of C. longa produced in China and reported that the variety grown in Sichuan province contained the highest level of curcuminoids (40.36 mg g−1), while no curcuminoids were detected in the root of C. phaeocaulis as well as the roots and rhizomes of C. wenyujin and C. kwangsiensis. Apparently the curcuminoid content in C. longa can be varied depending on variety, growth location and environment, as well as part of C. longa plants.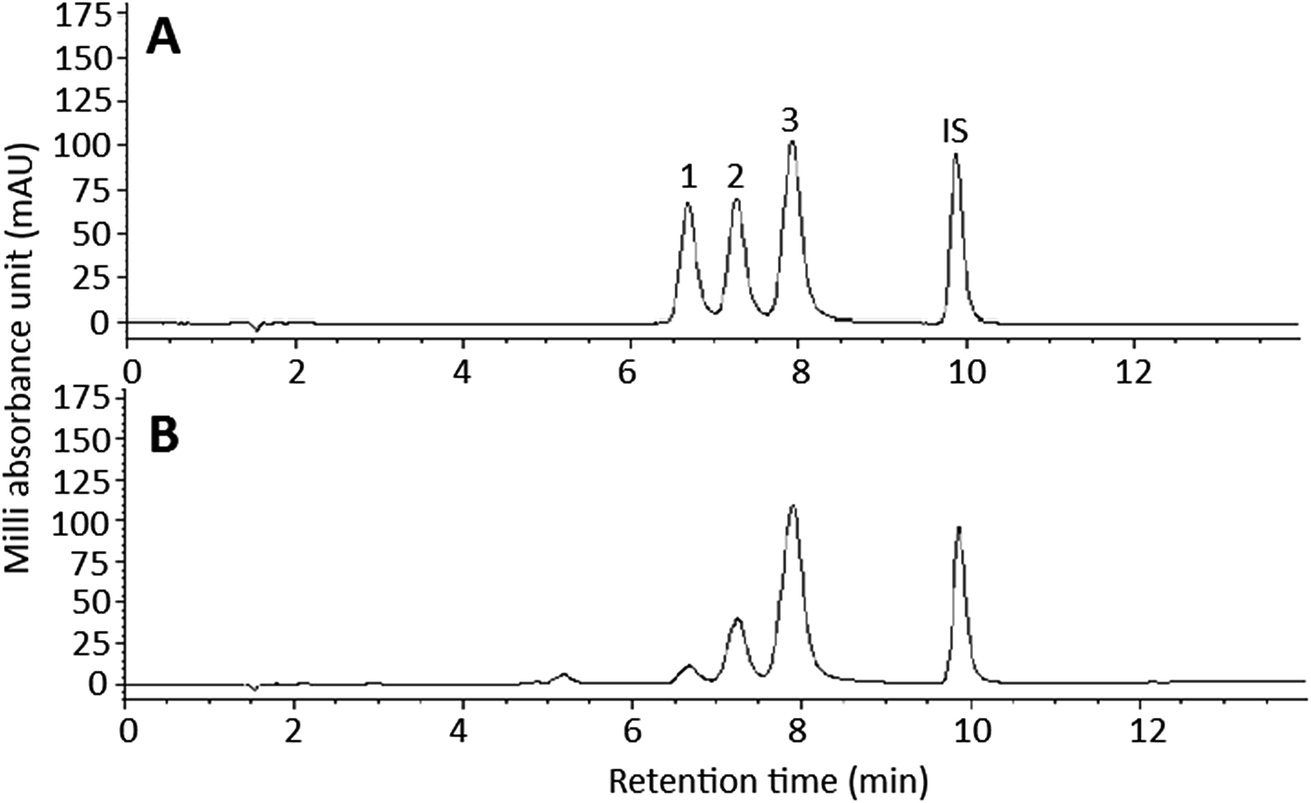 | ||
| Fig. 1 HPLC chromatogram of curcuminoid standards (A) and curcuminoid extract (B). Peaks: 1, bisdemethoxycurcumin (BDMC); 2, demethoxycurcumin (DMC); 3, curcumin; IS, internal standard methyl red. | ||
| Peak no. | Compound | tR (min) | Peak purity (%) | λmaxa (on-line) | λmaxa (standard) | λmaxb (reported) | m/z (on-line) [M − H]− | m/z (standard) [M − H]− | m/zc (reported) |
|---|---|---|---|---|---|---|---|---|---|
| a A gradient mobile phase of 0.1% formic acid and acetonitrile was used (from 60:40, v/v to 10:90, v/v).b Based on a reference by Karioti et al.22c Based on a reference by Inoue et al.23d IS: internal standard. |
|||||||||
| 1 | Bisdemethoxycurcumin (BDMC) | 6.67 | 98.9 | 242, 418 | 248, 416 | 248, 416 | 307 [M − H]− | 307 [M − H]− | 307 |
| 2 | Demethoxycurcumin (DMC) | 7.25 | 99.4 | 252, 422 | 250, 422 | 252, 422 | 337 [M − H]− | 337 [M − H]− | 337 |
| 3 | Curcumin | 7.9 | 98.3 | 262, 424 | 260, 424 | 264, 428 | 367 [M − H]− | 367 [M − H]− | 367 |
| ISd | Methyl red | 9.87 | |||||||
3.2. Curcuminoid microemulsion characteristics
Fig. 2A shows particle size distribution of curcuminoid microemulsion as determined by DLS, with the mean particle size and polydispersity index (PI) being 10.9 nm and 0.137, respectively. Accordingly, a narrow particle size distribution can be obtained by controlling the PI ranging from 0.1–0.25.26 Thus, a highly homogeneous curcuminoid microemulsion with narrow particle size distribution was successfully prepared. The TEM image of curcuminoid microemulsion is shown in Fig. 2B, with the shape being oval and average particle size 10.2 nm, which is similar to that obtained by DLS.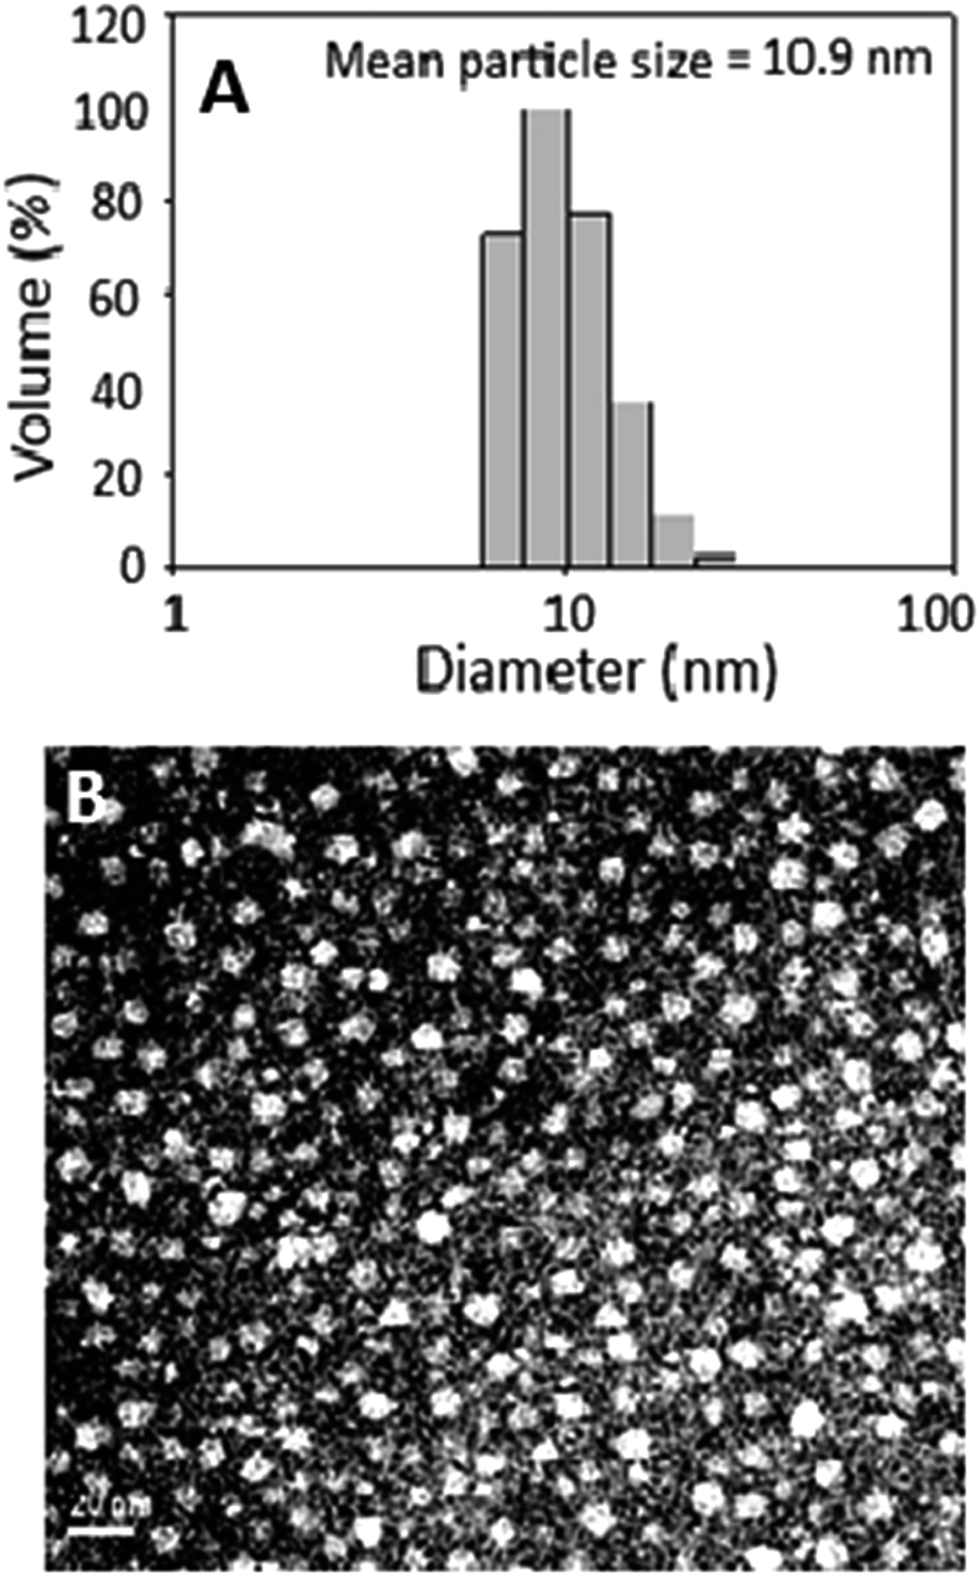 | ||
| Fig. 2 Particle size distribution by DLS (A) and TEM image (B) of curcuminoid microemulsion. | ||
Compared to many published reports, the size of curcuminoid microemulsion prepared in our experiment was much smaller. For instance, Anuchapreeda et al.27 prepared curcuminoid nanoemulsion composed of hydrogenated L-α-phosphatidylcholine and water, with soybean oil or lecithin as oil phase and HCO-60 or Tween 80 as cosolvent. Result showed that the size of curcuminoid nanoemulsion (51 nm) with soybean oil as oil phase was smaller than that with lecithin as oil phase (74.6 nm). Likewise, with Tween 80 as cosolvent, the size of curcuminoid nanoemulsion (51 nm) was smaller than that with HCO-60 as cosolvent (95.3 nm). In a later study Ahmed et al.28 prepared curcuminoid nanoemulsion composed of 1% β-lactoglobulin in phosphate buffered saline (PBS) and long-chain triglyceride (LCT), medium-chain triglyceride (MCT) or short-chain triglyceride (SCT) as oil phase and compared their effects on size and PI. The largest size (1981 nm) and a high PI (0.75) was observed with SCT as oil phase. However, with LCT, MCT or LCT–SCT (50:50) as oil phase, a much smaller size (174–182 nm) and PI (0.13–0.19) of the curcuminoid nanoemulsion was obtained. Similarly, Xiao et al.29 prepared curcuminoid microemulsion composed of MCT (WL1349), Cremorphor RH40, glycerol and water and reported that the higher the level of the surfactant, the smaller the particle size and PI and the higher the stability. Also, a highly stable curcumin microemulsion composed of α-tocopherol, Tween 20, ethanol and water (3.3:53.8:6.6:36.3) was successfully prepared by Bergonzi et al.,30 as shown by a transparent appearance over a 60 day storage period at 4 °C. Obviously the physical and chemical characteristics of curcuminoid microemulsion or nanoemulsion can be varied depending on difference in variety and amount of oil phase, surfactant, solvent or cosolvent as well as preparation method.
In addition, zeta potential is a vital index for assessment of curcuminoid microemulsion or nanoemulsion stability. Accordingly, a highly stable nanoemulsion or microemulsion can be obtained by controlling the zeta-potential at >30 mV or <−30 mV26 because of electrostatic repulsion between nanoparticles. In our study the zeta-potential of curcuminoid microemulsion was −65.3 mV, demonstrating a high stability of this microemulsion. Also, the encapsulation efficiency of curcuminoids in this microemulsion was determined to be 85.7%. Comparatively, the zeta potential and the particle size of the curcuminoid microemulsion prepared in our study were much smaller than that in many published reports.31,32
For stability study, the curcuminoid microemulsions were stored at 4 °C and 25 °C for 90 days, during which both particle size distribution and zeta-potential were determined every 15 days. Only a minor difference in both particle size distribution and zeta potential was shown, demonstrating again a high stability of this microemulsion. For the heat stability study, the zeta-potential followed a time-dependent decline at 100 °C and reached −35.7 mV at 1.5 h. However, compared to control, the curcuminoid contents decreased to 98.8% and 89.5% after 90 °C and 100 °C heating for 2 h, respectively. This finding suggested that a high stability of the curcuminoid microemulsion could still be maintained when heated at 100 °C for 1.5 h.
3.3. Effect of DMSO and blank microemulsion on colon cancer cell HT-29
Fig. 3 shows the effect of different doses of DMSO and blank microemulsion on growth of colon cancer cells HT-29 (A) and lung fibroblast cells MRC-5 (B) after 48 h incubation as measured by MTT assay. As DMSO was used to dissolve curcuminoid for subsequent cell culture study, the effect of DMSO on both HT-29 and MRC-5 growth needs to be explored. Likewise, the effect of blank microemulsion on both HT-29 and MRC-5 growth needs to be investigated to verify that the anti-proliferation effect of HT-29 cells was caused by curcuminoids instead of blank microemulsion components. It was shown that following treatment with 0.1% DMSO or blank microemulsion, the HT-29 growth remained no significant difference (p > 0.05). Thus, both doses (0.1%) of DMSO and blank microemulsion were selected to study the effect of curcuminoid extract and microemulsion on anti-proliferation of HT-29 cells. Similarly, the growth of MRC-5 cells remained unaffected (p > 0.05) after treatment with 0.05–0.09% of DMSO or blank microemulsion. Therefore, both doses (0.05%) of DMSO and blank microemulsion were selected to study the effect of curcuminoid extract and microemulsion on growth of MRC-5 cells.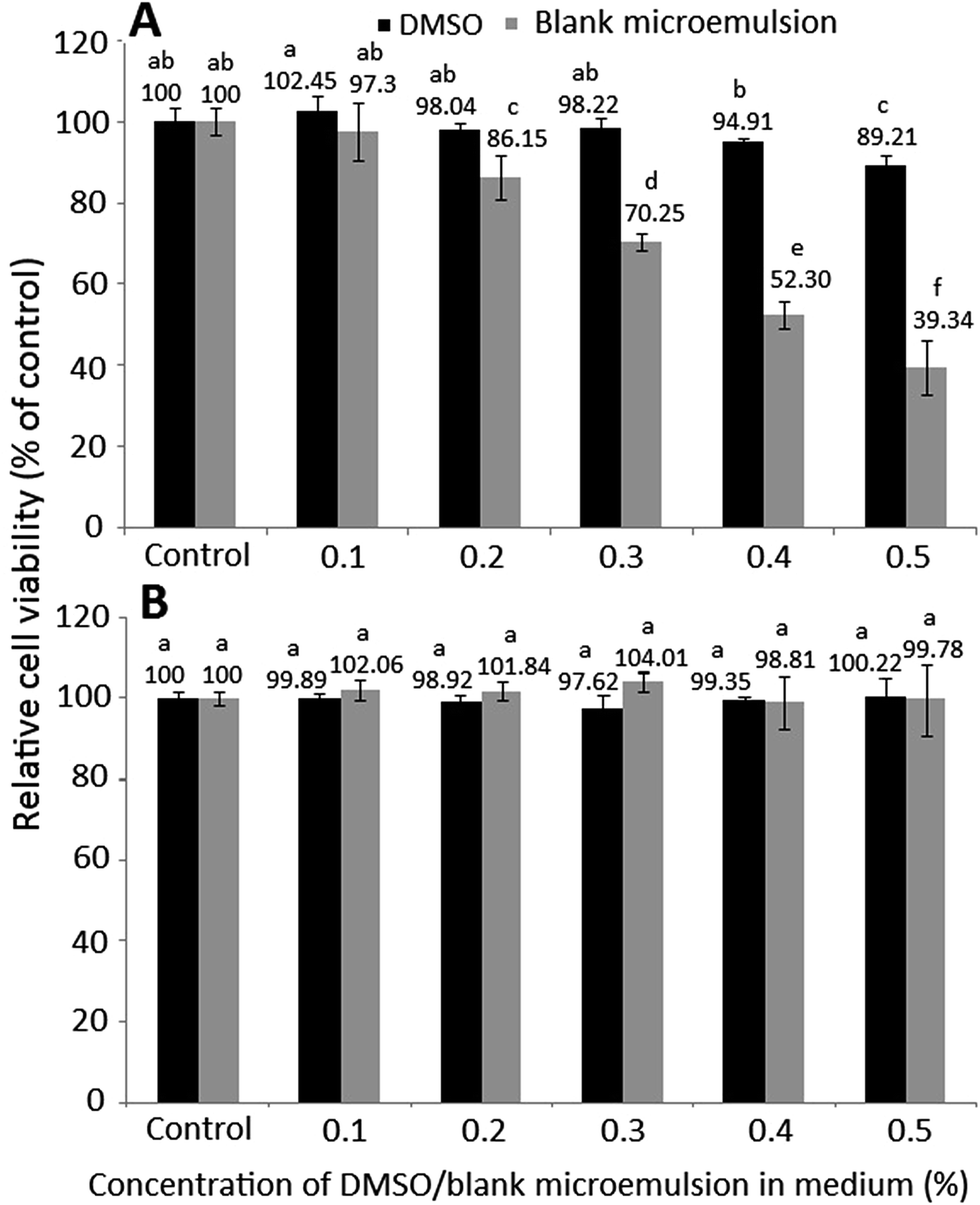 | ||
| Fig. 3 Effect of different concentrations of DMSO and blank microemulsion on colon cancer cell HT-29 (A) and lung fibroblast cell MRC-5 (B) growth after 48 h incubation as measured by MTT. Data are represented as mean ± standard deviation (n = 3) with different letters indicating significantly different cell viability at p < 0.05. | ||
3.4. Effect of curcuminoid extract and microemulsion on colon cancer cells
The effect of different doses of curcuminoid extract and microemulsion on growth of colon cancer cells HT-29 (A and B) and lung fibroblast cells MRC-5 (C and D) after 24 h (A and C) and 48 h (B and D) incubation as measured by MTT assay is shown in Fig. 4. A dose-dependent decline in growth of HT-29 cells was shown for both curcuminoid extract and microemulsion treatments after 24 h incubation (Fig. 4A and C). By comparison, the IC50 of curcuminoid extract and microemulsion were 3.83 and 2.51 μg mL−1, respectively, implying that the latter was more effective in inhibiting HT-29 cell growth than the former. The same trend was also observed after 48 h incubation (Fig. 4B and D), with the IC50 being 2.23 and 1.94 μg mL−1 for curcuminoid extract and microemulsion, respectively. Apparently a time-dependent response also occurred for both curcuminoid extract and microemulsion treatments, as evident by a much lower IC50 after 48 h incubation.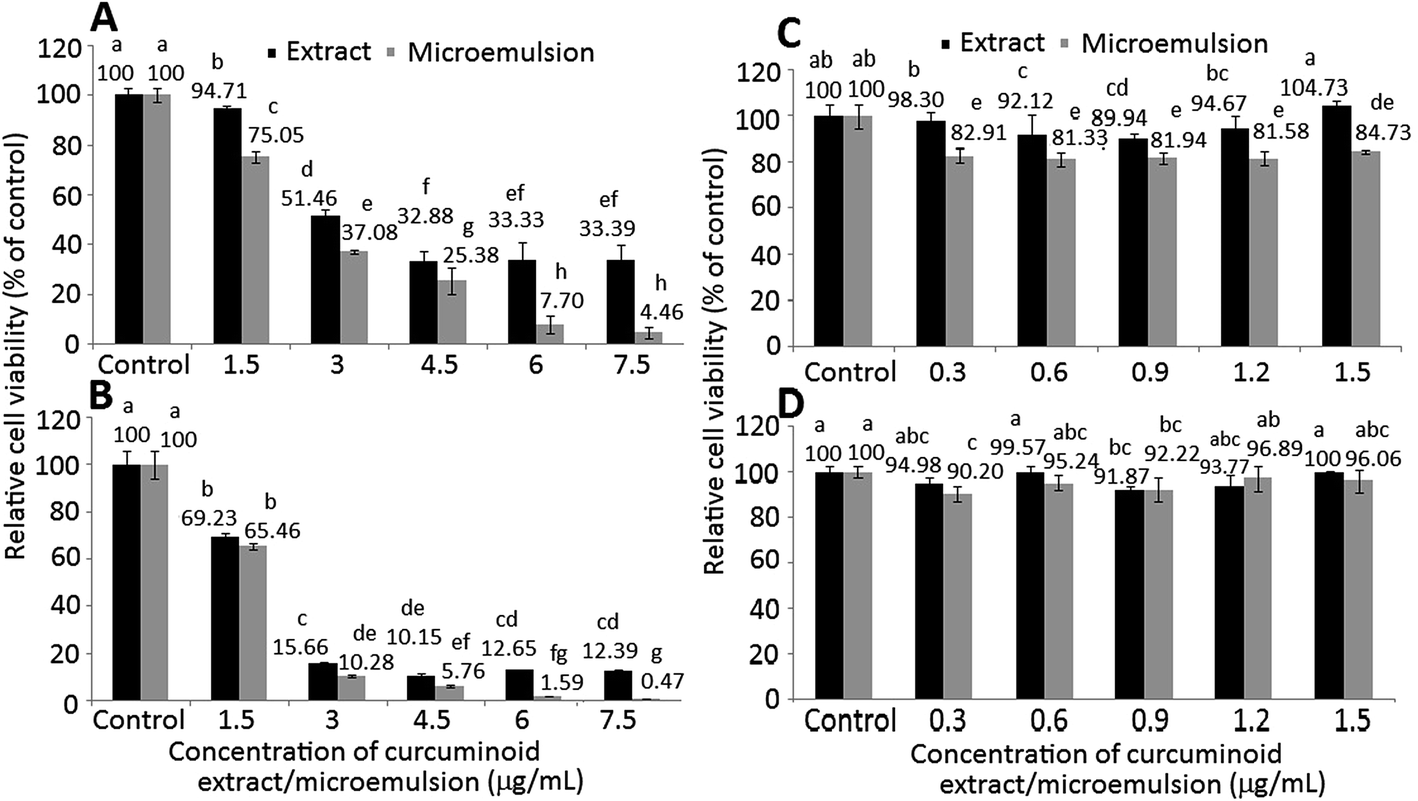 | ||
| Fig. 4 Effect of different concentrations of curcuminoid extract and microemulsion on colon cancer cell HT-29 (A, B) and lung fibroblast cell MRC-5 (C, D) growth after 24 h (A, C) and 48 h (B, D) incubation as measured by MTT. Data are represented as mean ± standard deviation (n = 3) with different letters indicating significantly different cell viability at p < 0.05. | ||
In the literature reports most studies deal with the effect of curcumin on inhibition of cancer cell growth. For instance, both dose- and time-dependent decrease in growth of colon cancer cells HCT-116 was shown after treatment with curcumin (5–50 μM) for 24 h.33 Similarly, Su et al.34 also observed a time-dependent decline of colon cancer cells colo 205 after curcumin (50 μM) treatment for 6–24 h. Also, after treatment of colon cancer cells HCT-116, SW-620 and HT-29 with curcumin (10–50 μM) for 4 h, a dose-dependent response was shown with the IC50 being 28.9, 23.1 and 37.4 μM, respectively.35 This outcome revealed that the inhibition efficiency of curcumin towards different types of colon cancer cells can be varied.
In addition to curcumin standard, the effect of curcuminoid nanoemulsion or microemulsion on growth of colon cancer cells was less explored. However, for some other types of cancer cells, Aditya et al.36 reported that when compared to curcumin standard at the same dose (20 μM), the inhibition percentage of prostate cancer cells PC-3 was raised by 9% following treatment with curcumin nanoemulsion composed of glycerol monostearate, oleic acid, lecithin, Tween 80 and water for 24 h. Similarly, in a study dealing with the effects of curcumin standard and nanoemulsion on growth of ovarian cancer cells SKOV3, the IC50 were 9.8 μM for the former and 9.4 μM for the latter composed of flaxseed oil, lecithin, polyethylene glycol and water after 3 day incubation.37 However, the IC50 could be further reduced to 6.2 μM without polyethylene glycol in the nanoemulsion, revealing that curcumin nanoemulsion was more efficient in inhibiting cancer cell growth than curcumin standard. Comparatively, the curcuminoid microemulsion prepared in our study possessed a more pronounced anti-proliferation effect towards colon cancer cells than curcumin nanoemulsion in the literature reports, probably driven by the synergistic effect of curcumin, DMC and BDMC present in the microemulsion. Also, a smaller particle size of the curcuminoid microemulsion may also be responsible for this effect.
For MRC-5 cells, the viability dropped to 92.12, 89.94 and 94.67%, respectively, after treatment with 0.6, 0.9 and 1.2 μg mL−1 of curcuminoid extract for 24 h (Fig. 4C). However, there was no significant difference (p > 0.05) in MRC-5 cell viability between control and curcuminoid extract treatment with doses at 0.3 and 1.5 μg mL−1. By comparison at the same dose and incubation time (24 h or 48 h), a much lower cell viability was shown for curcuminoid microemulsion than for curcuminoid extract (Fig. 4C and D). In addition, both curcuminoid extract and microemulsion treatments also followed a time-dependent decline in MRC-5 cell viability. This outcome indicated that curcuminoid microemulsion was more destructive to MRC-5 cells than curcuminoid extract, probably caused by the presence of surfactants in the microemulsion.
3.5. Cell morphology
The morphological changes of colon cancer cells HT-29 when treated with various doses of curcuminoid extracts and microemulsions for 24 h (A) and 48 h (B) is shown in Fig. 5. Apparently the cell number followed a dose-dependent decline for both curcuminoid extract and microemulsion treatments after 24 h and 48 h incubation. In addition, cells became more shrunk and elongated at a high dose of 7.5 μg mL−1. Comparatively, a prolonged incubation time (48 h) could lead to a greater reduction of cell number as well as more cell shrinkage than that at 24 h. This finding is in agreement with the MTT assay result that both curcuminoid extract and microemulsion possessed both dose- and time-dependent responses in inhibiting HT-29 cell growth. Similar outcomes were reported by several other authors. For example, Song et al.38 pointed out that after treatment of HT-29 cells with curcumin (50 μM) for 24 h, cells became shrunk and fragmented accompanied by chromatin condensation and nuclear fragmentation. The cell number of both lung cancer cells NCI-H460 and hepatoma cells HepG2 declined significantly following treatment with curcumin (5–40 μM) and curcumin microemulsion for 24 h, respectively.32,39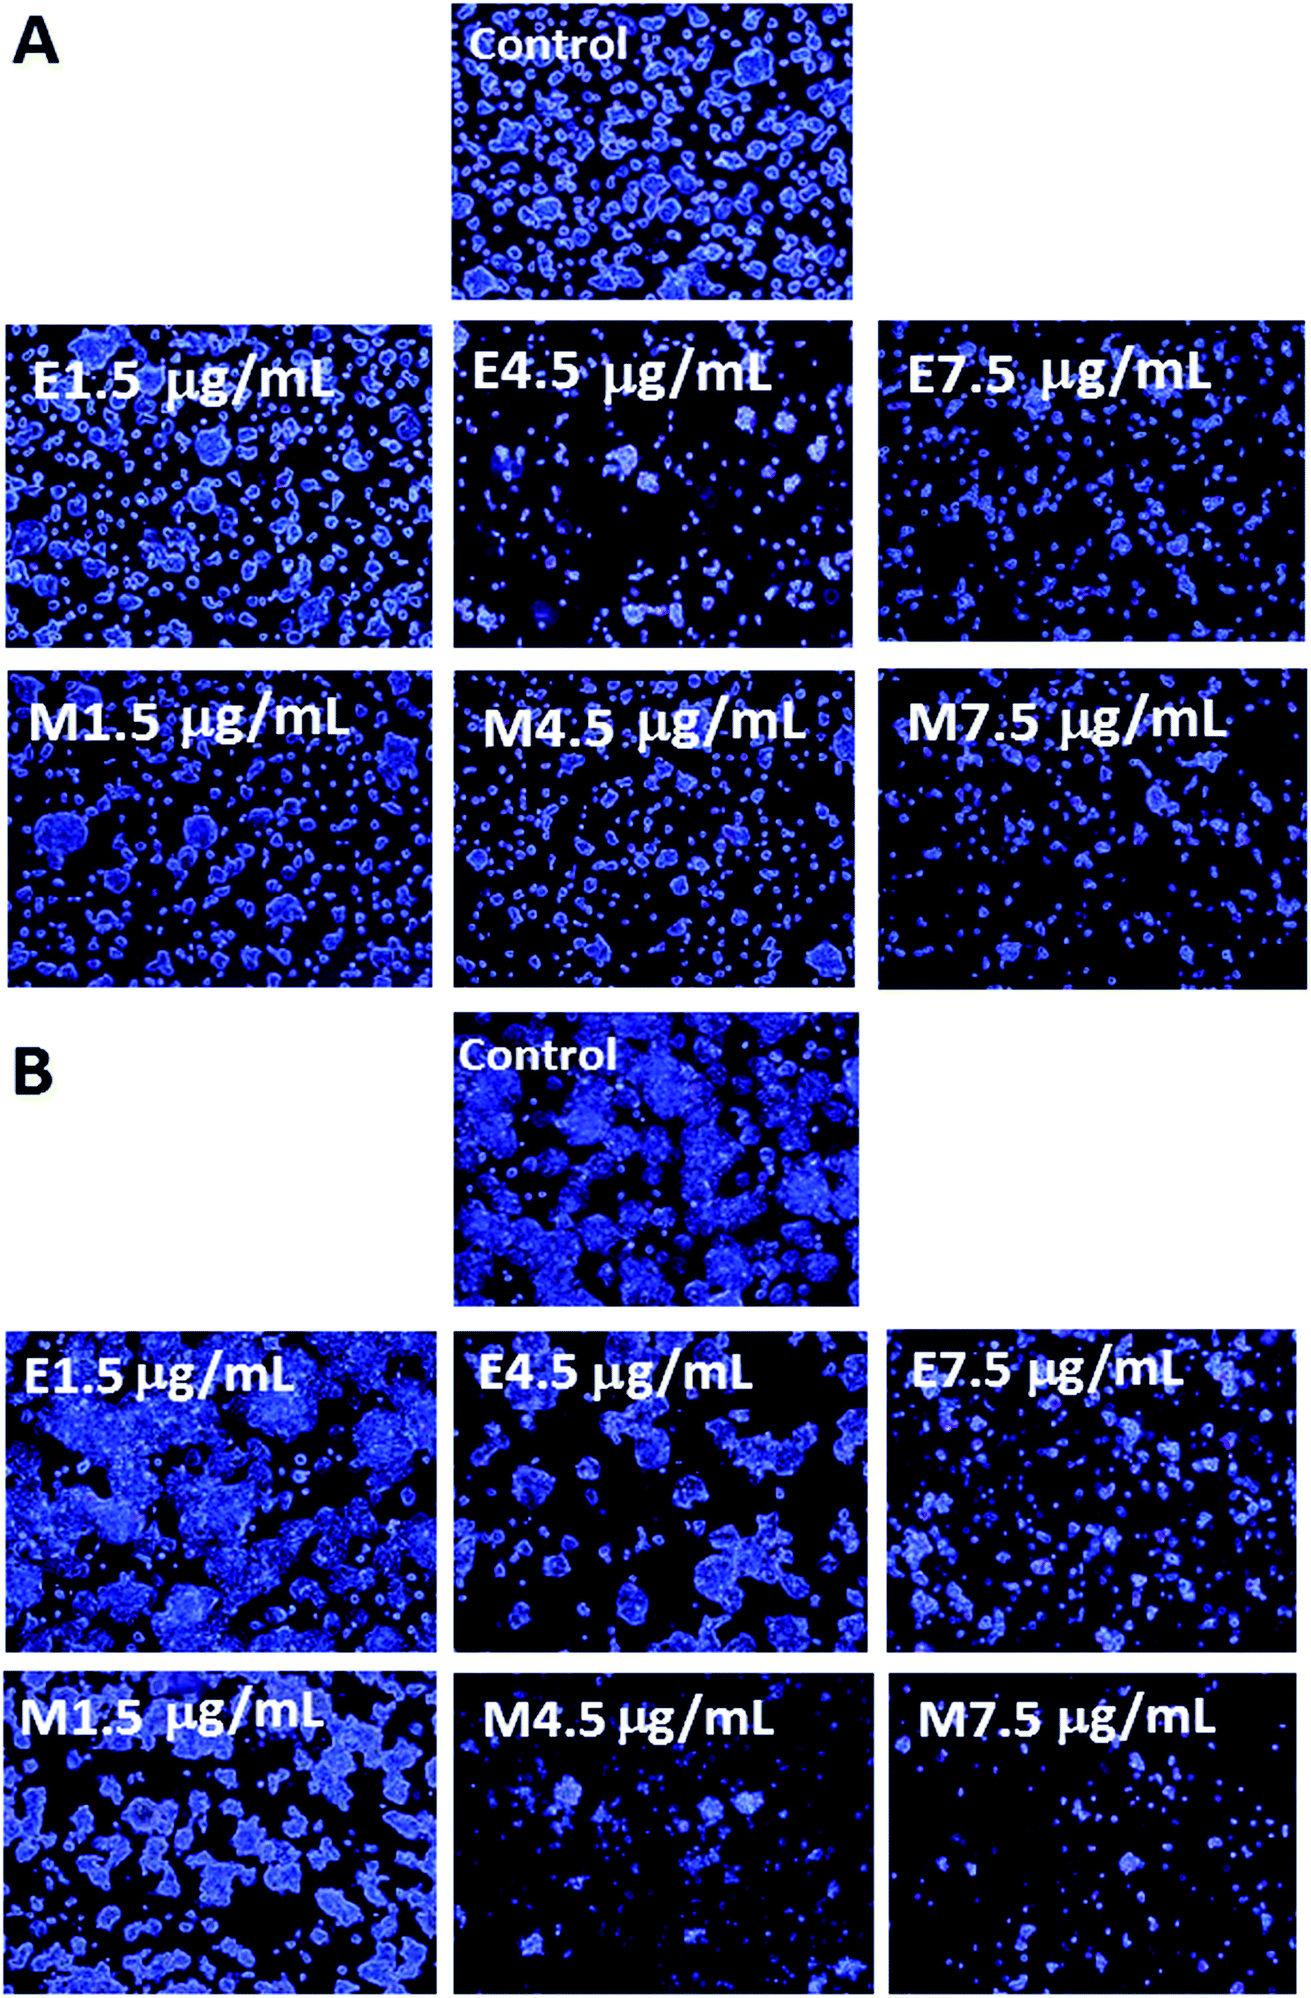 | ||
| Fig. 5 Morphological change of colon cancer cell HT-29 treated with different concentrations of curcuminoid extract and microemulsion for 24 h (A) and 48 h (B). E, curcuminoid extract. M, curcuminoid microemulsion. | ||
3.6. Cell cycle analysis
Table 2 shows the effect of various doses of curcuminoid extract and nanoemulsion on HT-29 cell cycle phase distribution. A dose-dependent rise in sub-G1 proportion was shown for both curcuminoid extract and microemulsion treatments after 48 h incubation. By comparison at the same dose (4.5 and 6 μg mL−1), curcuminoid microemulsion showed a higher sub-G1 proportion than curcuminoid extract, implying that the former could lead to a higher cell population undergoing apoptosis. However, a reversed trend was observed for the proportion of G0/G1, as shown by a dose-dependent decline for both curcuminoid extract and microemulsion treatments. Also, compared to curcuminoid extract at the same dose (3, 4.5 and 6 μg mL−1), a significantly lower (p < 0.05) G0/G1 proportion was shown for curcuminoid microemulsion. Interestingly, there was no significant difference (p > 0.05) in S proportion following the curcuminoid extract treatment at 3 doses. Conversely, a dose-dependent decrease in S proportion was shown for the curcuminoid microemulsion treatment. Interestingly, no significant difference (p > 0.05) in G2/M proportion was found for both curcuminoid extract and microemulsion treatments. Collectively, all the data suggested that both curcuminoid extract and microemulsion could induce HT-29 cell cycle arrest at S phase. However, this finding is different from that in some other studies by Hanif et al.40 and Van Erk et al.,41 reporting that the HT-29 cell cycle was arrested at G2/M phase after treatment with curcumin (25 μm). The difference in cell cycle arrest at a certain phase may be dependent upon curcuminoid variety and amount, method of curcuminoid preparation, type of cancer cells and length of incubation time.| Concentration (μg mL−1) | sub-G1 (%) | G0/G1 (%) | S (%) | G2/M (%) |
|---|---|---|---|---|
| a Data shown are mean ± standard deviation (n = 3). Data with different letters in the same column are significantly different at p < 0.05. | ||||
| Control | 6.72 ± 0.79e | 55.91 ± 1.14a | 16.93 ± 0.54c | 21.26 ± 1.75a |
|
||||
| Extract | ||||
| 3 | 15.09 ± 1.08d | 41.14 ± 1.07b | 23.68 ± 0.54b | 20.71 ± 2.6a |
| 4.5 | 30.86 ± 2.76c | 26.33 ± 1.60d | 23.65 ± 3.06b | 20.25 ± 1.65a |
| 6 | 36.89 ± 2.57b | 24.71 ± 1.25d | 20.32 ± 2.06b,c | 18.64 ± 0.06a |
|
||||
| Microemulsion | ||||
| 3 | 9.65 ± 1.37e | 37.39 ± 2.79c | 33.86 ± 3.49a | 20.17 ± 2.1a |
| 4.5 | 38.65 ± 0.79b | 18.76 ± 1.74e | 24.02 ± 0.69b | 19.25 ± 0.93a |
| 6 | 45.16 ± 2.73a | 13.34 ± 1.12f | 22.43 ± 2.91b | 20.97 ± 2.80a |
3.7. Cell apoptosis analysis
The effect of curcuminoid extract and microemulsion on apoptosis of colon cancer cells HT-29 is shown in Table 3. Both viable and necrotic cells showed a dose-dependent decrease, while both early apoptosis and late apoptosis cells followed a dose-dependent increase for both curcuminoid extract and microemulsion treatments after 48 h incubation. By comparison at the same dose, curcuminoid microemulsion could lead to a larger population of necrotic cells than curcuminoid extract. However, a different trend was found for both early apoptosis and late apoptosis cells. No significant difference (p > 0.05) was observed in proportion of late apoptosis cells between curcuminoid extract and microemulsion treatments. However, for the early apoptosis cells, a significantly higher proportion (p < 0.05) was shown for curcuminoid extract at 3 and 4.5 μg mL−1, but a lower proportion (p < 0.05) at 6 μg mL−1. Compared to many published reports, our study demonstrated that both curcuminoid extract and microemulsion could lead to a larger population of HT-29 cells undergoing early and late apoptosis, probably driven by the synergistic effect of curcumin, DMC and BDMC.| Concentration (μg mL−1) | Necrotic cells (Q1) (%) | Late apoptosis cells (Q2) (%) | Viable cells (Q3) (%) | Early apoptosis cells (Q4) (%) |
|---|---|---|---|---|
| a Data shown are mean ± standard deviation (n = 3). Data with different letters in the same column are significantly different at p < 0.05. | ||||
| Control | 32.45 ± 0.41a | 10.02 ± 0.96e | 54.37 ± 0.96a | 4.16 ± 0.23e |
|
||||
| Extract | ||||
| 3 | 9.73 ± 1.31c | 21.04 ± 2.78d | 29.34 ± 4.93c | 39.89 ± 2.29c |
| 4.5 | 4.91 ± 0.52d | 39.08 ± 1.81c | 12.22 ± 1.85d,e | 43.77 ± 0.7b |
| 6 | 0.34 ± 0.04g | 46.27 ± 1.84a | 8.10 ± 1.13e,f | 45.29 ± 1.15b |
|
||||
| Microemulsion | ||||
| 3 | 23.48 ± 0.19b | 19.35 ± 3.22d | 38.12 ± 4.19b | 19.25 ± 1.16d |
| 4.5 | 8.49 ± 0.49e | 39.82 ± 1.9b,c | 13.44 ± 1.27d | 38.25 ± 1.67c |
| 6 | 1.49 ± 0.27f | 42.93 ± 0.47a,b | 6.05 ± 0.77f | 49.52±1a |
In several similar reports Patel et al.42 pointed out that the proportion of both colon cancer cells HCT-116 and HT-29 undergoing apoptosis could rise by 4- and 2.5-fold, respectively, when treated with 10 μM curcumin for 48 h. Similarly, more than 20% of HCT-116 cell apoptosis occurred after curcumin (35 μM) treatment for 18 h. Cao et al.43 further reported that following treatment of HT-29 cells with curcumin (40 μM) for 24 h, the proportion of early and late apoptosis cells could increase by 20.07% and 20.79%, respectively. Similar findings were also observed for some other types of cancer cells such as prostate cancer cells PC-3,44 melanoma cells (A375, MV3 and M14),10 and pancreatic cancer cells PANC-1.45
3.8. Protein expression associated with cell cycle and apoptosis
The expression of proteins associated with cell cycle and apoptosis including p53 (A), p21 (B), cyclin A (C), CDK2 (D), Bax (E) and cytochrome C (F) is shown in Fig. 6. Accordingly, p53, a protein for tumor inhibition, can conjugate with damaged DNA for induction of the downstream protein p21 expression, a protein for inhibition of CDK activity (CDKI) at G1/S phase for cell cycle arrest. A dose-dependent rise in p53 expression was shown for both curcuminoid extract and microemulsion treatments (Fig. 6A). However, by comparison at the same dose (4.5 and 6 μg mL−1), a higher p53 expression was found for the curcuminoid extract than for the curcuminoid microemulsion. Interestingly, there was no significant difference (p > 0.05) in p21 expression between control and both curcuminoid extract and microemulsion treatments, as well as between both treatments at the same dose (Fig. 6B). It may be postulated that the regulation of p21 expression is independent of p53 expression.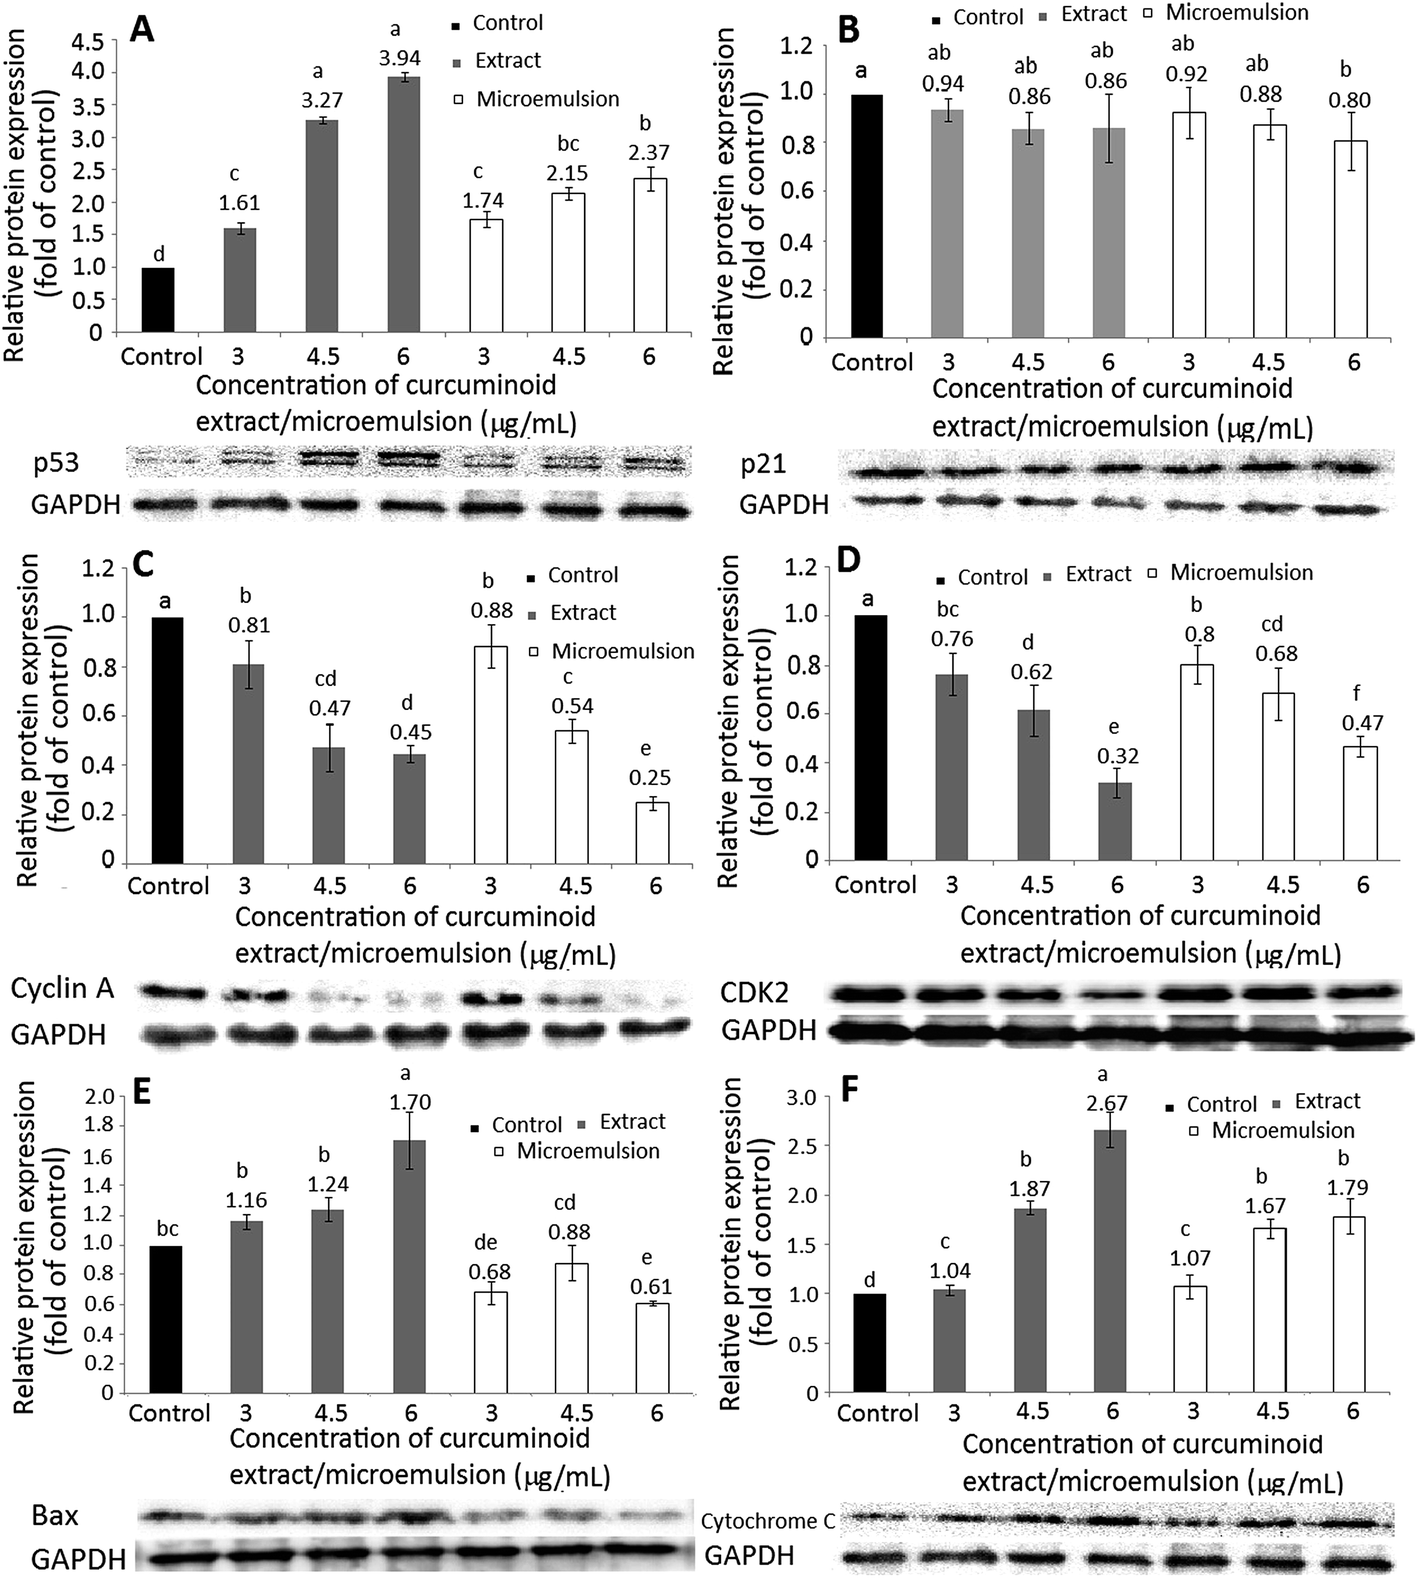 | ||
| Fig. 6 Effect of curcuminoid extract and microemulsion on p53 (A), p21 (B), cyclin A (C), CDK2 (D), Bax (E) and cytochrome C (F) expression of colon cancer HT-29. Data are represented as mean ± standard deviation (n = 3) with different letters indicating significantly different cell viability at p < 0.05. | ||
As mentioned before, the cell cycle of HT-29 cells was arrested at S phase. At S phase, the cyclin A expression can be elevated instead of the cyclin E for conjugation with CDK2. Thus, both cyclin A and CDK2 expressions need to be further investigated. Both cyclin A and CDK2 expressions followed a dose-dependent decrease for both curcuminoid extract and microemulsion treatments (Fig. 6C and D). However, by comparison at the same dose, there was no significant difference (p > 0.05) in cyclin A expression between both treatments at 3 and 4.5 μg mL−1, while a significantly higher (p < 0.05) cyclin A expression was found for the curcuminoid extract at 6 μg mL−1. Similarly, no significant difference (p > 0.05) in CDK2 expression was observed between both treatments at 3 and 4.5 μg mL−1. Interestingly, a significantly lower (p < 0.05) CDK2 expression was shown for the curcuminoid extract at 6 μg mL−1. Taken together, the microemulsion showed a lower cyclin A expression and higher CDK2 expression than the extract.
Bax, a pro-apoptotic protein belonging to the BCL-2 family, has been demonstrated to be capable of promoting cytochrome C release from mitochondria for caspase activation for apoptosis execution. With the exception of the curcuminoid microemulsion at 6 μg mL−1, a dose-dependent rise in Bax expression was shown for both extract and microemulsion treatments (Fig. 6E). However, there was no significant difference (p > 0.05) in Bax expression between 3 and 6 μg mL−1 of the microemulsion. By comparison at the same dose, a significantly lower (p < 0.05) Bax expression was observed for the microemulsion than for the extract, probably caused by a lower proportion of HT-29 cells undergoing apoptosis for the former treatment. Likewise, a dose-dependent increase in cytochrome C expression was shown for both curcuminoid extract and microemulsion treatments (Fig. 6F). By comparison at the same dose (3 and 4.5 μg mL−1), there was no significant difference (p > 0.05) in cytochrome C expression between both treatments. However, at 6 μg mL−1, a significantly higher (p < 0.05) cytochrome C expression for the extract treatment was found, implying that the extract was more efficient in raising cytochrome C expression than the microemulsion.
In several previous studies Song et al.38 reported that both p53 and Bax expressions in HT-29 cells followed a time-dependent rise when treated with curcumin (50 μM) for 1–24 h, while the anti-apoptotic protein BCL-2 followed a time-dependent decrease. In a later study Wang et al.46 also reported that the Bax mRNA expression in HT-29 cells remained unaffected when treated with 10 and 20 μM of curcumin. However, the Bax mRNA expression became significant (p < 0.05) following a rise in curcumin dose to 40–80 μM. For some other types of cancer cells, a time-dependent rise in Bax expression in breast cancer cells MCF-7 was shown following treatment with curcumin (10 μM) for 4–24 h. However, after prolonged incubation (24–48 h), the Bax expression followed a declined trend.47 Likewise, Wu et al.39 also observed a time-dependent decline in Bax expression in lung cancer cells NCI-H460, accompanied by a decrease in expressions of cyclin D and E as well as CDK1, 2, 4 and 6, leading to cell cycle arrest at G2/M and apoptosis. In a study dealing with the effect of curcumin (5–12.5 μM) on bladder cancer cells T24, the cell cycle was arrested at G2/M and no significant difference (p > 0.05) in p53 mRNA expression was shown after 48 h incubation.48 However, the p21 mRNA expression followed a dose-dependent rise, and a reversed trend was observed for the cyclin A mRNA expression.48 This outcome revealed that the cancer cell growth may be regulated through p53-independent pathway in the presence of curcumin. Also, both dose and incubation time are vital factors in evaluating the inhibition efficiency of curcumin towards cancer cells.
In addition to Bax, both caspase-8 and caspase-9 are responsible for initiation of apoptosis, while caspase-3 responsible for execution of apoptosis. With the exception of the microemulsion at 6 μg mL−1, a dose-dependent rise in activities of caspase-3, caspase-8 and caspase-9 was found for both curcuminoid extract and microemulsion treatments (Fig. 7). By comparison at the same dose, a significantly higher (p < 0.05) caspase-8 activity was shown for the extract than for the microemulsion (Fig. 7A). However, the extract only showed a higher caspase-9 activity than the microemulsion at 3 μg mL−1, as no significant difference (p > 0.05) was observed between 4.5 and 6 μg mL−1 (Fig. 7B). For the caspase-3 activity, the same trend was shown as the caspase-8 activity (Fig. 7C). All the data suggested that both curcuminoid extract and microemulsion were effective in inducing HT-29 cell apoptosis, with the former being more efficient than the latter.
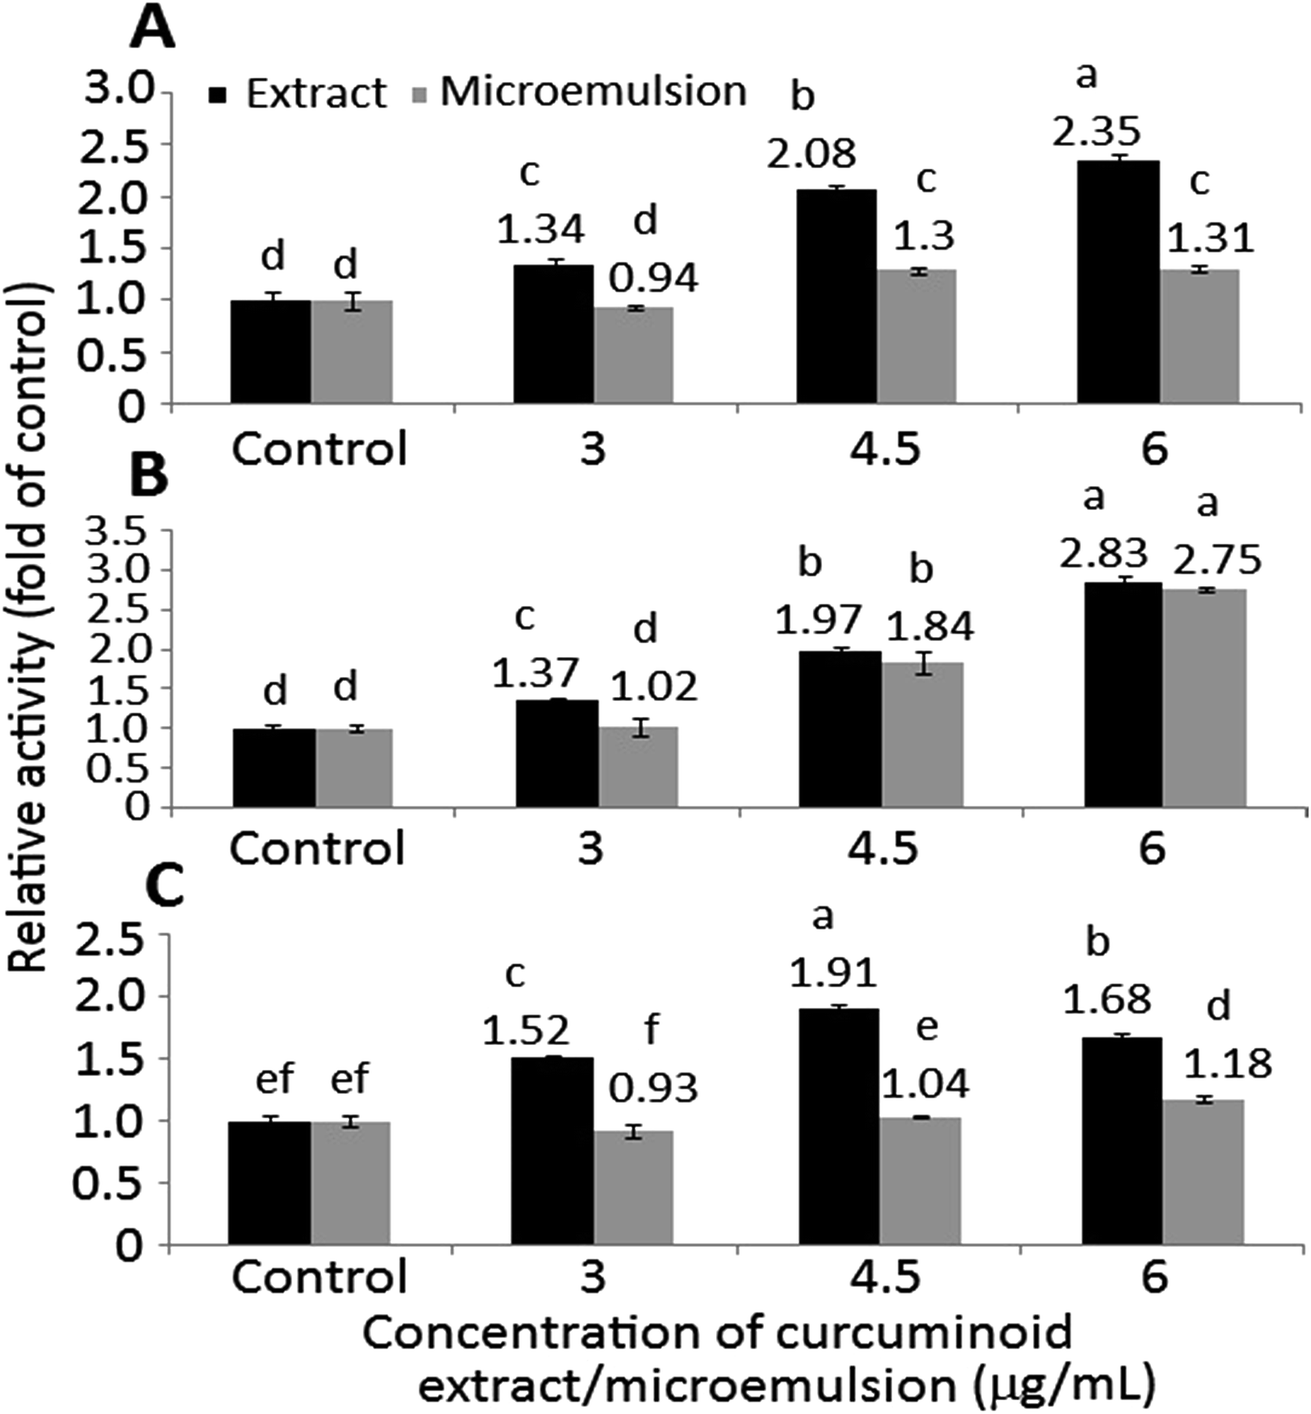 | ||
| Fig. 7 Effect of curcuminoid extract and microemulsion on caspase 8 (A), caspase 9 (B) and caspase 3 (C) activity of colon cancer cell HT-29. Data are represented as mean ± standard deviation (n = 3) with different letters indicating significantly different cell viability at p < 0.05. | ||
In the literature reports Wang et al.46 found a dose-dependent increase in expressions of both cytochrome C and caspase-3 after treatment of HT-29 cells with curcumin (10–80 μM) for 12 h and 24 h. Similarly, both caspase-3 and caspase-9 activities were shown to increase by 3-fold following treatment of colon cancer cells LoVo with curcumin (2.5–30 μg mL−1) for 24 h.49 The same result was shown for colon cancer cells SW480 and SW620 when treated with curcumin (50 μM) for 8 h.50 Collectively, both curcuminoid extract and microemulsion can elevate p53 expression and decrease both cyclin A and CDK2 expressions through p21-independent pathway for cell cycle arrest at S phase (Fig. 8). In addition, both curcuminoid extract and microemulsion could enhance cytochrome C expression for release from mitochondria to increase activities of caspase-8, caspase-9 and caspase-3, leading to HT-29 cell apoptosis (Fig. 8). However, the Bax expression was enhanced for the curcuminoid extract, but not for the curcuminoid microemulsion, which may be accounted for by a lower proportion of HT-29 cells undergoing apoptosis as well as long incubation time (48 h).
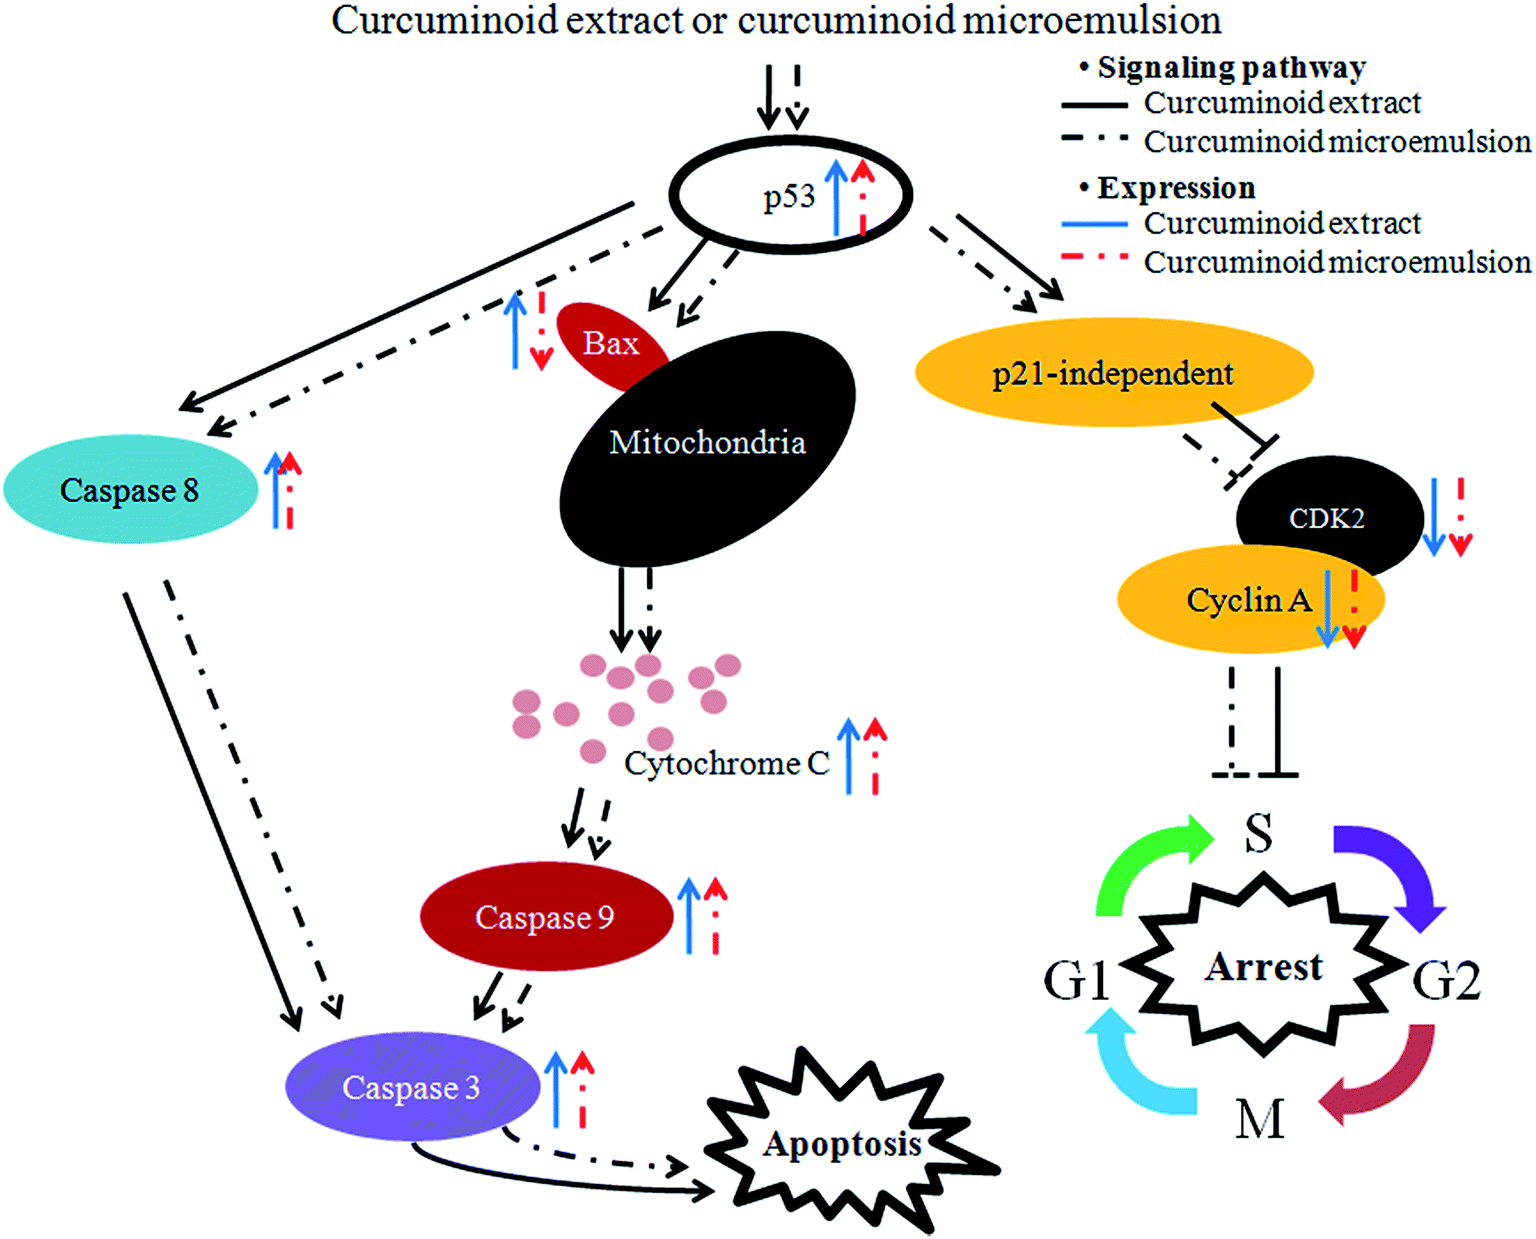 | ||
| Fig. 8 Hypothesized signaling pathway of curcuminoid extract and microemulsion induced cell cycle arrest and apoptosis of colon cancer cell HT-29. | ||
3.9. Potential benefits of microemulsion as a delivery vehicle for curcuminoids
Despite the wide-spectrum biological and pharmacological activities of curcuminoids from C. longa, an extremely low water solubility (11 ng mL−1 in pH 5.0 buffer),51 fast metabolism, rapid systemic elimination and poor oral bioavailability (1% in rats)52 limits their application although considered safe even at high doses (12 g per day) in humans.51–53 In addition, curcumin is highly unstable at neutral and basic pH values, degrading into vanillin, ferulic acid and trans-6-(40-hydroxy-30-methoxy-phenyl)-2,4-dioxo-5-hexenal.54 Among various approaches to enhance curcuminoids stability and bioavailability, the microemulsion technique has gained popularity over the past decade due to formation of transparent and thermodynamically stable colloids through encapsulation of unstable bioactive compounds.55 Microemulsions are defined as an optically isotropic colloidal system composed of oil, surfactant, cosurfactant and water.56 Several studies have shown a substantial improvement in bioavailability of poorly water-soluble botanic drugs. For instance, Hu et al.57 demonstrated curcumin microemulsion could significantly increase pharmacokinetic parameters such as Cmax (maximum concentration in plasma) and AUC (area under the curve) with the relative bioavailability of curcumin in microemulsion being 22.6-fold higher than that in suspension. Likewise, the incorporation of curcumin into a microemulsion system could greatly enhance the in vivo absorption and facilitate its delivery into brain with the absolute bioavailability being 55.82% upon intranasal administration.58 More recently, Lu et al.59 have shown an increase in Tmax (time to attain maximum concentration in plasma), t1/2 (half-life), Cmax and AUC upon oral administration of curcuminoids microemulsion compared to suspension resulting in 5 to 7-fold rise in absolute bioavailability of curcuminoids in rats. Accordingly, in this study, we extracted curcuminoids from C. longa and incorporated into a microemulsion system consisting of soybean oil (1%), ethanol (3%), Tween 80 (14%) and water (14%), demonstrating the potential application of microemulsion as an efficient delivery vehicle for curcuminoids towards colon cancer treatment. Microemulsions being a drug delivery system can be prepared easily to possess the following advantages: a thermodynamically stable self-emulsifying system, low viscosity compared to primary and multiple emulsions, the original stability can still be maintained following a change in temperature, enhancement of the solubility of both hydrophilic and lipophilic drugs, protection of the drug in different biological environments, prevention of degradation in stomach and intestine, elevation of bioavailability with longer half-life in vivo, improvement of biological transport due to high surface area, and reduction of administration dose to minimize side effects and increase therapeutic efficiency.55,56 All in all, microemulsion can be a promising technique used as a botanic drug for enhancing therapeutic efficiency of curcuminoids for possible future treatment of several human diseases including colon cancer. Furthermore, this technique can be employed to enhance bioavailability of curcuminoids in both functional foods and nutraceutical formulations.4. Conclusions
Curcuminoids were extracted from C. longa and curcuminoid microemulsion was successfully prepared for enhancing the inhibition effects on growth of colon cancer cells HT-29. Both curcuminoid extract and microemulsion were effective in inhibiting colon cancer cells HT-29 growth through elevation of p53 expression and p21-independent route, inhibition of both cyclin A and CDK2 expressions for cell cycle arrest at S phase, and increase of cytochrome C expression as well as activities of caspase-8, caspase-9 and caspase-3. However, a decline in Bax expression was shown for curcuminoid microemulsion. Taken together, the curcuminoid microemulsion prepared in this study may be used for treatment of colon cancer.Conflicts of interest
The authors have no conflict of interest to declare.Acknowledgements
This study was supported by a grant from the Ministry of Science and Technology, Taipei, Taiwan (contract no.: 102-2313-B-030-003-MY3). The authors wish to thank Mr Yen-Sheng Wu from Tzong Jao Hang's Electron Microscope Laboratory, School of Medicine, Fu Jen Catholic University, Taipei, Taiwan, for technical assistance in recording the TEM image.References
- S. Prasad, S. C. Gupta, A. K. Tyagi and B. B. Aggarwal, Biotechnol. Adv., 2014, 32, 1053–1064 CrossRef CAS PubMed.
- H. B. Chang and B. H. Chen, Int. J. Nanomed., 2015, 10, 5059–5080 CAS.
- C. R. Ireson, D. J. L. Jones, S. Orr, M. W. H. Coughtrie, D. J. Boocock, M. L. Williams, P. B. Farmer, W. P. Steward and A. J. Gescher, Cancer Epidemiol., Biomarkers Prev., 2002, 11, 105–111 CAS.
- Y. J. Chen, B. S. Inbaraj, Y. S. Pu and B. H. Chen, Nanotechnology, 2014, 25, 155102 CrossRef PubMed.
- D. J. McClements and H. Xiao, Food Funct., 2012, 3, 202–220 CAS.
- Ministry of Health and Welfare, Statistics of Cause of Death, Taipei, Taiwan, 2015 Search PubMed.
- J. J. Johnson and H. Mukhtar, Cancer Lett., 2007, 255, 170–181 CrossRef CAS PubMed.
- T. Ak and I. Gulcin, Chem.-Biol. Interact., 2008, 174, 27–37 CrossRef CAS PubMed.
- K. M. Kim, H. O. Pae, M. Zhung, H. Y. Ha, Y. A. Ha, K. Y. Chai, Y. K. Cheong, J. M. Kim and H. T. Chung, Biomed. Pharmacother., 2008, 62, 630–636 CrossRef CAS PubMed.
- A. J. Jiang, G. Jiang, L. T. Li and J. N. Zheng, Mol. Biol. Rep., 2015, 42, 267–275 CrossRef CAS PubMed.
- G. G. L. Yue, B. C. L. Chan, P. M. Hon, M. Y. H. Lee, K. P. Fun, P. C. Leung and C. B. Lau, Food Chem. Toxicol., 2010, 48, 2011–2020 CrossRef CAS PubMed.
- D. Wang, M. S. Veena, K. Stevenson, C. Tang, B. Ho, J. D. Suh, V. M. Duarte, K. F. Faull, K. Mehta, E. S. Srivastan and M. B. Wang, Clin. Cancer Res., 2008, 14, 6228–6236 CrossRef CAS PubMed.
- M. M. Yallapu, S. Khan, D. M. Maher, M. C. Ebeling, V. Sundram, N. Chauhan, A. Ganju, S. Balakrishna, B. K. Gupta, N. Zafar, M. Jaggi and S. C. Chauhan, Biomaterials, 2014, 35, 8635–8648 CrossRef CAS PubMed.
- R. Chang, L. Sun and T. J. Webster, Int. J. Nanomed., 2014, 9, 461–465 Search PubMed.
- M. Mahmud, A. Piwoni, N. Filiczak, M. Janicka and J. Gubernator, PLoS One, 2016, 11, e0167787 Search PubMed.
- F. Wang, J. Chen, W. Dai, Z. He, D. Zhai and W. Chen, Acta Pharm., 2017, 67, 357–371 CrossRef CAS PubMed.
- M. Lopez-Lazaro, Mol. Nutr. Food Res., 2008, 52, S103–S127 Search PubMed.
- D. K. Agrawal and P. Kumar, Med. Res. Rev., 2010, 30, 818–860 CAS.
- A. Allegra, V. Innao, S. Russo, D. Gerace, A. Alonci and C. Musolino, Cancer Invest., 2017, 35, 1–22 CrossRef CAS PubMed.
- S. Bisht, G. Feldmann, S. Soni, R. Ravi, C. Karikar and A. Maitra, J. Nanobiotechnol., 2007, 5, 3 CrossRef PubMed.
- Statistical Analysis System, SAS Procedures and SAS/Graph User's Guide, Version 6, SAS Institute Inc., Cary, NC, 2014 Search PubMed.
- A. Karioti, E. Fani, F. F. Vincieri and A. R. Bilia, J. Pharm. Biomed. Anal., 2011, 55, 479–489 CrossRef CAS PubMed.
- K. Inoue, S. Hamasaki, Y. Yoshimura, M. Yamada, M. Nakamura, Y. Ito and H. Nakazawa, J. Liq. Chromatogr. Relat. Technol., 2003, 26, 53–62 CrossRef CAS.
- K. Ashraf, M. Mujeeb, N. Ahmad and M. Amir, J. Chromatogr. A, 2014, 53, 1346–1352 Search PubMed.
- R. Li, C. Xiang, M. Ye, H. F. Li, X. Zhang and D. A. Guo, Food Chem., 2011, 126, 1890–1895 CrossRef CAS PubMed.
- P. Lakshmi and G. A. Kumar, Int. J. Pharm. Pharm. Sci., 2010, 2, 35–40 Search PubMed.
- S. Anuchapreeda, Y. Fukumori, S. Okonogi and H. Ichikawa, J. Nanotechnol., 2012, 2012, 270383 Search PubMed.
- K. Ahmed, Y. Li, D. J. McClements and H. Xiao, Food Chem., 2012, 132, 799–807 CrossRef CAS.
- Y. Xiao, X. Chen, L. Yang, X. Zhu, L. Zou, F. Meng and Q. Ping, J. Agric. Food Chem., 2013, 61, 3654–3660 CrossRef CAS PubMed.
- M. C. Bergonzi, R. Hamdouch, F. Mazzacuva, B. Isacchi and A. R. Bilia, LWT--Food Sci. Technol., 2014, 59, 148–155 CrossRef CAS.
- T. P. Sari, B. Mann, R. Kumar, R. R. B. Singh, R. Sharma, M. Bhardwaj and S. Athira, Food Hydrocolloids, 2014, 43, 540–546 CrossRef.
- C. C. Lin, H. Y. Lin, M. H. Chi, C. M. Shen, H. W. Chen, W. J. Yang and M. H. Lee, Food Chem., 2014, 154, 282–290 CrossRef CAS PubMed.
- G. P. Collett and F. C. Campbell, Carcinogenesis, 2004, 25, 2183–2189 CrossRef CAS PubMed.
- C. C. Su, J. S. Yang, C. C. Lu, J. H. Chiang, C. L. Wu, J. J. Lin, K. C. Lai, T. C. Hsia, H. F. Lu, M. J. Fan and J. G. Chung, Phytother. Res., 2010, 24, 189–192 CAS.
- S. K. Sandur, A. Deorukhkar, M. K. Pandey, A. M. Pabon, S. Shentu, S. Guha, B. B. Aggarwal and S. Krishnan, Int. J. Radiat. Oncol., Biol., Phys., 2009, 75, 534–542 CrossRef CAS PubMed.
- N. P. Aditya, M. Shim, I. Lee, Y. J. Lee, M. H. Im and S. Ko, J. Agric. Food Chem., 2013, 61, 1878–1883 CrossRef CAS PubMed.
- S. Ganta and M. Amiji, Mol. Pharmaceutics, 2009, 6, 928–939 CrossRef CAS PubMed.
- G. Song, Y. B. Mao, Q. F. Cai, L. M. Yao, G. L. Ouyang and S. D. Bao, Braz. J. Med. Biol. Res., 2005, 38, 1791–1798 CrossRef CAS PubMed.
- S. H. Wu, L. W. Hang, J. S. Yang, H. Y. Chen, H. Y. Lin, J. H. Chiang, C. C. Lu, J. L. Yang, T. Y. Lai, Y. C. Ko and J. G. Chung, Anticancer Res., 2010, 30, 2125–2134 CAS.
- R. Hanif, L. Qiao, S. J. Shiff and B. Rigas, J. Lab. Clin. Med., 1997, 130, 576–584 CrossRef CAS PubMed.
- M. J. Van Erk, E. Teuling, Y. C. M. Staal, S. Huybers, P. J. Van Bladeren, J. M. M. J. G. Aarts and B. Van Ommen, J. Carcinog., 2004, 3, 8 CrossRef PubMed.
- B. B. Patel, R. Sengupta, S. Qazi, H. Vachhani, Y. Yu, A. K. Rishi and A. P. N. Majumdar, Int. J. Cancer, 2008, 122, 267–273 CrossRef CAS PubMed.
- A. Cao, Q. Li, P. Yin, Y. Dong, H. Shi, L. Wang, G. Ji, J. Xie and D. Wu, Apoptosis, 2013, 18, 1391–1402 CrossRef CAS PubMed.
- X. Ni, A. Zhang, Z. Zhao, Y. Shen and S. Wang, Oncol. Rep., 2012, 28, 85–90 CrossRef CAS PubMed.
- C. Mohanty and S. K. Sahoo, Biomaterials, 2010, 31, 6597–6661 CrossRef CAS PubMed.
- J. B. Wang, L. L. Qi, S. D. Zheng, H. Z. Wang and T. X. Wu, World J. Gastroenterol., 2009, 1, 1346–1352 CrossRef.
- T. Choudhuri, S. Pal, M. L. Agarwal, T. Das and G. Sa, FEBS Lett., 2002, 512, 334–340 CrossRef CAS PubMed.
- C. Park, G. Y. Kim, G. D. Kim, B. T. Choi, Y. M. Park and Y. H. Choi, Oncol. Rep., 2006, 15, 1225–1231 CAS.
- L. D. Guo, X. J. Chen, Y. H. Hu, Z. J. Yu, D. Wang and J. Z. Liu, Phytother. Res., 2013, 27, 422–430 CrossRef CAS PubMed.
- R. Rashmi, T. R. Santhosh Kumar and D. Karunagaran, FEBS Lett., 2003, 538, 19–24 CrossRef CAS PubMed.
- H. H. Tonnesen, M. Masson and T. Loftsson, Int. J. Pharm., 2002, 244, 127–135 CrossRef CAS PubMed.
- K. Y. Yang, L. C. Lin, T. Y. Tseng, S. C. Wang and T. H. Tsai, J. Chromatogr. B: Anal. Technol. Biomed. Life Sci., 2007, 853, 183–189 CrossRef CAS PubMed.
- P. Anand, A. B. Kunnumakkara, R. A. Newman and B. B. Aggarwal, Mol. Pharm., 2007, 4, 807–818 CrossRef CAS PubMed.
- M. T. Huang, Y. R. Lou, W. Ma, H. L. Newmark, K. R. Reuhl and A. H. Conney, Cancer Res., 1994, 54, 5841–5847 CAS.
- F. Muzaffar, U. K. Singh and L. Chauhan, Int. J. Pharm. Pharm. Sci., 2013, 5, 39–53 CAS.
- S. Tenjarla, Crit. Rev. Ther. Drug Carrier Syst., 1999, 16, 461–521 CrossRef CAS PubMed.
- L. Hu, Y. Jia, F. Niu, Z. Jia, X. Yang and K. Jiao, J. Agric. Food Chem., 2012, 60, 7137–7141 CrossRef CAS PubMed.
- S. Wang, P. Chen, L. Zhang, C. Yang and G. Zhai, J. Drug Targeting, 2012, 20, 831–840 CrossRef CAS PubMed.
- P. S. Lu, B. S. Inbaraj and B. H. Chen, J. Sci. Food Agric., 2018, 98, 51–63 CrossRef CAS PubMed.
| This journal is © The Royal Society of Chemistry 2018 |