
 Open Access Article
 This Open Access Article is licensed under a Creative Commons Attribution-Non Commercial 3.0 Unported Licence
Evaluation of a combined emulsion process to encapsulate methylene blue into PLGA nanoparticles
Cindy Alejandra Gutiérrez-Valenzuelaa,
Reynaldo Esquivelb,
Patricia Guerrero-Germán c,
Paul Zavala-Riverac,
José Carlos Rodríguez-Figueroac,
Roberto Guzmán-Zd and
Armando Lucero-Acuña*c
c,
Paul Zavala-Riverac,
José Carlos Rodríguez-Figueroac,
Roberto Guzmán-Zd and
Armando Lucero-Acuña*c
aNanotechnology Graduate Program, Department of Physics, University of Sonora, Hermosillo, Mexico
bNational Council of Science and Technology of Mexico, Ciudad de Mexico, Mexico
cDepartment of Chemical and Metallurgical Engineering, University of Sonora, Blvd. Luis Encinas y Rosales S/N, Col. Centro, Hermosillo, Sonora 83000, Mexico. E-mail: armando.lucero@unison.mx; Tel: +52-662-259-2105
dDepartment of Chemical and Environmental Engineering, University of Arizona, Tucson, USA
First published on 2nd January 2018
Abstract
The delivery of photosensitizer compounds using biodegradable nanoparticles could improve dosage, controlled release and its bioavailability. In this study, methylene blue (MB) loaded PLGA nanoparticles (MB-PNP) are prepared by a new approach combining single and double emulsification techniques. Comparisons of MB-PNP obtained with the combined and the individual techniques are presented. Nanoparticles are characterized by dynamic light scattering, laser Doppler electrophoresis and scanning electron microscopy. Particles prepared by the combined technique presented hydrodynamic diameters of 186 nm. The sizes of MB-PNP obtained from the single emulsion technique are similar to the combined technique, while the diameter of particles prepared by double emulsion increased from 201 nm to 287 nm as the TDL increased. MB-PNP displayed an average zeta potential between −21 mV and −28 mV for all formulations. MB loading ranges between 0.3–1.4%, while the encapsulation efficiency ranges from 8–14%, both depending on the TDL and the preparation technique. In vitro release studies show a monophasic release profile that was analyzed by considering the mechanisms of initial burst, drug diffusion and a combination of them. Experimental results could be better described using a mathematical model of release that simultaneously combines the mechanisms of initial burst and drug diffusion. The approach presented to encapsulate MB and also to analyze the drug release could be extended to other drugs with partial solubility.
Introduction
Drug delivery has become an ideal strategy to overcome problems associated with the degradation of drugs, dosage, targeting, among others. Drug delivery approaches have been receiving continuous efforts to develop and optimize the methods of drug entrapment. Within these approaches, nanocarriers are getting more attention due to the great potential to comply with the requirements of an ideal drug delivery system, as they may increase drug bioavailability, reduce toxicity, improve efficiency, provide controlled drug release, recognize specific tissues and protect drugs from undesirable interaction with other tissues.1–5 The materials used in the preparation of nanocarriers are polymers, inorganic materials such as ceramic based and silica-based nanostructures, metallic and magnetic nanoparticles, quantum dots and carbon materials, as well as organic materials that include liposomes, micelles, polysaccharides and dendrimers.6,7 From these materials, poly-DL-lactic-co-glycolic acid (PLGA) is extensively used in research as a nanocarrier. PLGA is a biodegradable and biocompatible poly(ester) that can be easily functionalized with different ligands prior8 and after nanoparticle preparations. PLGA degradation rates depends on its molecular weight and copolymer composition.9 PLGA is also a polymer approved by the Food and Drug Administration (FDA) for drug delivery nanosystems.3,9Several techniques for PLGA nanoparticle preparation have been reported in literature: emulsification followed by either solvent evaporation, diffusion or reverse salting-out, polymerization, nanoprecipitation, among others.10–17 Within these techniques, the most common is the emulsion process, which could be used to practically encapsulate any hydrophobic or hydrophilic component. The emulsion process could be carried out by single and double emulsion. An extensive review using the double emulsion technique by analysing the process variables like solvents, stabilizers, different polymers in the encapsulation of hydrophobic and hydrophilic drugs was reported in literature.18 However, this technique occasionally present low drug loading and encapsulation efficiency for hydrophilic compounds and could be difficult to scale up.3,16 In order to overcome the low drug loading issue, authors have proposed a wide variety of modifications to the commonly used methods, some of these modifications include: (1) adjustments on the pH of the aqueous phase with the purpose of modifying lipophilicity of the drug to encapsulate in the single or double emulsification method;5,19 (2) variations on temperature while encapsulating iron oxide nanoparticles in PLGA in a double emulsion method;20 (3) the use of different surfactants such as polyvinyl alcohol (PVA), human serum albumin (HSA),21 or Pluronic F-108 when a solvent displacement method is used;22 (4) addition of excipients such as poly(DL-lactide) oligomers or fatty acids into the formulation23 or stabilizer agents and cyclodextrins;24 (5) the use of cross-linkers such as anionic surfactant Aerosol (OTTM) and polysaccharide polymer alginate to improve the encapsulation efficiency and to delay the release of water soluble drugs such as methylene blue, doxorubicin, rhodamine, verapamil, and clonidine;25 among others.
Methylene blue (MB) has been of great interest in many areas of clinical medicine, from neurological disorders to cancer chemotherapy.24,26 It can be used in photodynamic therapy (PDT), which consists on the application of the photosensitizer (PS) agent in the area of interest, and then activated by light of specific wavelength producing reactive oxygen species, that leads to the death of the target cell via oxidative damage.27–30 MB has been encapsulated using phosphonate-terminated silica particles,31 silica-coated magnetic particles,32 chitosan nanoparticles,33,34 molecular imprinted polymeric nanoparticles,35 a combination of gold nanoparticles in a polystyrene-alt-maleic acid layer,36 and also in PLGA nanoparticles.24,37
Drug release from polymeric systems can be attributed to different mechanisms such as initial burst, polymer–drug and drug–drug interactions, polymer relaxation, hydrolysis, polymer erosion, drug dissolution, formation of cracks and deformation, transport through water-filled pores and transport through the polymer.38–40 In the case of MB release from PLGA nanoparticles, a zero order, first order and a Higuchi models have been used to analyse the kinetics of release.24 However, the release analysis from biodegradable nanoparticles usually involves more than one mechanism of release.41 In this regard, Batycky et al. presented a model that combines initial burst and drug diffusion, solving first for the initial burst and after an induction time they consider the drug diffusion.42 In similar way, a model that combines the mechanisms of initial burst, drug diffusion and also the degradation of PLGA has been reported, but considering that all mechanisms occur simultaneously.43
In this work, the preparation of MB-loaded PLGA nanoparticles (MB-PNP) by a combination of single and double emulsion techniques is reported. A comparison of the nanoparticles obtained with the combined and the individual techniques is presented. MB-PNP were prepared using different theoretical drug loadings (TDL) depending of the encapsulation technique to have a broad range of comparison. Nanoparticles were characterized by dynamic light scattering (DLS), laser Doppler electrophoresis and scanning electron micrographs (SEM). In vitro MB release from MB-PNP was evaluated under physiological conditions and analysed with three models of release. The first model considers the mechanism of initial burst, the second one considers the release of MB by diffusion and the third model considers a simultaneous contribution of both. Initial burst was evaluated using a first order equation and the diffusion of MB from MB-PNP was evaluated with a Fickian diffusion.
Materials and methods
Materials
PLGA acid terminated (50/50 DL-lactide/glycolide copolymer, IV midpoint 0.2 dL g−1) was received as gift sample from Corbion Purac, Gorinchem, The Netherlands. Methylene blue was obtained from Química Suastes SA de CV, Tlahuac, Estado de Mexico, Mexico. Polyvinyl alcohol (86–89% hydrolysis, low molecular weight, PVA) was obtained from Alfa Aesar, Ward Hill, Massachusetts, USA. Dichloromethane (DCM) was obtained from Fisher Scientific Inc., Fair Lawn, New Jersey, USA. Phosphate buffered saline tablets were obtained from Sigma-Aldrich, St. Louis, Missouri, USA.Preparation of MB-PNP
PLGA nanoparticles loaded with methylene blue (MB-PNP) were prepared by using a combination of the single and double emulsification techniques.44 Nanoparticles prepared by the individual techniques were used to evaluate the method. A representation of the nanoparticle preparations is presented in Fig. 1. Briefly, in the single emulsification technique, 25 mL of an aqueous solution of 5% w/v PVA are added into a 5 mL DCM solution containing 50 mg of PLGA and a specific amount of MB (depending on TDL). The mixture is emulsified during 1 min at 75% amplitude (90 μm) under an ice bath by using the equipment QSonica 500 sonicator (QSonica LLC, Newtown, Connecticut, USA). In the double emulsification technique, a specific amount of MB (depending on TDL) is dissolved in 0.5 mL of deionized water and then added into a 5 mL DCM solution containing 50 mg of PLGA. Then, the mixture is emulsified by sonication during 1 min at 22% of amplitude (26.5 μm) under an ice bath. Next, 25 mL of an aqueous solution of 5% w/v PVA are added into the mixture and a second emulsification is carried by sonication during 1 min at 75% amplitude (90 μm) under an ice bath. In the combined emulsification technique, 2 mg of MB are dissolved in 0.5 mL of deionized water and then added into a 5 mL DCM solution containing 4 mg of MB and 50 mg of PLGA. Then, the mixture is emulsified two times following the same procedure than the one for the double emulsification technique. After the emulsifications in all the preparations, the solvent is evaporated under magnetic stirring, at room temperature. Then, MB-PNP are washed by three centrifugation cycles by using a Sigma 3-30KS centrifuge (Sigma Laborzentrifugen GmbH, Osterode am Harz, Germany) operated at 37![[thin space (1/6-em)]](https://www.rsc.org/images/entities/char_2009.gif) 565× g for 20 minutes, discarding supernatant and resuspending pellet nanoparticles in deionized water. Finally, MB-PNP are freeze-dried in lyophilizer freezone 4.5 (Labconco, Kansas City, Missouri, USA). All experiments were performed by triplicate.
565× g for 20 minutes, discarding supernatant and resuspending pellet nanoparticles in deionized water. Finally, MB-PNP are freeze-dried in lyophilizer freezone 4.5 (Labconco, Kansas City, Missouri, USA). All experiments were performed by triplicate.
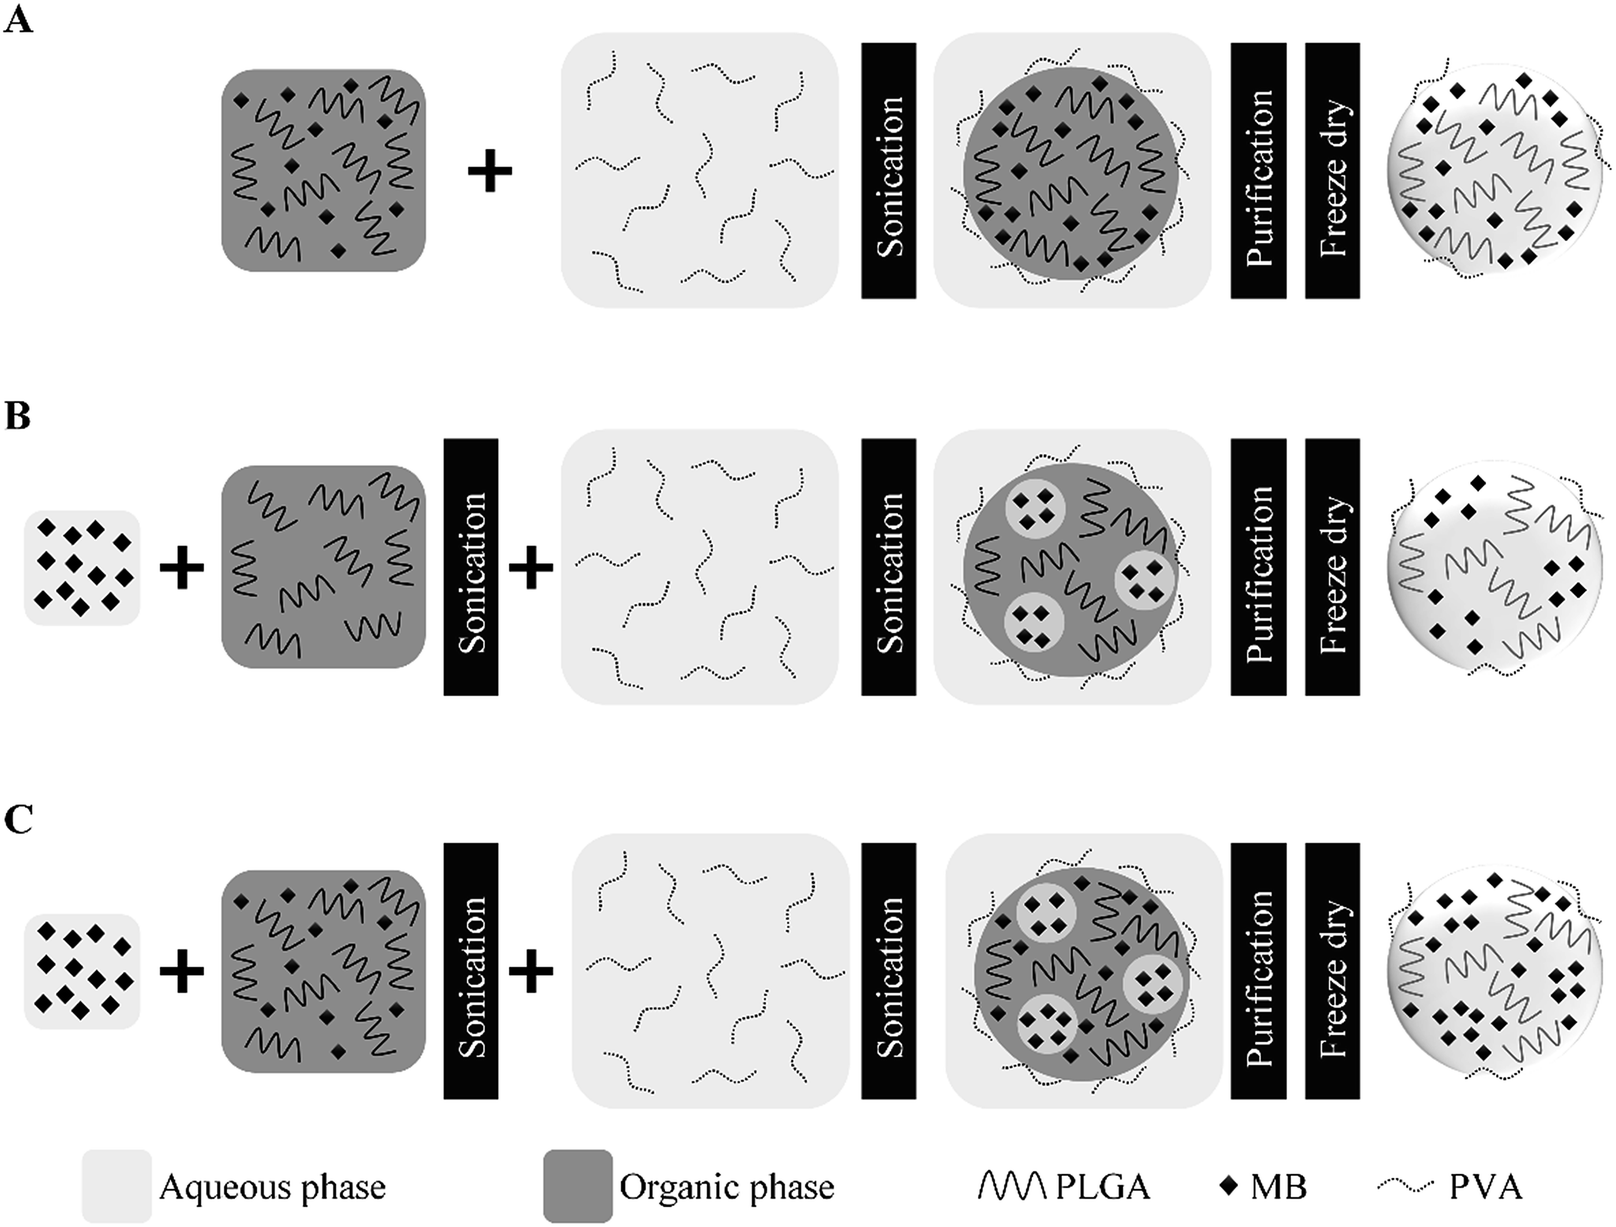 | ||
| Fig. 1 Schematic of MB loaded PLGA nanoparticle preparation. Single (A), double (B) and combined (C) emulsification techniques. | ||
Nanoparticle characterization
Nanoparticle size distribution and zeta potentials were measured using a zetasizer Nano ZS equipment (Malvern Instruments Ltd., Worcestershire, United Kingdom). Measurements of MB-PNP sizes were performed by dynamic light scattering (DLS). Each sample was measured three times with 10 runs respectively. Additionally, each sample for zeta potential was measured by duplicated with at least 10 runs at constant temperature (25 °C) by laser Doppler electrophoresis.Z-Averages and zeta potentials were obtained from three independent experiments.
MB concentrations were quantified by spectroscopy at 665 nm using a calibration curve obtained with a standard model MB solutions prepared in 10 mM phosphate buffer pH 7.4 (ε = 5.246 × 10⁴ M−1 cm−1). TDL is the ratio of initial amount of MB used in the process with respect to initial amount of polymers used in preparation. Drug loading (DL) was defined as the actual amount of MB encapsulated per mass of nanoparticles, while the encapsulation efficiency (EE) was described as percent of MB encapsulated in MB-PNP with respect to initially added amount of MB.
Surface morphology of MB-PNP was analysed by scanning electron microscopy (SEM) through the field emission scanning electron microscope Hitachi S-4800 FE-SEM (Hitachi Corporation, Tokyo, Japan). Samples were prepared by placing a small quantity of lyophilized nanoparticles on a double-sided carbon tape previously placed on a SEM stub. Compressed air was used to remove loose nanoparticles. Platinum coating was applied during 60 seconds using with an Anatech Hummer 6.2 sputter system (Anatech USA, Hayward, California, USA) at 10 mA under argon plasma. For visualization of nanoparticles a working distance in the range from 6–9 mm and a beam strength of 1.0–1.5 kV were used.
In vitro release study
In vitro MB release from MB-PNP was evaluated by the dialysis method.24,43 Briefly, a specific amount of MB-PNP is dispersed in PBS buffer and placed into a Spectra/Por membrane dialysis of 12000–14000 MWCO (Spectrum Laboratories, Rancho Dominguez, California, USA). MB-PNP-loaded membrane is immersed in a tube containing phosphate buffer solution (10 mM, pH 7.4) and incubated at 37 °C. At fixed time intervals, a sample from the dialysis medium is collected and replaced by fresh phosphate buffer. The collected samples are analysed by UV-vis spectroscopy at 665 nm and compared to the MB calibration curve to obtain concentrations. Then, a mass balance is followed to obtain the release profile curves. The experiments were performed by triplicate.
Mathematical analysis of MB release
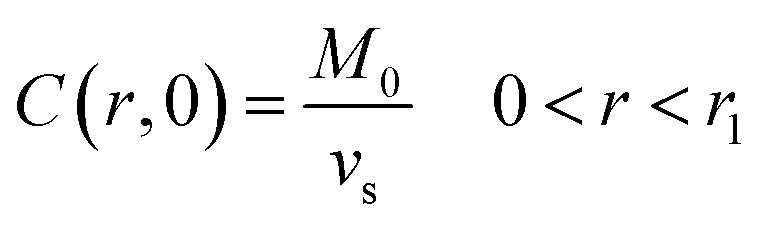
Drug release from biodegradable nanoparticles can be contributed to a variety of mechanisms. One of the most relevant mechanism of release, especially for hydrophilic drugs is the initial burst, which is attributed to a process of interfacial diffusion between the solid sphere surface and the liquid media. According to literature, the rate of drug dissolution is proportional to the effect of a variety of factors such as concentration of drug on the surface, surface area, interphase properties, solubility of the drug, and the electrostatic interactions between the drug and the carrier, these factors are combined into a proportionality constant.42,43 This mechanism analysis results into a first order equation considering that at the beginning, MB is completely incorporated in the MB-NPs. The solution of the first order equation presents an exponential profile, as presented in the following equation:
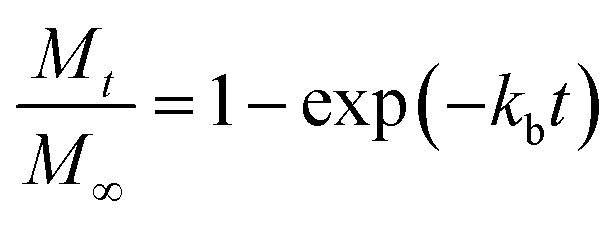 | (1) |
Following the literature, other mechanism that can be considered in a release kinetics analysis is the drug release by Fickian diffusion. A general mass balance in the radial direction and under transient conditions can be evaluated using spherical coordinates. Considerations to these analysis include: symmetry conditions; uniform concentration of drug at fixed radius; and effective diffusion coefficient constant with no chemical alteration of the drug in the system.43 The resulting equation is:
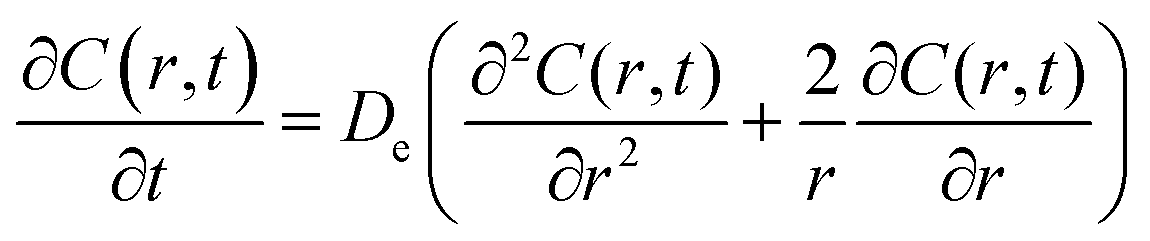 | (2) |
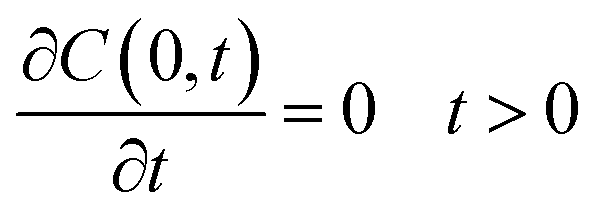 | (3) |
| C(r1,t) = 0, t > 0 | (4) |
 | (5) |
An analytical solution for this system could be obtained by using separation of variables, resulting in the following equation:
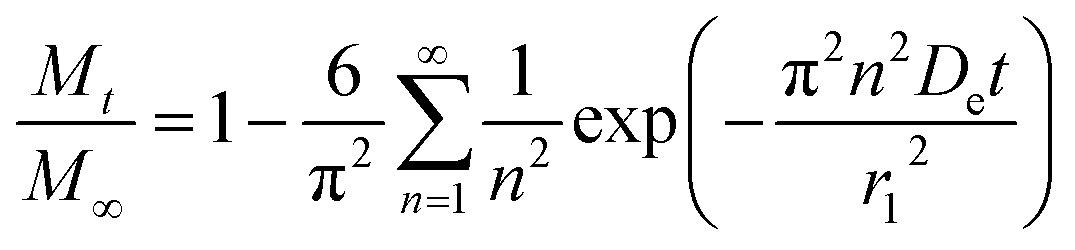 | (6) |
Depending on the drug release system, one or more mechanisms could be considered and each one of them can contribute in different proportions to the system. In this case, a linear combination of initial burst (eqn (1)) and Fickian diffusion (eqn (6)), is considered, resulting in:
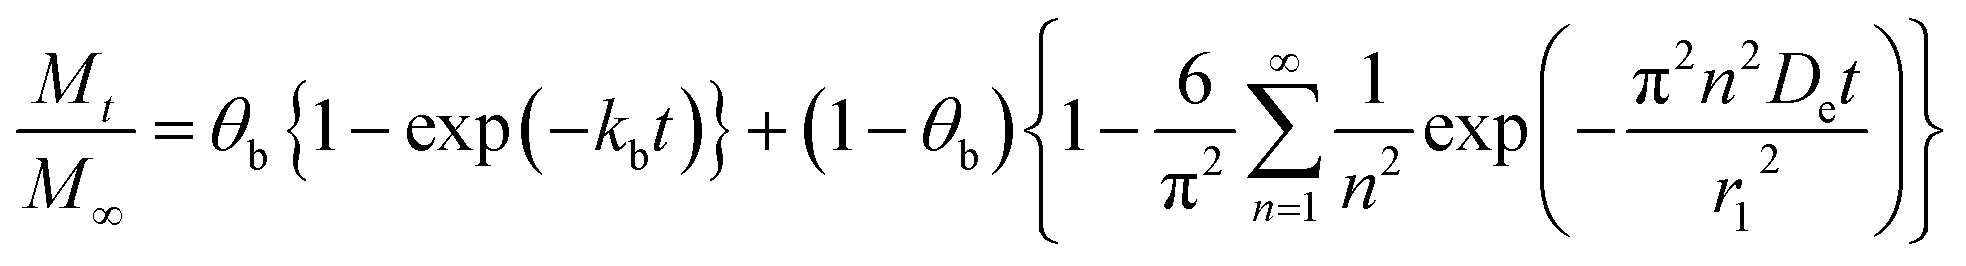 | (7) |
The release models condensed in eqn (1), (6), and (7) contain unknown parameters, which can be determined by adjusting the equation to experimental data of MB release by using nonlinear least-squares algorithm in MATLAB® (MathWorks, USA). Due to the difference in the number of parameters between the burst release, the diffusion model, and the combination of both, an adjusted coefficient of determination (Radjusted2) was incorporated in the analysis. The Radjusted2 is given by:
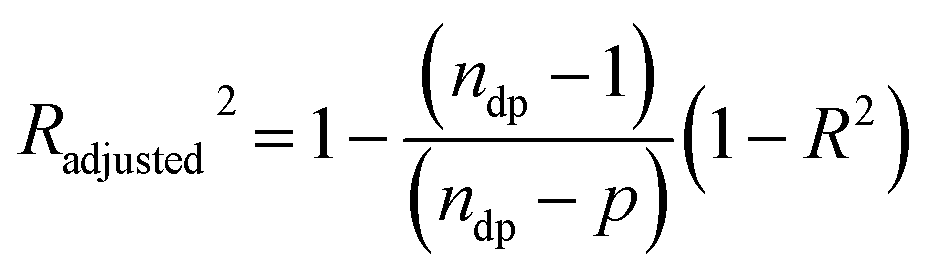 | (8) |
Results and discussions
Nanoparticles characterization
Different sets of experiments were performed by changing the initial amount of MB used in preparations while the amount of polymer was maintained constant. MB-PNP average diameter and average PDI for all preparations are presented in Fig. 2 part a. It is noted that average diameters for blank nanoparticles were around 180 nm. Results for the O/W and the combined W/O/W emulsification techniques are in similar size of blank nanoparticles, around 183 nm. Results of the well-known W/O/W emulsification technique indicate that MB-PNP size increase from 201 to 287 nm depending on TDL. The average polydispersity index obtained for MB-PNP prepared by the O/W emulsification technique was around 0.78 and 0.109 for the TDL of 2% and 4%. When MB-PNP were prepared with the well-known W/O/W emulsification technique, the average PDI obtained increased from 0.080 to 0.249 as the TDL increased, indicating saturation in the system. The combined W/O/W emulsification method present low values of PDI similar to the blank nanoparticles indicating a uniform nanoparticle size, compared with the other methods of preparation. Zeta potential for all the different preparations varied between −21 mV and −31 mV, indicating fair to good stability of the nanoparticles, respectively (Fig. 2 part b). In general, the zeta potential values were influenced by TDL, indicating some interactions between MB and the surface of the nanoparticles. In literature MB have been encapsulated in sol–gel silica nanoparticles obtaining sizes ranging the 160 nm to 190 nm and silica-based nanoparticles in the range of 20–30 nm diameter.46 Other silica nanoparticles entrapping MB have been obtained in sizes of 105 nm with zeta potential charges ranging between −44 mV and −29 mV.31 When MB is encapsulated in PLGA, authors have found sizes ranging the 190 nm to 220 nm with surface charges of −38 mV for MB charged PLGA nanoparticles and −17.5 mV for blank PLGA nanoparticles.37 Recently, Cannavà et al. reported a study where MB was also encapsulated in PLGA at a 2.5% TDL by single and double emulsification techniques. Sizes obtained by them ranged between 220 nm and 266 nm diameter, with PDI values of 0.19 and 0.4 for single and double emulsification technique respectively.24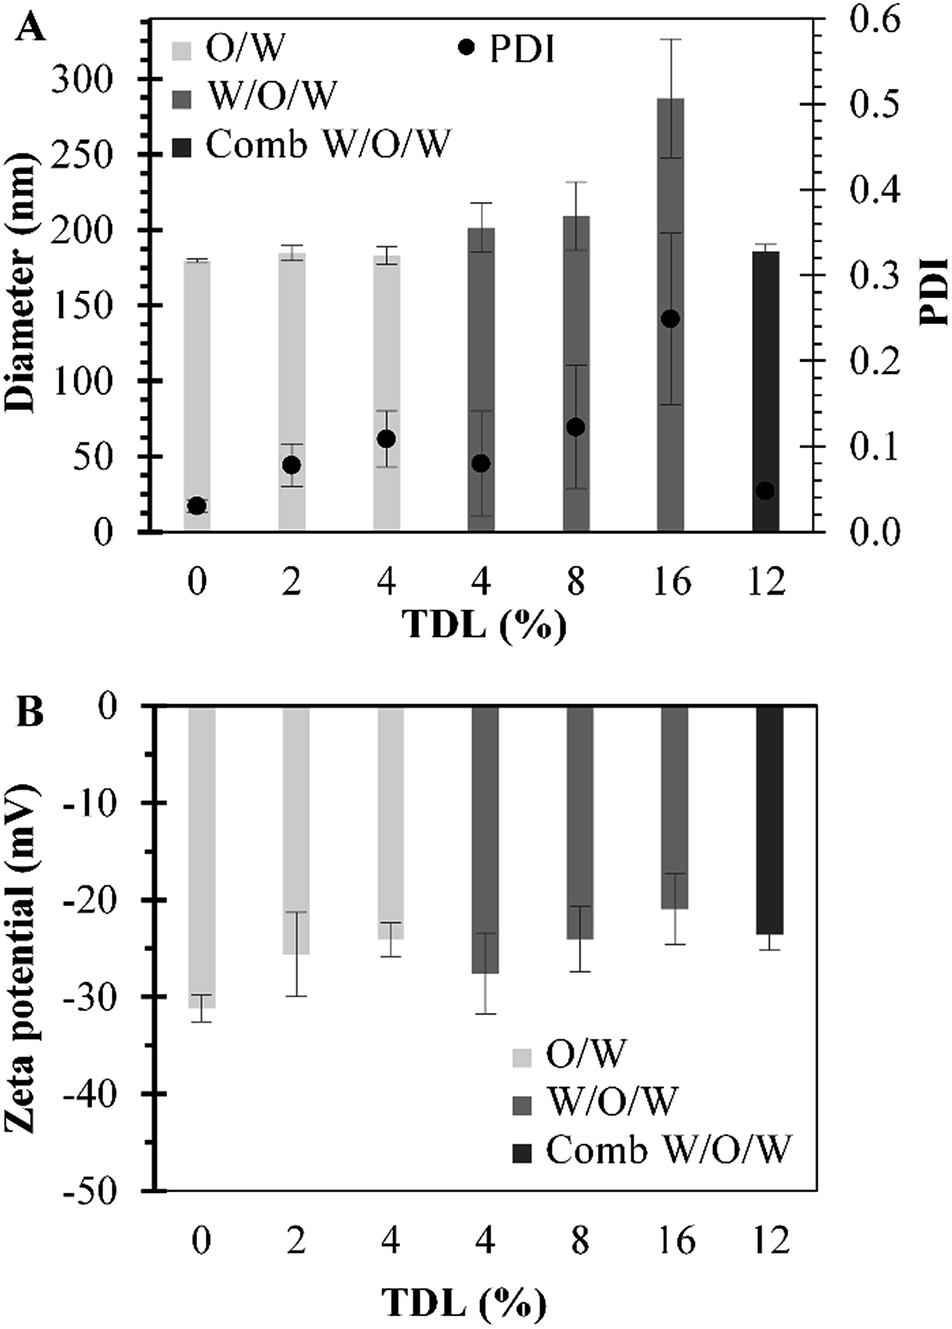 | ||
Fig. 2 Characteristics of MB-PNP prepared by different emulsification techniques. (A) Particle diameters and polydispersity index. (B) Zeta potentials. Blank nanoparticles and MB-PNP prepared with an O/W emulsification technique for 2.0 and 4.0% TDL ( ). MB-PNP prepared with a W/O/W emulsification technique for 4.0, 8.0 and 16.0% TDL ( ). MB-PNP prepared with a W/O/W emulsification technique for 4.0, 8.0 and 16.0% TDL ( ). MB-PNP prepared by a combined W/O/W emulsion method for 12% TDL ( ). MB-PNP prepared by a combined W/O/W emulsion method for 12% TDL ( ). Data represent mean ± SD (n = 3). ). Data represent mean ± SD (n = 3). | ||
In Fig. 3 are presented the DL and EE for all the preparations. DL ranged between 0.4% and 1.06% for all the formulations. The respective EE values obtained were between 8.0% and 13.3%. The DL of particles prepared by the combined method are similar to the ones obtained by the double emulsion but the diameters of particle and PDI are reduced significantly. Cannavà et al. prepared MB loaded PLGA nanoparticles by the single emulsification technique with values of 0.52% and 3.13% for the DL and EE, respectively. Also, they prepared the same kind of nanoparticles by the double emulsification technique reporting values of 1.13% and 6.75% for the DL and EE, respectively.24 These reported values for DL are comparable to the ones obtained in this work. The results obtained in the present work when the combined emulsification technique was used have values of 1.04% and 8.06% for the DL and EE, respectively, which are also comparable to literature. A summary with the average values of particle size, polydispersity index (PDI), zeta-potential, DL and EE for the different preparations of MB-PNP is presented in Table 1.
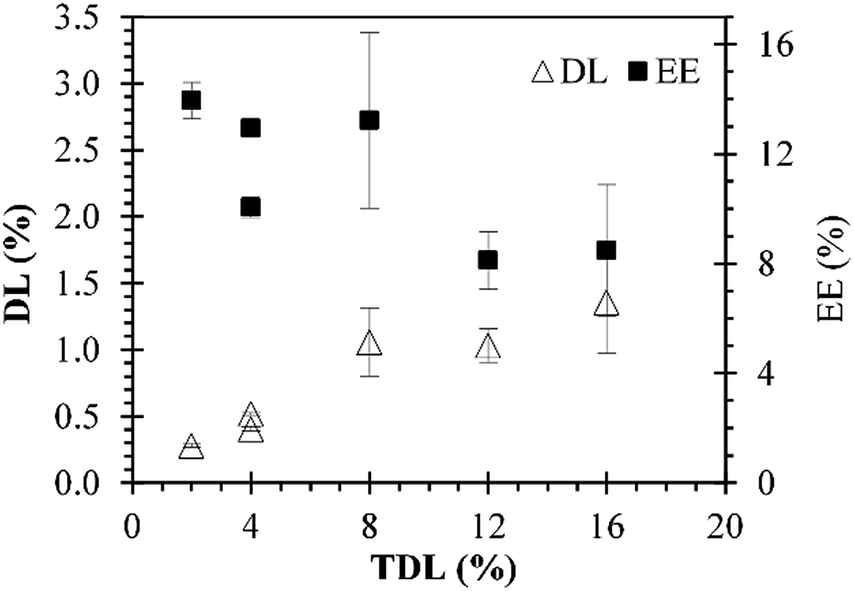 | ||
| Fig. 3 Drug loading (Δ) and encapsulation efficiency (■) for the MB-PNP with different theoretical drug loading experiments prepared by the different emulsification techniques. Data represent mean (n = 3). | ||
| Nanoparticle Preparation | TDL (%) | Size (d. nm) | PDI | ζ (mV) | DL (%) | EE (%) | |
|---|---|---|---|---|---|---|---|
| MB-PNP | PNP O/W | 0 | 179.6 ± 1.0 | 0.030 ± 0.007 | −31.2 ± 1.4 | ||
| O/W | 2 | 184.5 ± 5.0 | 0.078 ± 0.025 | −25.7 ± 4.3 | 0.28 ± 0.01 | 13.95 ± 0.66 | |
| O/W | 4 | 183.0 ± 5.8 | 0.109 ± 0.032 | −24.1 ± 1.7 | 0.40 ± 0.01 | 10.06 ± 0.37 | |
| W/O/W | 4 | 201.4 ± 16.2 | 0.080 ± 0.061 | −27.6 ± 4.2 | 0.52 ± 0.01 | 12.95 ± 0.28 | |
| W/O/W | 8 | 209.2 ± 22.7 | 0.123 ± 0.072 | −24.0 ± 3.4 | 1.06 ± 0.26 | 13.23 ± 3.19 | |
| W/O/W | 16 | 287.2 ± 39.3 | 0.249 ± 0.100 | −21.0 ± 3.6 | 1.36 ± 0.39 | 8.47 ± 2.41 | |
| Combined W/O/W | 12 | 186.0 ± 4.6 | 0.048 ± 0.005 | −23.6 ± 1.6 | 1.03 ± 0.13 | 8.12 ± 1.05 | |
Blank PLGA nanoparticles prepared by the O/W emulsification process are presented in Fig. 4. As depicted in this figure, PLGA nanoparticles are spherical with smooth surface. PLGA nanoparticles presented diameters of 113.86 ± 39 nm when evaluated by the particle size distribution histogram shown in the insert of Fig. 4. This diameter obtained with the histogram is in accordance to the measurements of DLS by considering the hydrodynamic radius in the DLS analysis. SEM of MB-PNP for the different preparations did not affect particle size as determined by SEM (results not shown).
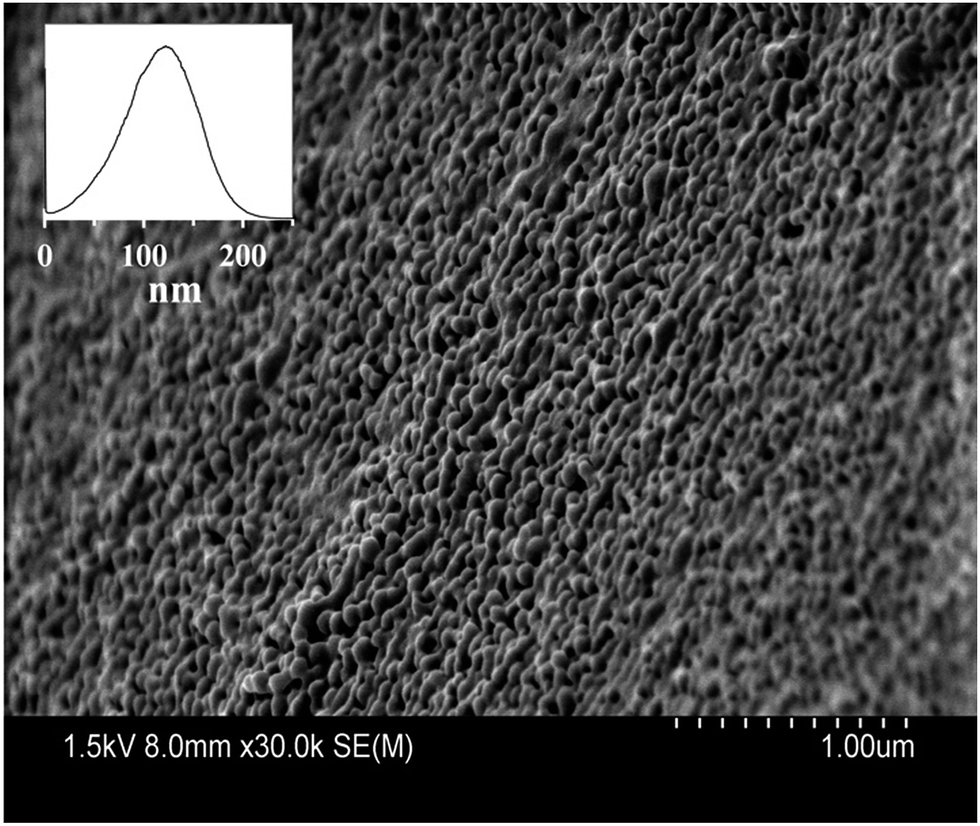 | ||
| Fig. 4 Scanning electron micrograph of blank-PNP. The insert represents the particle size distribution histogram of blank-PNP. | ||
MB release analysis
In vitro release studies of MB from MB-PNP were performed with different TDL and formulation techniques. Similar MB release profiles were obtained for all preparations. The preparations of O/W emulsification with a TDL of 4% and W/O/W emulsification with a TDL of 8% are presented in Fig. 5 in order to compare with the release profiles of the combined method prepared with a TDL of 12%. The percent of MB released in the initial times could be attributed to the initial burst mechanism. Within the first 4 hours of release above of 80% of MB was release for all the formulations. This fast release is related to the high solubility nature of MB. Also, based in this solubility is considered that most of the MB is encapsulated close to the surface of nanoparticles. In terms of mass, during the first 4 hours of release, 3.0 μg, 8.5 μg and 7.22 μg of MB per mg of nanoparticle were released by the particles prepared at TDL of 4% (O/W), TDL of 8% (W/O/W) and TDL of 12% (combined W/O/W), respectively. After the initial burst stage, a slower release was observed until a plateau was reached indicating that all MB was released from the nanoparticles. This slower release stage can be explained by the diffusion of MB through the polymer matrix. Analogous behaviour was reported in literature for similar systems, where 80% of encapsulated MB was release after 5–12 hours, reaching a 100% at approximately in 24 hours.24,37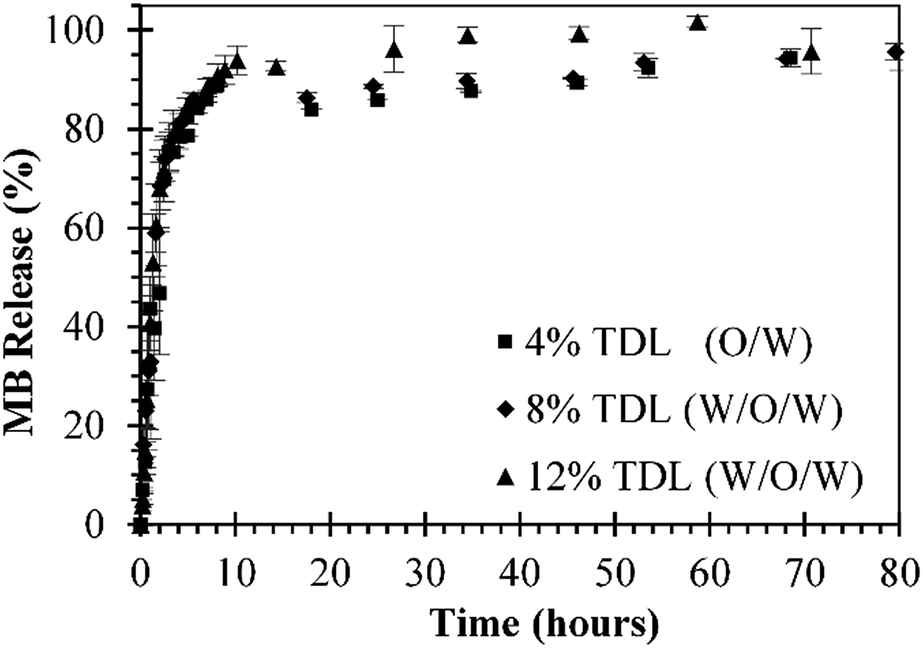 | ||
| Fig. 5 In vitro MB release profiles from 4.0% (■) TDL MB-PNP prepared with an O/W emulsification technique, 8.0% (♦) TDL prepared by W/O/W emulsion method; and 12% (▲) prepared by a combined W/O/W emulsion method. Data represent mean ± SD (n = 3). | ||
Experimental MB release data was analysed by three different models represented in Ec. (1), Ec. (6), and Ec. (7) for initial burst, MB diffusion and a combination of both mechanisms, respectively. In general, a good fit of the three models with the experimental data was obtained, as presented in Fig. 6. The parameters obtained for each model are presented in Table 2. The fit of the initial burst model (eqn (1)) to the experimental data are fair, as could be observed in Fig. 6. As expected, this model is good to describe the experimental data at smaller times, but it's not able to describe the middle part of the release profile. The initial burst constant values obtained with this model are 0.377 h−1, 0.453 h−1, and 0.464 h−1, for particles prepared at TDL of 4% (O/W), TDL of 8% (W/O/W) and TDL of 12% (combined W/O/W), respectively. The initial burst constant increases proportionally to the DL. In other words, since more mass of drug was released in the same amount of time, the initial burst changes in proportion. These effect was previously described in literature indicating that more drug could be trapped on the surface of the polymer matrix during the manufacturing process especially in the case of high drug loading.47 The Fickian diffusion model (eqn (6)) was able to fairly describe experimental data, especially at shorter times, as could be observed in Fig. 6. Although, the fit of this model to the middle part of the release profile curve was not ideal. The effective diffusion coefficient values obtained by the model were in the range of 10−16 cm2 s−1 for all formulations. However, the effective diffusion coefficient could be also associated to the DL in the same terms than initial burst constant analysis presented for eqn (1). When using Fickian model, the coefficients of determination obtained are considerably lower, compared with the initial burst model, as could be observed in Table 2.
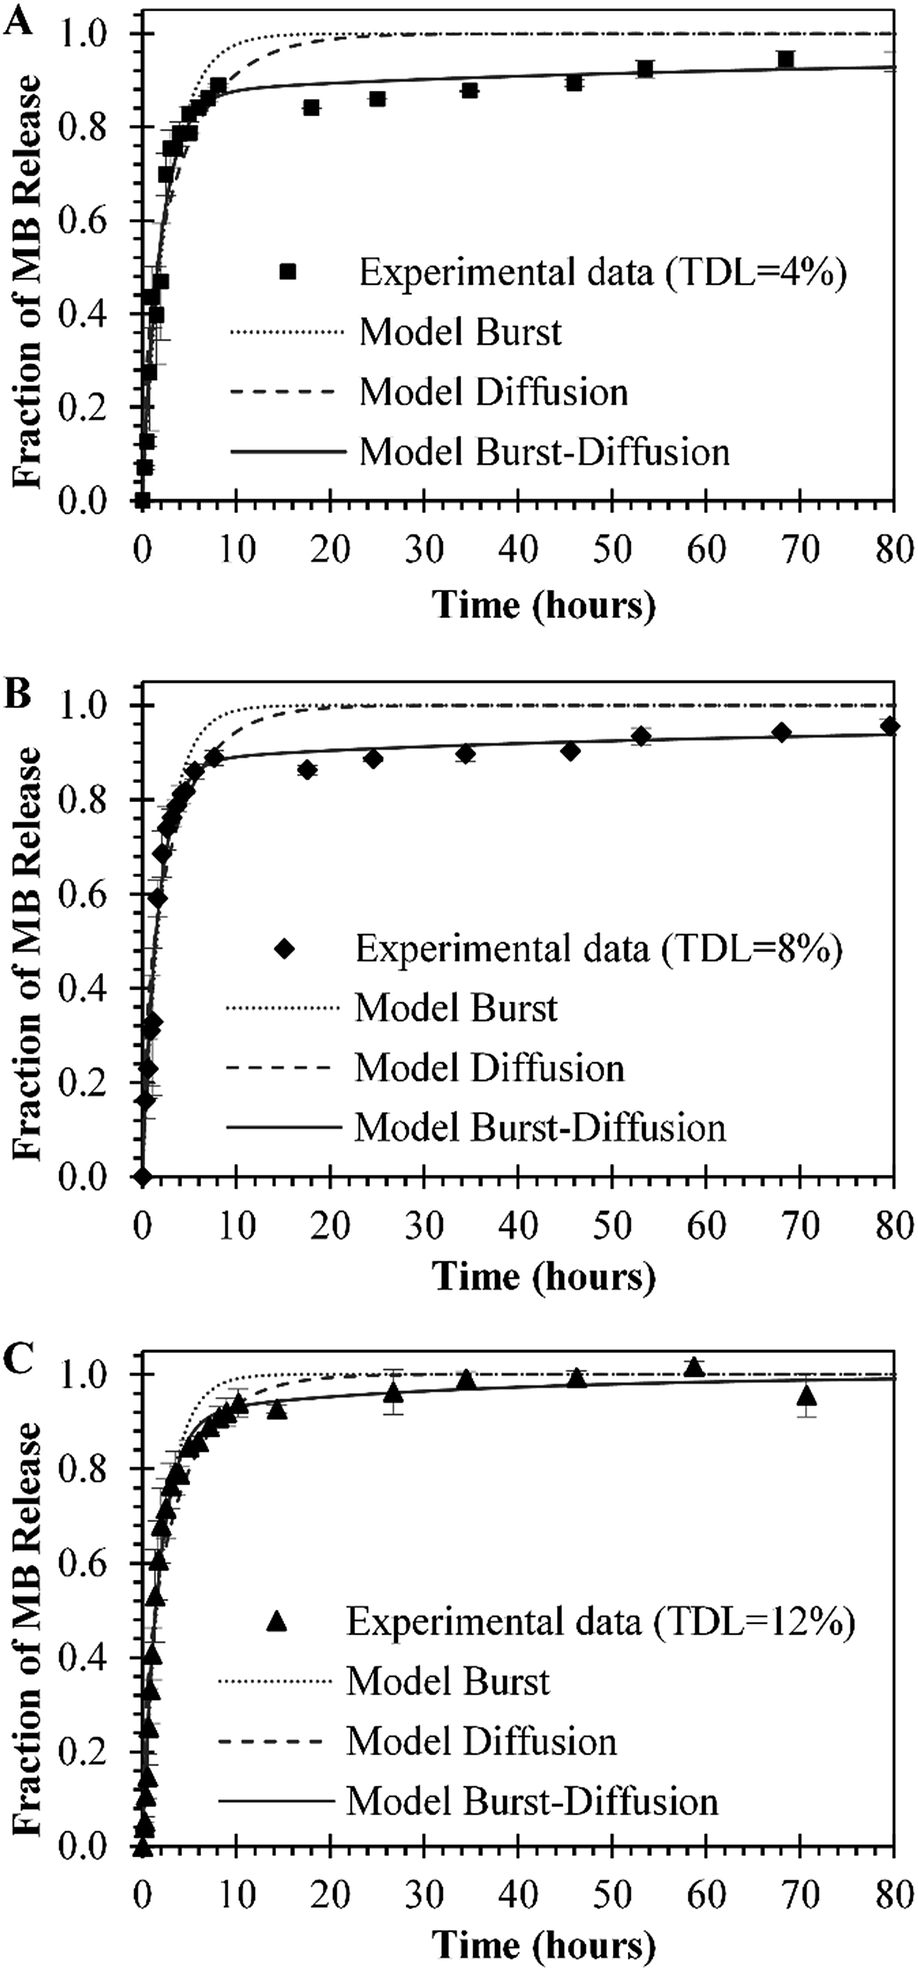 | ||
Fig. 6 MB release initial bust model ( ), diffusion model ( ), diffusion model ( ) and a combined initial burst and diffusion model (····) profiles from (A) 4.0% (■) TDL MB-PNP prepared with an O/W emulsification technique, (B) 8.0% (♦) TDL prepared by W/O/W emulsion method; and (C) 12% (▲) prepared by a combined W/O/W emulsion method. Data represent mean ± SD (n = 3). ) and a combined initial burst and diffusion model (····) profiles from (A) 4.0% (■) TDL MB-PNP prepared with an O/W emulsification technique, (B) 8.0% (♦) TDL prepared by W/O/W emulsion method; and (C) 12% (▲) prepared by a combined W/O/W emulsion method. Data represent mean ± SD (n = 3). | ||
| Parameters | Description | Unit | O/W single emulsion TDL = 4% | W/O/W double emulsion TDL = 8% | W/O/W combined emulsion TDL = 12% |
|---|---|---|---|---|---|
| Model of initial burst | |||||
| kb | Burst constant | hours−1 | 0.377 | 0.453 | 0.464 |
| R2 | Coefficient of determination | 0.934 | 0.948 | 0.979 | |
|
|||||
| Model of diffusion | |||||
| D | Diffusion constant | cm2 s−1 | 4.454 × 10⁻¹⁶ | 5.450 × 10⁻¹⁶ | 5.100 × 10⁻¹⁶ |
| R2 | Coefficient of determination | 0.907 | 0.921 | 0.936 | |
|
|||||
| Model of initial burst and diffusion | |||||
| ϑb | Fraction of burst release | — | 0.851 | 0.862 | 0.876 |
| kb | Burst constant | hours−1 | 0.516 | 0.600 | 0.556 |
| ϑd | Fraction of diffusion | — | 0.149 | 0.138 | 0.124 |
| D | Diffusion constant | cm2 s−1 | 9.179 × 10⁻¹⁸ | 1.086 × 10⁻¹⁷ | 5.941 × 10⁻¹⁷ |
| R2 | Coefficient of determination | 0.978 | 0.988 | 0.988 | |
| Radjusted2 | Adjusted coefficient of determination | 0.976 | 0.986 | 0.987 | |
By combining both models, the initial burst and the Fickian diffusion into a linear equation that considers the simultaneous contribution of both models (eqn (7)) a better fit to the experimental data is obtained, compared to the individual models. In the combined model, initial burst constant values increased compared to the ones obtained by the initial burst model by itself. In contrast, the effective diffusion coefficient decreases in comparison with the values obtained by the model of eqn (6). The combined model is able to describe more accurately the release phenomena since simultaneously consider the influence of two mechanisms of release, as could be observed in the coefficients of determination presented in Table 2. Cannavà et al. used three individual models of release to describe MB release from PLGA nanoparticles when encapsulated with cyclodextrin: a zero order, a first order and a Higuchi model that resulted in release rate constants of 0.5358 h−1, 0.0346 h−1 and 6.7967 h−1/2, respectively. These models resulted with coefficients of determination of 0.8794, 0.9361 and 0.9799 respectively. According to this author, the release of MB can be described as the squared root of a time-dependent process based on Fickian diffusion.24 Also, authors have found that diffusion is the controlling mechanism of release when encapsulating other photosensitizers with low solubility.
Conclusion
MB-PNP were successfully prepared by the proposed combined emulsification technique consisting in a combination of the single and double emulsification. Size, polydispersity index, zeta potential, MB loading and the encapsulation efficiency of nanoparticles were determined. These results suggest that the particles prepared by the combined technique resulted with uniform particle size and repeatability compared with the individual techniques. The combine technique could be applied to several compounds that have partial solubility to improve the drug loading and also the physicochemical characteristics of nanoparticles. The release profile curve of MB from PLGA nanoparticles indicate that most of the MB was encapsulated close to the surface of nanoparticles. This release profile was analysed by considering an initial burst model, a MB diffusion model and also by simultaneously combining both mechanisms of release into a linear model. It was found that initial burst constant and the effective diffusion coefficient are associated to the DL. The combined model describes more accurately the release phenomena than the individual mechanisms indicating that both mechanisms are significant. This mathematical analysis could be used to describe and predict the release of compounds with intermediate to high solubility from biodegradable nanoparticles.Conflicts of interest
There are no conflicts to declare.Acknowledgements
Financial assistance from the National Council of Science and Technology of Mexico (CONACYT) is genuinely acknowledged with the projects I0007-2013-01 No. 206489. Financial assistance is acknowledged to the Secretariat of Public Education of Mexico (SEP) with the project UNISON-PTC-222 DSA/103.5/15/7356. Reynaldo Esquivel thanks for projects PDCPN201401-247326 and for Cátedra CONACYT PN 2264. CAG-V thanks CONACYT for the PhD scholarship.References
- L. Mu and S. S. Feng, J. Controlled Release, 2003, 86, 33–48 CrossRef CAS PubMed.
- H. K. Makadia and S. J. Siegel, Polym., 2011, 3, 1377–1397 CAS.
- F. Danhier, E. Ansorena, J. M. Silva, R. Coco, A. Le Breton and V. Préat, J. Controlled Release, 2012, 161, 505–522 CrossRef CAS PubMed.
- D. Peer, J. M. Karp, S. Hong, O. C. Farokhzad, R. Margalit and R. Langer, Nat. Nanotechnol., 2007, 2, 751–760 CrossRef CAS PubMed.
- M. G. Nava-Arzaluz, E. Piñón-Segundo, A. Ganem-Rondero and D. Lechuga-Ballesteros, Recent Pat. Drug Delivery Formulation, 2012, 6, 209–223 CrossRef CAS.
- J. Vivero-Escoto and M. Elnagheeb, Nanomaterials, 2015, 5, 2302–2316 CrossRef CAS PubMed.
- E. Paszko, C. Ehrhardt, M. O. Senge, D. P. Kelleher and J. V. Reynolds, Photodiagn. Photodyn. Ther., 2011, 8, 14–29 CrossRef CAS PubMed.
- C. Gutiérrez-Valenzuela, P. Guerrero-Germán, A. Tejeda-Mansir, R. Esquivel, R. Guzmán-Z and A. Lucero-Acuña, Appl. Sci., 2016, 6, 1–15 Search PubMed.
- R. A. Jain, Biomaterials, 2000, 21, 2475–2490 CrossRef CAS PubMed.
- H. Murakami, M. Kobayashi, H. Takeuchi and Y. Kawashima, Powder Technol., 2000, 107, 137–143 CrossRef CAS.
- D. K. Sahana, G. Mittal, V. Bhardwaj and M. N. V. R. Kumar, J. Pharm. Sci., 2008, 97, 1530–1542 CrossRef CAS PubMed.
- S. Dhar, F. X. Gu, R. Langer, O. C. Farokhzad and S. J. Lippard, Proc. Natl. Acad. Sci. U. S. A., 2008, 105, 17356–17361 CrossRef CAS PubMed.
- M. Chorny, I. Fishbein, H. D. Danenberg and G. Golomb, J. Controlled Release, 2002, 83, 389–400 CrossRef CAS PubMed.
- E. Cohen-Sela, M. Chorny, N. Koroukhov, H. D. Danenberg and G. Golomb, J. Controlled Release, 2009, 133, 90–95 CrossRef CAS PubMed.
- C. Vauthier and K. Bouchemal, Pharm. Res., 2009, 26, 1025–1058 CrossRef CAS PubMed.
- H. Park, J. Yang, J. Lee, S. Haam, I. H. Choi and K. H. Yoo, ACS Nano, 2009, 3, 2919–2926 CrossRef CAS PubMed.
- C. E. Mora-Huertas, H. Fessi and A. Elaissari, Int. J. Pharm., 2010, 385, 113–142 CrossRef CAS PubMed.
- M. Iqbal, N. Zafar, H. Fessi and A. Elaissari, Int. J. Pharm., 2015, 496, 173–190 CrossRef CAS PubMed.
- F. Tewes, E. Munnier, B. Antoon, L. Ngaboni Okassa, S. Cohen-Jonathan, H. Marchais, L. Douziech-Eyrolles, M. Soucé, P. Dubois and I. Chourpa, Eur. J. Pharm. Biopharm., 2007, 66, 488–492 CrossRef CAS PubMed.
- A. Song, S. Ji, J. Sook Hong, Y. Ji, A. A. Gokhale and I. Lee, J. Appl. Polym. Sci., 2016, 133, 1–10 Search PubMed.
- M. F. Zambaux, F. Bonneaux, R. Gref, P. Maincent, E. Dellacherie, M. J. Alonso, P. Labrude and C. Vigneron, J. Controlled Release, 1998, 50, 31–40 CrossRef CAS PubMed.
- T. C. Pagonis, J. Chen, C. R. Fontana, H. Devalapally, K. Ruggiero, X. Song, F. Foschi, J. Dunham, Z. Skobe, H. Yamazaki, R. Kent, A. C. R. Tanner, M. M. Amiji and N. S. Soukos, Journal of Endodontics, 2010, 36, 322–328 CrossRef PubMed.
- T. Govender, S. Stolnik, M. C. Garnett, L. Illum and S. S. Davis, J. Controlled Release, 1999, 57, 171–185 CrossRef CAS PubMed.
- C. Cannavà, R. Stancanelli, M. R. R. Marabeti, V. Venuti, C. Cascio, P. Guarneri, C. Bongiorno, G. Sortino, D. Majolino, A. Mazzaglia, S. Tommasini and C. A. A. Ventura, RSC Adv., 2016, 6, 16720–16729 RSC.
- M. D. Chavanpatil, A. Khdair, Y. Patil, H. Handa, G. Mao and J. Panyam, Pharm. Nanotechnol., 2007, 96, 3379–3389 CAS.
- M. Wainwright and K. B. Crossley, J. Chemother., 2002, 14, 431–443 CrossRef CAS PubMed.
- G. M. Calixto, J. Bernegossi, L. M. de Freitas, C. R. Fontana and M. Chorilli, Molecules, 2016, 21, 1–18 Search PubMed.
- H.-C. Huang, Y. Yang, A. Nanda, P. Koria and K. Rege, Nanomedicine, 2011, 6, 459–473 CrossRef CAS PubMed.
- P. Zhang, W. Steelant, M. Kumar and M. Scholfield, J. Am. Chem. Soc., 2007, 129, 4526–4527 CrossRef CAS PubMed.
- D. Bechet, P. Couleaud, C. Frochot, M.-L. Viriot, F. Guillemin and M. Barberi-Heyob, Trends Biotechnol., 2008, 26, 612–621 CrossRef CAS PubMed.
- X. He, X. Wu, K. Wang, B. Shi and L. Hai, Biomaterials, 2009, 30, 5601–5609 CrossRef CAS PubMed.
- D. B. Tada, L. L. R. Vono, E. L. Duarte, R. Itri, P. K. Kiyohara, M. S. Baptista and L. M. Rossi, Langmuir, 2007, 23, 8194–8199 CrossRef CAS PubMed.
- T. Deprá de Souza, F. I. Ziembowicz, D. F. Muller, S. C. Lauermann, C. L. Kloster, R. C. Vianna Santos, L. Q. Soares Lopes, A. Ferreira Ourique, G. MacHado and M. A. Villetti, Eur. J. Pharm. Sci., 2016, 83, 88–98 CrossRef PubMed.
- E. Darabpour, N. Kashef and S. Mashayekhan, Photodiagn. Photodyn. Ther., 2016, 14, 211–217 CrossRef CAS PubMed.
- Y. Long, Z. Li, Q. Bi, C. Deng, Z. Chen, S. Bhattachayya and C. Li, Int. J. Pharm., 2016, 502, 232–241 CrossRef CAS PubMed.
- J. Yu, C. Hsu, C. Huang and P. Chang, ACS Appl. Mater. Interfaces, 2015, 7, 432–441 CAS.
- V. Klepac-Ceraj, N. Patel, X. Song, C. Holewa, C. Patel, R. Kent, M. M. Amiji and N. S. Soukos, Lasers Surg. Med., 2011, 43, 600–606 CrossRef PubMed.
- O. I. Corrigan and X. Li, Eur. J. Pharm. Sci., 2009, 37, 477–485 CrossRef CAS PubMed.
- J. F. Fitzgerald and O. I. Corrigan, in Polymeric Delivery Systems, 1993, pp. 311–326 Search PubMed.
- S. Fredenberg, M. Wahlgren, M. Reslow and A. Axelsson, Int. J. Pharm., 2011, 415, 34–52 CrossRef CAS PubMed.
- L. L. Lao, N. A. Peppas, F. Y. C. Boey and S. S. Venkatraman, Int. J. Pharm., 2011, 418, 28–41 CrossRef CAS PubMed.
- R. P. Batycky, J. Hanes, R. Langer and D. A. Edwards, J. Pharm. Sci., 1997, 86, 1464–1477 CrossRef CAS PubMed.
- A. Lucero-Acuña and R. Guzmán, Int. J. Pharm., 2015, 494, 249–257 CrossRef PubMed.
- C. A. Gutiérrez-Valenzuela, R. Rodríguez-Córdova, Y. Hernández-Giottonini, P. Guerrero-Germán and A. Lucero-Acuña, Microsc. Microanal., 2017, 23, 1212–1213 CrossRef.
- P. Costa and J. M. Sousa Lobo, Eur. J. Pharm. Sci., 2001, 13, 123–133 CrossRef CAS PubMed.
- W. Tang, H. Xu, R. Kopelman and M. A. Philbert, Photochem. Photobiol., 2005, 81, 242 CrossRef CAS PubMed.
- X. Huang and C. S. Brazel, J. Controlled Release, 2001, 73, 121–136 CrossRef CAS PubMed.
| This journal is © The Royal Society of Chemistry 2018 |