 Open Access Article
Combination of a bio-based polyphosphonate and modified graphene oxide toward superior flame retardant polylactic acid†
Jian Jingab,
Yan Zhang *a,
Xinlei Tangb,
Xiaonan Lia,
Mao Pengb and
Zhengping Fangab
aLaboratory of Polymer Materials and Engineering, Ningbo Institute of Technology, Zhejiang University, Ningbo 315100, China. E-mail: zhangyan@nit.zju.edu.cn
bMOE Key Laboratory of Macromolecular Synthesis and Functionalization, Institute of Polymer Composites, Zhejiang University, Hangzhou 310027, China
First published on 23rd January 2018
Abstract
Superior flame retardant polylactic acid (PLA) composites were prepared using bio-based polyphosphonate (BPPT) and polyethyleneimine-modified graphene oxide (M-GO) to be used as a flame retardant, the total amount of which is only 3 wt%. With 2.4 wt% BPPT and 0.6 wt% M-GO in the polymer matrix, the as-prepared PLA composites can achieve the UL94 V0 grade and a LOI value of 36.0. Analysis of the residual char and pyrolytic products revealed that the conjunction of a gas-phase and condensed-phase mechanism contributes to the good flame retardant performance. Moreover, the tensile toughness of PLA was also enhanced. The PLA composite with 2.1 wt% BPPT and 0.9 wt% M-GO displayed an elongation at break of 13.1% and maintained a tensile strength of 39.1 MPa. The debonding between the M-GO and PLA matrix and the plastic deformation around the M-GO particles were responsible for the improved tensile toughness.
1 Introduction
Polylactic acid (PLA), a plant-derived biodegradable aliphatic polyester, already has extensive applications in numerous areas such as biomedicine, packaging materials, and electrical and electronic equipment (E&E).1,2 However, PLA is highly inflammable, as evidenced by the low limiting oxygen index (∼20), the absence of grade in UL94 tests, etc. It burns rapidly and leaves negligible char in cone calorimeter tests. Moreover, PLA is also comparatively brittle with low deformation at break, which impedes its application in various end-use areas.3,4 Due to these deficiencies, growing efforts are focused on the improvement of the flame retardancy and mechanical properties of PLA.The inclusion of addition-type flame retardants into PLA by a melting–blending process is the most economically feasible approach to achieve flame retardancy. Although halogen-containing flame retardants have good flame retardant efficiency, they may cause some problems, i.e., emission of toxic and corrosive fumes during combustion.5,6 Phosphorus–nitrogen compounds are deemed biologically and environmentally benign halogen-free additives, and were developed rapidly in recent years.7,8 For instance, intumescent flame retardants (IFR) have attracted a great deal of attention due to their advantages, e.g., low-smoke emission and low toxicity.9–11 Considering the resource crisis, tremendous studies have been performed to develop environment-friendly and biomass-derived agents for PLA/IFR systems.12–14 Such bio-based ingredients could show impressive intumescent performances and flame-extinguishing characteristics during combustion, but this often requires relatively high loadings of FR additives (i.e., normally >20% by mass additive). These high loadings of flame retardants always exert a negative influence on thermal and mechanical properties.
Hence, highly efficient phosphorus-containing flame retardants for PLA have been developed. Wei et al. synthesized a hyperbranched poly(phosphamide ester) (HBPE) oligomer and found that the flame retardant PLA composites could achieve the UL94 V0 rating and an LOI value of 33 with 2 wt% loading of HBPE.15 Wang et al. added N,N′-diallyl-P-phenylphosphonicdiamide (P-AA) into the PLA matrix and found that the resultant flame retardant PLA achieved a UL94 V0 rating and LOI value of 29.6 at a P-AA loading content of 1 wt%.16 Although the loading dosages of the flame retardant additives were reduced to a minimal amount, the deterioration of the mechanical properties was still inevitable and the ingredients were not derived from biomass.
Nanotechnology is a versatile approach that can simultaneously improve flame retardancy and mechanical properties. Examples of nanomaterials include carbon nanotube,17 nano-sized carbon black,18 fullerene,19 layered double hydroxide,20 and montmorillonite.21 Among these, graphene shows better potential for the fabrication of high performance flame retardant materials because it combines the advantages of both a layered-structure and a graphitized-structure.22,23 Wang et al. modified the surface of graphene oxide with non-flammable silica through a sol–gel and surface treatment process; the results show that the incorporation of the as-prepared nanosilica/graphene oxide (m-SGO) hybrid into an EP resin could significantly increase the flame retardancy as well as the mechanical, and thermal stability.22 Hu et al. synthesized a series of flame retardant grafted GO, which showed efficient flame retardancy with decreased pHRR, as well as improved mechanical properties of the epoxy resins.23,24
In our previous study, bio-based polyphosphonate (BPPT) was synthesized,25 which imparted an efficient flame retardancy to PLA with very low loading content (<6 wt%). However, the resultant materials exhibited a heavy dripping phenomenon and became more brittle as compared to the neat PLA. Considering the good performance of GO for the improvement of flame retardancy and mechanical properties, we combined BPPT and a modified GO (M-GO) with grafted polyethyleneimine (PEI) as the flame retardant for PLA. The barrier effect of M-GO could facilitate the improved dripping and inhibit smoke release during combustion. Simultaneously, the large number of amine groups on the M-GO surface can enhance its interfacial interaction with the PLA matrix via hydrogen bonding,26 which is favorable to ameliorate the mechanical properties of PLA. The influence of the BPPT and M-GO on the flame retardancy and tensile properties of PLA was studied. The function mechanism of the BPPT and M-GO in PLA was also discussed.
2 Experimental
2.1 Materials
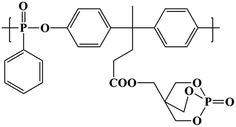
Polylactic acid (PLA, 3052D) was purchased from Natureworks LLC (USA) with melt index of 10–15 g min−1 (210 °C/2.16 kg) and density of 1.24 g m−3. Polyethylenimine (PEI) (Mn = 10![[thin space (1/6-em)]](https://www.rsc.org/images/entities/char_2009.gif) 000 g mol−1) and 1-ethyl-3-(3-dimethylaminopropyl)carbodiimide hydrochloride (EDC·HCl) were purchased from Aladdin-reagent (China). The bio-based polyphosphonate (BPPT) was synthesized according to our previous study25 and should be dried at 80 °C for 24 h in a vacuum oven prior to melt mixing; the structure is shown in Fig. 1. Graphene oxide (GO) was prepared using the modified Hummers method reported earlier.27 All other materials were commercially available and used as received.
000 g mol−1) and 1-ethyl-3-(3-dimethylaminopropyl)carbodiimide hydrochloride (EDC·HCl) were purchased from Aladdin-reagent (China). The bio-based polyphosphonate (BPPT) was synthesized according to our previous study25 and should be dried at 80 °C for 24 h in a vacuum oven prior to melt mixing; the structure is shown in Fig. 1. Graphene oxide (GO) was prepared using the modified Hummers method reported earlier.27 All other materials were commercially available and used as received.
2.2 Synthesis of M-GO
The M-GO was synthesized by grafting PEI on the surface of GO through the formation of an amide bond in the presence of EDC.28,29 In a typical process, 100 mg pristine GO was dispersed evenly in 100 mL distilled water by ultrasound treatment. 80 mL aqueous solution of PEI (0.01 g mL−1) and 100 mL EDC solution (10 mg mL−1) were then added. The mixture was continually stirred at 25 °C overnight. The final product solution was dialyzed through a 10![[thin space (1/6-em)]](https://www.rsc.org/images/entities/char_2009.gif) 000 (Mn) molecular weight cutoff dialysis membrane in deionized water for 2 days to remove the unreacted PEI.
000 (Mn) molecular weight cutoff dialysis membrane in deionized water for 2 days to remove the unreacted PEI.
The virgin GO and M-GO were characterized by FT-IR spectroscopy as shown in Fig. S1 (see ESI†). A strong peak appearing at 1726 cm−1, attributed to carboxyl stretching, is observed for GO. After GO was grafted with PEI, the above-mentioned peak at 1726 cm−1 vanished and a new prominent amide group peak appeared at 1631 cm−1. Furthermore, strong absorption bands at 2926 cm−1 and 2850 cm−1, attributed to the aliphatic C–H bonding of the PEI, were observed. The FT-IR spectra confirm the successful conjunction of PEI onto GO. The TGA curves are shown in Fig. S2 (see ESI†). As shown in Fig. S2,† neat GO and M-GO display about 52 wt% and 82 wt% weight losses, respectively. According to ref. 30, the content of PEI in M-GO was determined to be about 30 wt%.
2.3 Preparation of the composites
To facilitate the dispersion of M-GO within the PLA matrix, a masterbatch of PLA and M-GO at a mass ratio of 80/20 was prepared by a typical solution mixing method using chloroform as the solvent. The detailed procedure of the solution mixing method is as follows: the saturated PLA chloroform solution was prepared first; then, the PLA solution was added dropwise into the M-GO aqueous solution prepared according to the procedure described in Section 2.2; finally, the masterbatch PLA/M-GO precipitated simultaneously and was collected. The masterbatch PLA/M-GO was dried at 80 °C for 24 h in a vacuum oven prior to melt mixing. Next, the flame retardant PLA was prepared using the melt mixing method with a total loading of BPPT and M-GO of 3 wt%. The as-prepared composites are denoted as PLA/xBPPT/yM-GO, in which ‘x’ and ‘y’ refer to the mass percent of BPPT and M-GO in the composites, respectively. The mixing condition was carried out at 160 °C with a screw speed of 60 rpm for 6 min using a ThermoHaake rheomixer (Polylab, Germany). The neat PLA matrix was also processed under the same conditions.2.4 Characterization
FT-IR spectroscopy was performed on a Vector-22 FTIR spectrometer (Bruker, Germany) using KBr pellets. Limiting oxygen index (LOI) values were measured according to ASTM D2863 with sample sheets of dimension 150 × 6 × 3 mm3, and the apparatus was an HC-2 Oxygen Index Instrument (Jiangning Analysis Instrument Company, China). The vertical burning tests were performed on a CZF-III Vertical Burning Tester (Jiangning Analysis Instrument Company, China) according to the UL94 test protocol (ASTM D3801 standard) with specimen sheets of dimension 127 × 12.7 × 3 mm3. Cone calorimetric (CONE) tests were carried out on a FTT Cone Calorimeter with specimen sheets of dimension 100 × 100 × 3 mm3 at a heat flux of 35 kW m−2. Raman spectroscopy (Renishaw inVia, UK, excitation-beam wavelength: 514 nm) was used to characterize the vibrational properties of the char materials after the cone calorimetric tests. Scanning electron microscopy (SEM) was conducted on a Hitachi S-4800 field-emission scanning electron microscope, which operated at 3 kV. Prior to analysis, the specimens were gold-sputtered for 1.5 min under high vacuum to increase the conductivity. Transmission electron microscopy (TEM) images were collected using a JEM 1230 TEM instrument. Thermogravimetric analysis coupled to Fourier transform infrared spectroscopy (TGA-FTIR) measurements were performed in the range of 50–600 °C under N2 flow using a TGA 209 F1 instrument (Netzsch, Germany), coupled with a Thermo Nicolet iS10 FTIR spectrometer (Thermosher, Germany). The volatile compounds evolving from TG could be transferred into the gas cell of the FTIR spectrometer through the transfer line by a suitable gas flow. The spectra were obtained with a scan interval of 2.23 s. The resolution of the spectra was 4 cm−1. Tensile testing was performed using an electronic universal mechanical testing machine (Model RTW10, Shenzhen Reger Instrument Co. Ltd., China). Dumbbell specimens with a 25 × 4 × 2 mm3 neck were used. The tests were performed at room temperature at a constant crosshead speed of 2 mm min−1. At least eight samples were tested to obtain average values for the tensile properties of neat PLA and the flame retardant composites.3 Results and discussion
3.1 Dispersion of M-GO in PLA
The morphological structures of the PLA composites were characterized using TEM, and the images are shown in Fig. 2. As shown in Fig. 2, the M-GO dispersed in PLA has a tactoid-like layered structure. With the increased loading of M-GO from 0.3 wt% to 0.9 wt%, the persistence length of the layered structure became shorter, while its concentration and sheet thickness increased compared with lower loadings of M-GO, indicating that the higher loading of M-GO could induce its aggregation. | ||
| Fig. 2 SEM photographs of the specimens: (A) PLA/2.7BPP7/0.3M-GO, (B) PLA/2.4BPPT/0.6M-GO and (C) PLA/2.1BPPT/0.9M-GO. | ||
3.2 Flammability
The limiting oxygen index (LOI) and vertical burning grade (UL94), as typical flame retardant tests, were employed to study the joint effect of M-GO and BPPT on the flame retardant performance of PLA. The detailed results are listed in Table 1. As summarized in Table 1, the LOI value of neat PLA is only 20 and PLA receives no grade in the UL94 tests. After adding 3 wt% BPPT into PLA, the LOI value increases to 33.6 and a UL94 V0 grade was achieved, though severe dripping was observed during the UL94 tests. According to our previous study, BPPT endows PLA with a flame retardancy through a gas-phase mechanism, which can form phosphorus-containing compounds as free radical scavengers in the evolved gaseous product during the thermal degradation of BPPT.25 When M-GO was added into PLA and the total amount of flame retardant was maintained at 3 wt%, the LOI values first increased with the M-GO content and then dropped with excess M-GO. PLA/2.4BPPT/0.6M-GO displayed the highest LOI value of 36.0 and obtained a UL94 V0 grade. Moreover, dripping during UL94 test was suppressed to a great extent compared with neat PLA. However, when the M-GO loading was further increased to 0.9 wt%, the UL94 V2 grade was achieved.In the PLA/BPPT/M-GO system, it was noticed that the melt dripping in the UL-94 vertical tests was clearly inhibited. The photographs of the specimens after the LOI tests, presented in Fig. 3, also show the anti-dripping effect of M-GO. This is because graphene nanosheets can lead to an evident increase in viscosity despite their dispersion as stacked multilayered structures in the PLA matrix.31 Thus, in condensed phase, M-GO may slow down the mass transfer and suppress the dripping behavior.32 This leads to the remarkable decrease of the volatilization speed of fuel gas from PLA. Thus, the flame retardancy, in terms of LOI and UL94, increases with the loading of M-GO.
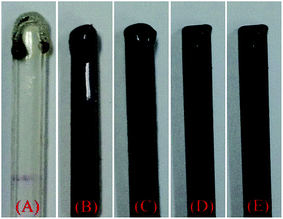 | ||
| Fig. 3 Digital images of the specimens after the LOI test: (A) PLA, (B) PLA/3BPPT, (C) PLA/2.7BPP7/0.3M-GO, (D) PLA/2.4BPPT/0.6M-GO, (E) PLA/2.1BPPT/0.9M-GO. | ||
However, as the main flame retardant, BPPT imparts flame retardancy to PLA via the gas phase and an accelerated dripping action.25 The addition of M-GO led to the decrease in the amount and volatilization speed of the decomposed gas products evolving from BPPT, which might affect the BPPT function as a gas-phase flame retardant. Therefore, when the content of M-GO exceeds a certain amount, both the LOI value and UL94 grade lowered.
3.3 Cone calorimetric test
Cone calorimetry is a widely used bench-scale technique to simulate a real fire scenario and provides abundant information on the combustion behavior of a material.33 The parameters obtained from cone calorimetry performed in this study at a heat flux of 35 kW m−2 (time to ignition (TTI), peak of heat release rate (pHRR), total heat release (THR), residual mass and total smoke release (TSR)) are listed in Table 2. The typical curves of HRR vs. time, THR vs. time and TSR vs. time are shown in Fig. 4 (A)–(C), respectively.| Sample | TTI (s) | pHRR (kW m−2) | THR (MJ m−2) | TSR (m2 m−2) | Residual mass (wt%) |
|---|---|---|---|---|---|
| PLA | 64 ± 1 | 393 ± 5 | 67.1 ± 0.5 | 5.2 ± 0.1 | 0.5 ± 0.1 |
| PLA/3BPPT | 72 ± 2 | 370 ± 16 | 65.6 ± 0.6 | 216 ± 23 | 1.0 ± 0.3 |
| PLA/2.7BPPT/0.3M-GO | 64 ± 3 | 376 ± 13 | 64.8 ± 0.9 | 155 ± 15 | 2.5 ± 0.4 |
| PLA/2.4BPPT/0.6M-GO | 59 ± 1 | 384 ± 6 | 63.6 ± 1.7 | 150 ± 23 | 1.9 ± 0.2 |
| PLA/2.1BPPT/0.9M-GO | 61 ± 2 | 373 ± 4 | 64.9 ± 0.4 | 112 ± 18 | 1.6 ± 0.3 |
 | ||
| Fig. 4 Heat release rate (A), total heat release (B) and total smoke release (C) versus time curves of PLA and its flame retardant composites. | ||
When neat PLA was ignited, the flame spread rapidly on the entire surface and displayed pHRR and THR values of 393 kW m−2 and 67.1 MJ m−2, respectively. After the addition of BPPT in PLA, the TTI of PLA/3BPPT was prolonged from 64 s to 72 s. Moreover, the THR and pHRR values of PLA/3BPPT decreased to 65.6 MJ m−2 and 370 kW m−2, respectively, indicating that the BPPT improves the fire resistance of PLA. After the loading of M-GO in PLA/BPPT, the average THR values first decreased and then increased again when the M-GO content increased to 0.9 wt% compared with that of PLA/3BPPT, which is in accordance with the LOI and UL94 test results. BPPT is a gas-phase active flame retardant.25 The phosphorus-containing compounds evolved from the thermal degradation of BPPT are primarily responsible for the BPPT-induced flame retardancy properties of PLA. As mentioned above, excess loading of M-GO might inhibit the volatilization speed of the decomposed gas products of BPPT due to its barrier effect. Therefore, the best flame retardancy should be obtained at the appropriate ratio.
An improved performance in terms of decreased TSR was noticed as shown in Table 2 and Fig. 4(C). As for PLA/BPPT, the loading of BPPT in PLA greatly increased the TSR values as compared to neat PLA, which is ascribed to the incomplete combustion of PLA. On increasing the amount of M-GO in PLA, the TSR values decreased from 216 to 112 m2 m−2. It is well known that GO can form a “tortuous path” to delay the diffusion of flammable pyrolytic gas products,34,35 which could be deemed as a good gas barrier to suppress the production of smoke. This can be proved by the dispersion morphology of M-GO, as shown in Fig. 2, in which the tactoid-like layer structure could form a barrier to hamper the diffusion of the fuel produced by the decomposition of PLA. Since the M-GO sheets increase with the increase in loading of M-GO from 0.3 wt% to 0.9 wt%, the barriers also increase. Therefore, the TSR is decreased with the loading range of M-GO investigated in this study.
Moreover, the PLA/BPPT/M-GO systems displayed shortened TTIs compared to that of neat PLA and PLA/BPPT, which may be ascribed to the early degradation of PEI in M-GO and the high thermal conductivity of GO.36,37
3.4 Analysis of residual char after the CONE tests
The digital photos of char residues after the CONE tests for the PLA/3BPPT and PLA/BPPT/M-GO composites are shown in Fig. 5. All the flame retardant PLA had very thin char layers with visible cracks after the CONE tests. In order to clarify the flame retardant mechanism in the condensed phase, the char layer was further studied through Raman spectra and SEM photographs.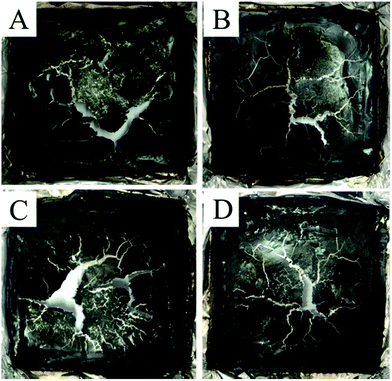 | ||
| Fig. 5 Digital photos of char residues after the CONE test for PLA/3BPPT (A), PLA/2.7BPP7/0.3M-GO (B), PLA/2.4BPPT/0.6M-GO (C) and PLA/2.1BPPT/0.9M-GO (D). | ||
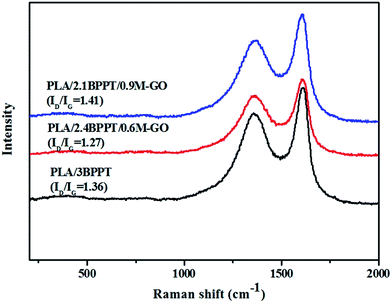
The Raman spectra of the residual char after the CONE tests of the PLA/3BPPT and PLA/BPPT/M-GO composites are shown in Fig. 6. It is clearly observed that there are two peaks in the Raman spectra, which are at about 1354 cm−1 (D-band) and 1601 cm−1 (G-band). Normally, the D-band corresponds to disordered graphite or glassy carbons, while the G-band represents the stretching vibration mode of E2g symmetry in the aromatic layers of crystalline graphite.38,39 The ID/IG values are the ratios of the corresponding peak areas. As shown in Fig. 6, the values of ID/IG of all the flame retardant PLA samples vary from 1.27 to 1.41, which indicates that all the major constituents of char correspond to amorphous carbon.40 However, compared with the ID/IG values of the spectra shown in Fig. 6, PLA/2.4BPPT/0.6M-GO has the lowest value (ID/IG = 1.27), which indicates that its char has the highest graphitization degree among these flame retardant PLA samples. Since the residual char with a higher graphitization degree consists of more aromatic compounds, the char quality is improved.41 Therefore, from the condensed phase perspective, PLA/2.4BPPT/0.6M-GO could lead to the formation of a more effective char layer to protect the matrix from the heat flux. This may be ascribed to the loading of M-GO in PLA, which may facilitate the improvement of the graphitization degree of the char. However, when the M-GO content reached 0.9 wt%, the ID/IG value increased again, indicating a weakened protective property. Such results are consistent with that of the LOI, UL94 and CONE tests. It is hypothesized that the higher increase in viscosity due to excess M-GO may result in the restricted flexibility of the char, which then affects the ordered arrangement of carbon and leads to an unorganized carbon structure.
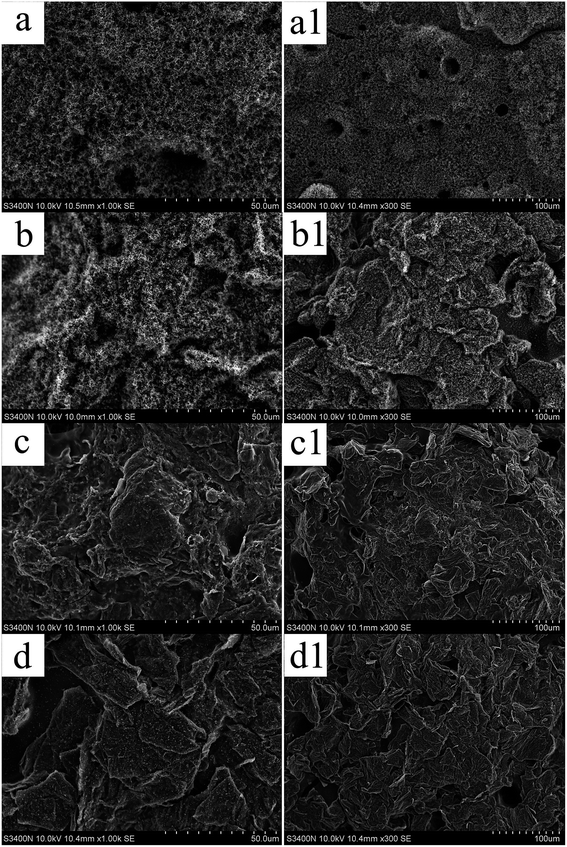
The microstructures of the carbonaceous residue of PLA/BPPT and PLA/BPT/M-GO were characterized by SEM and are shown in Fig. 7. As shown in Fig. 7(a) and (a1), the char of PLA/3BPPT was very loose with many holes on its surface. After the 0.3 wt% loading of M-GO, the loose degree of the char layer was weakened and the continuity was visibly improved (see Fig. 7(b) and (b1)). When the M-GO content was increased to 0.6 wt%, a compact char layer was obtained, as shown in Fig. 7(c) and (c1), indicating its good protective and insulating ability against heat and fire. This is also evidenced by the results of the other flame retardant tests such as LOI, UL94 and CONE. With a further increase in M-GO content up to 0.9 wt%, the accumulation of flake char was observed (Fig. 7(d) and (d1)), implying that the flexibility of the molten char during the CONE test is restricted. Then, a discontinuous char was obtained and the holes appeared to increase again, which can result in the decreased LOI value, UL94 rating and the increased THR as expected.
According to the above discussion, besides the physical barrier effect, M-GO can also affect the quality of the char layer, which can imply that M-GO may also act a as flame retardant in the condensed phase mechanism.
3.5 Thermal degradation behavior
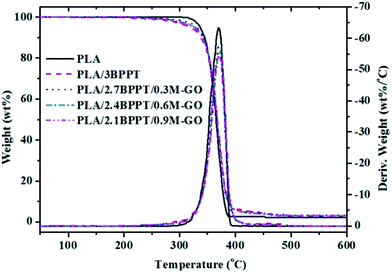
TGA is a widely used method to evaluate thermal stability and thermal decomposition behaviors at various temperatures by measuring the degradation temperature at which 5% mass loss occurs (T5%), the temperature for the maximum degradation rate (Tmax), and the residual mass. The TG and DTG curves of neat PLA, PLA/BPPT and PLA/BPPT/M-GO are shown in Fig. 8 and the relevant data is tabulated in Table 3. As shown in Table 3, the T5% of flame retardant PLA composites containing BPPT and M-GO range from 321 to 334 °C, which are lower than that of neat PLA (343 °C) because of the low thermal stability of BPPT and M-GO. However, the Tmax of neat PLA and its flame retardant system appeared at nearly the same temperature range, suggesting that the flame retardant exerted a negligible effect on the main degradation step of PLA. In addition, the residual weight increased slightly on increasing the M-GO content, which is in accordance with the results of the CONE tests.| Sample | T5% (°C) | Tmax (°C) | Residue weight (wt%) |
|---|---|---|---|
| PLA | 343 | 378 | 0.4 |
| PLA/3BPPT | 321 | 380 | 0.8 |
| PLA/2.7BPPT/0.3M-GO | 327 | 378 | 1.7 |
| PLA/2.4BPPT/0.6M-GO | 327 | 380 | 1.9 |
| PLA/2.1BPPT/0.9M-GO | 334 | 380 | 1.7 |
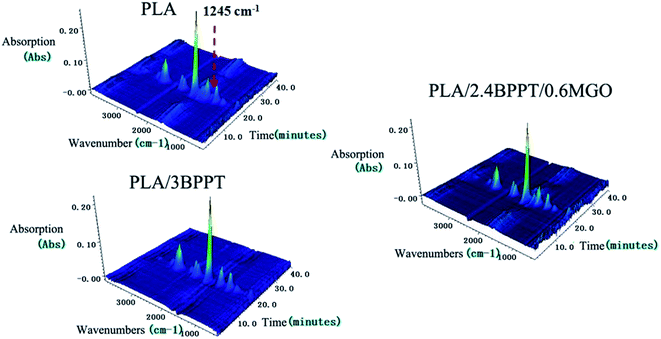
To further examine the thermal degradation behavior, the TGA-FTIR technique was employed to identify the evolved gaseous products during the thermal decomposition of neat PLA, PLA/3BPPT and PLA/2.4BPPT0.6M-GO in N2 atmosphere. The 3D images of the evolved gaseous products during the TG tests are presented in Fig. 9. It is clearly seen that the main decomposition products of the flame retardant PLA were not much different as compared to the neat PLA.
The comparison of the total absorption curves of these three systems is presented in Fig. 10. It is found that the peak intensity of the total absorption of PLA, PLA/3BPPT and PLA/2.4BPPT/0.6M-GO were nearly same, which differs from the results of the CONE test. This may be ascribed to the difference in the dimension of the samples required in TG-FTIR and CONE tests. In the TG-FTIR test, only a few milligrams are tested, which may weaken the effect of BPPT and M-GO during thermal decomposition.
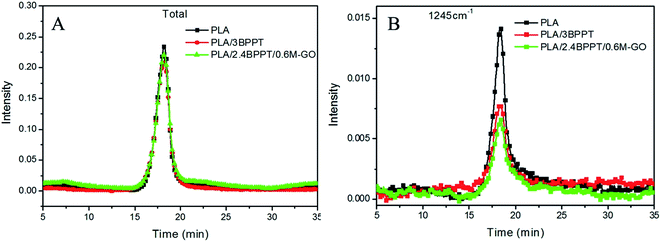 | ||
| Fig. 10 Total absorption curves vs. time (A) and absorbance at 1245 cm−1 vs. time (B) curves of PLA PLA/3BPPT and PLA/2.4BPPT/0.6M-GO. | ||
However, it is interesting to observe that the absorption intensity of the peak at 1245 cm−1 for PLA/3BPPT and PLA/2.4BPPT/0.6M-GO decreased remarkably (Fig. 10), which is caused by the phosphorus-containing decomposition compound obtained from the thermal degradation of BPPT.25 This result is similar to a previously reported study, which concluded that the phosphorous-containing compounds were considered to accelerate the radical reactions.16 During this process, fewer C–O containing compounds (1245 cm−1) volatilize to the gas phase.
3.6 Mechanical properties
The mechanical properties of neat PLA and its flame retardant composites were measured by tensile tests. Fig. 11 shows the typical strain–stress curves (A) and the tensile strength and elongation at break (B). Neat PLA is a brittle material and shows an elongation at break of only 8% during tensile tests. The intrinsic brittleness of the neat PLA matrix results in catastrophic fracture because of the lack of energy-absorbing events and the entanglement of the molecular chain during the crack propagation. After 3 wt% BPPT was incorporated, the resultant material became more brittle with an elongation at break of 5.2%, which is presumably due to the impact of BPPT on the crystallization behavior of PLA.25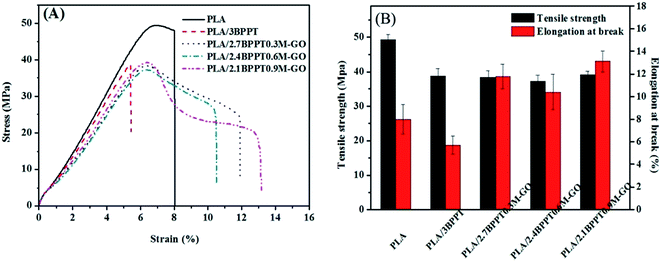 | ||
| Fig. 11 Typical stress–strain curves (A), tensile strength and elongation at break (B) of PLA and its flame retardant composites. | ||
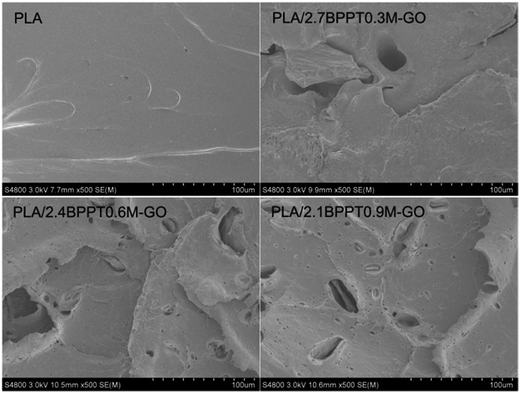
When M-GO was added into the system, the mechanical behavior changed from brittle to ductile, as observed from the stress–strain curves. Specifically, the PLA/2.1BPPT0.9GO composite displayed an elongation at break value of 13.1%. Moreover, the tensile strength is 39.1 MPa, which is not severely depreciated compared with neat PLA. This is because the abundant amine groups at the surface of M-GO can form a large number of hydrogen bonds with the PLA matrix,26 which make the M-GO particles act as stress concentrators. The localized stress field surrounding the M-GO particles may form a microcrack zone and cause debonding between the particles and the PLA matrix.42 The debonding of the M-GO from the PLA matrix can dissipate a significant amount of energy, which leads to an increase in toughness. After debonding, the plastic deformation around the GO also absorbs a large amount of energy. Both these factors contribute to the overall improved toughness.43,44 The SEM photographs of the samples' cross sections obtained from the tensile tests are shown in Fig. 12. It was found that the fracture surface of the pure PLA was smooth. After the loading of BPPT and M-GO, the fracture surfaces became rather scraggly and deformation around M-GO was observed, which implies that the plastic deformation and effective crack deflection was induced by M-GO during tensile fracture.
4 Conclusion
In summary, the combination of BPPT and M-GO on the fire performance and mechanical properties of PLA was investigated. An efficient flame retardant PLA composite was obtained through the incorporation of 2.4 wt% BPPT and 0.6 wt% M-GO in the polymer matrix. The PLA composites achieved a UL94 V0 rating as well as a high LOI value of 36.0. Furthermore, the total amount (only 3 wt%) of BPPT and M-GO in PLA induced a lower THR compared with those of neat PLA. The combined gas phase and condensed phase mechanism is primarily accountable for the good flame retardant behavior. Moreover, compared to neat PLA, the PLA/BPPT/M-GO composites exhibited improved toughness as evidenced by the tensile property of prolonged elongation at break. PLA/2.1BPPT/0.9GO displayed an elongation at break of 13.1%, which is better than that of neat PLA (8%). This study demonstrates a highly efficient flame retardant PLA composite of biomass-derived BPPT and M-GO with improved toughness.Conflicts of interest
There are no conflicts to declare.Acknowledgements
This work was supported by the National Natural Science Foundation of China (grant number 51628302), the Ningbo Science and Technology Innovation Team (grant number 2015B11005) and the Natural Science Foundation of Ningbo (grant number 2016A610209).References
- R. E. Drumright, P. R. Gruber and D. E. Henton, Adv. Mater., 2000, 12, 1841–1846 CrossRef CAS.
- B. Gupta, N. Revagade and J. Hilborn, Prog. Polym. Sci., 2007, 32, 455–482 CrossRef CAS.
- D. Garlotta, J. Polym. Environ., 2001, 9, 63–84 CrossRef CAS.
- T. Li, J. Zhang, D. K. Schneiderman, L. F. Francis and F. S. Bates, ACS Macro Lett., 2016, 5, 359–364 CrossRef CAS.
- C. X. Zhao, Y. Liu, D. Y. Wang, D. L. Wang and Y. Z. Wang, Polym. Degrad. Stab., 2008, 93, 1323–1331 CrossRef CAS.
- L. Chen and Y. Z. Wang, Polym. Adv. Technol., 2010, 21, 1–26 Search PubMed.
- S. Bourbigot and G. Fontaine, Polym. Chem., 2010, 1, 1413–1422 RSC.
- T. C. Mauldin, M. Zammarano, J. W. Gilman, J. R. Shields and D. J. Boday, Polym. Chem., 2014, 5, 5139–5146 RSC.
- S. Bourbigot, M. Le Bras and R. Delobel, Carbon, 1993, 31, 1219–1230 CrossRef CAS.
- S. Levchik, G. Levchik, G. Camino and L. Costa, J. Fire Sci., 1995, 13, 43–58 CrossRef CAS.
- C. H. Ke, J. Li, K. Y. Fang, Q. L. Zhu, J. Zhu, Q. Yan and Y. Z. Wang, Polym. Degrad. Stab., 2010, 95, 763–770 CrossRef CAS.
- J. X. Feng, S. P. Su and J. Zhu, Polym. Adv. Technol., 2011, 22, 1115–1122 CrossRef CAS.
- K. Bocz, B. Szolnoki, A. Marosi, T. Tabi, M. Wladyka-Przybylak and G. Marosi, Polym. Degrad. Stab., 2014, 106, 63–73 CrossRef CAS.
- C. Reti, M. Casetta, S. Duquesne, S. Bourbigot and R. Delobel, Polym. Adv. Technol., 2008, 19, 628–635 CrossRef CAS.
- Z. Li, P. Wei, Y. Yang, Y. Yan and D. Shi, Polym. Degrad. Stab., 2014, 110, 104–112 CrossRef CAS.
- X. Zhao, F. R. Guerrero, J. Llorca and D. Y. Wang, ACS Sustainable Chem. Eng., 2016, 4, 202–209 CrossRef CAS.
- P. A. Song, L. H. Xu, Z. H. Guo, Y. Zhang and Z. P. Fang, J. Mater. Chem., 2008, 18, 5083–5091 RSC.
- X. Wen, J. Gong, H. Yu, Z. Liu, D. Wan, J. Liu, Z. Jiang and T. Tang, J. Mater. Chem., 2012, 22, 19974–19980 RSC.
- P. A. Song, H. Liu, Y. Shen, B. X. Du, Z. P. Fang and Y. Wu, J. Mater. Chem., 2009, 19, 1305–1313 RSC.
- A. Edenharter, P. Feicht, B. Diar-Bakerly, G. Beyer and J. Breu, Polymer, 2016, 91, 41–49 CrossRef CAS.
- S. Bourbigot and S. Duquesne, J. Mater. Chem., 2007, 17, 2283–2300 RSC.
- R. Wang, D. X. Zhuo, Z. X. Weng, L. X. Wu, X. Y. Cheng, Y. Zhou, J. L. Wang and B. W. Xuan, J. Mater. Chem. A, 2015, 3, 9826–9836 CAS.
- X. Wang, W. Y. Xing, X. M. Feng, B. Yu, L. Song and Y. Hu, Polym. Chem., 2014, 5, 1145–1154 RSC.
- S. D. Jiang, Z. M. Bai, G. Tang, L. Song, A. A. Stec, T. R. Hull, J. Zhan and Y. Hu, J. Mater. Chem. A, 2014, 2, 17341–17351 CAS.
- J. Jing, Y. Zhang, X. L. Tang and Z. P. Fang, RSC Adv., 2016, 6, 49019–49027 RSC.
- Y. Lin, K. Y. Zhang, Z. M. Dong, L. S. Dong and Y. S. Li, Macromolecules, 2007, 40, 6257–6267 CrossRef CAS.
- H. L. Guo, M. Peng, Z. M. Zhu and L. N. Sun, Nanoscale, 2013, 5, 9040–9048 RSC.
- L. M. Zhang, Z. X. Lu, Q. H. Zhao, J. Huang, H. Shen and Z. J. Zhang, Small, 2011, 7, 460–464 CrossRef CAS PubMed.
- H. Kim, R. Namgung, K. Singha, I. K. Oh and W. J. Kim, Bioconjugate Chem., 2011, 22, 2558–2567 CrossRef CAS PubMed.
- B. Chen, M. Liu, L. M. Zhang, J. Huang, J. L. Yao and Z. J. Zhang, J. Mater. Chem., 2011, 21, 7736–7741 RSC.
- D. F. Wu, Y. X. Cheng, S. H. Feng, Z. Yao and M. Zhang, Ind. Eng. Chem. Res., 2013, 52, 6731–6739 CrossRef CAS.
- Y. Q. Shi, X. D. Qian, K. Q. Zhou, Q. B. Tang, S. H. Jiang, B. B. Wang, B. Wang, B. Yu, Y. Hu and R. K. K. Yuen, Ind. Eng. Chem. Res., 2013, 52, 13654–13660 CrossRef CAS.
- D. Price, Y. Liu, T. R. Hull, G. J. Milnes, B. K. Kandola and A. R. Horrocks, Polym. Degrad. Stab., 2002, 77, 213–220 CrossRef CAS.
- H. F. Pan, B. H. Yu, W. Wang, Y. Pan, L. Song and Y. Hu, RSC Adv., 2016, 6, 114304–114312 RSC.
- O. C. Compton, S. Kim, C. Pierre, J. M. Torkelson and S. T. Nguyen, Adv. Mater., 2010, 22, 4759–4763 CrossRef CAS PubMed.
- Y. Q. Han, Y. Wu, M. X. Shen, X. L. Huang, J. J. Zhu and X. G. Zhang, J. Mater. Sci., 2013, 48, 4214–4222 CrossRef CAS.
- N. N. Hong, J. Zhan, X. Wang, A. A. Stec, T. R. Hull, H. Ge, W. Y. Xing, L. Song and Y. Hu, Composites, Part A, 2014, 64, 203–210 CrossRef CAS.
- Z. Y. Sun, J. Masa, Z. M. Liu, W. Schunhmann and M. Muhler, Chem. - Eur. J., 2012, 18, 6972–6978 CrossRef CAS PubMed.
- M. LeBras, S. Bourbigot, Y. LeTallec and J. Laureyns, Polym. Degrad. Stab., 1997, 56, 11–21 CrossRef CAS.
- N. H. Huang, Z. J. Chen, J. Q. Wang and P. Wei, eXPRESS Polym. Lett., 2010, 4, 743–752 CrossRef CAS.
- Q. Tai, R. K. K. Yuen, W. Yang, Z. Qiao, L. Song and Y. Hu, Composites, Part A, 2012, 43, 415–422 CrossRef CAS.
- Y. T. Park, Y. Qian, C. Chan, T. Suh, M. G. Nejhad, C. W. Macosko and A. Stein, Adv. Funct. Mater., 2015, 25, 575–585 CrossRef CAS.
- J. Ma, M. S. Mo, X. S. Du, P. Rosso, K. Friedrich and H. C. Kuan, Polymer, 2008, 49, 3510–3523 CrossRef CAS.
- Y. Wang, X. Yang, H. Peng, F. Wang, X. Liu, Y. Yang and J. Hao, ACS Appl. Mater. Interfaces, 2016, 8, 9925–9935 CAS.
Footnote |
| † Electronic supplementary information (ESI) available. See DOI: 10.1039/c7ra12224a |
| This journal is © The Royal Society of Chemistry 2018 |

