
 Open Access Article
 This Open Access Article is licensed under a Creative Commons Attribution-Non Commercial 3.0 Unported Licence
Energy transfer between rare earths in layered rare-earth hydroxides†
Pingping Feng,
Xinying Wang,
Yushuang Zhao,
De-Cai Fang and
Xiaojing Yang*
and
Xiaojing Yang*
Beijing Key Laboratory of Energy Conversion and Storage Materials, College of Chemistry, Beijing Normal University, Beijing, 100875, China. E-mail: yang.xiaojing@bnu.edu.cn; Fax: +86-10-5880-2075; Tel: +86-10-5880-2960
First published on 17th January 2018
Abstract
Energy transfer between rare earths in layered rare-earth hydroxides (LRHs) is worth the intensive study because the hydroxyls that act as the bridge connecting the neighbouring rare earths would generate non-radiative transitions. This study focuses on the energy transfer in the intralayer and the adjacent layers of LRHs. A series of LEuxTb1−xHs (x = 0, 0.05, 0.2, 0.5, 0.8, and 0.95) was synthesized, the basal spacing (dbasal) was adjusted from 8.3 to 46 Å through ion-exchange process, and unilamellar nanosheets were prepared through a delamination process. The luminescence behaviours of the samples demonstrated the following: (1) for the delaminated nanosheets, the quenching effect of both Eu3+ and Tb3+ was hardly observed. This implies that in the intralayer, the efficiency of energy transfer is extremely low, so that highly-concentrated co-doping does not influence the luminescence and by controlling the Eu/Tb molar ratio, white light can be obtained. (2) For small dbasal, e.g., 27 Å, the fluorescence quenching of Tb3+ and Eu3+ was remarkable, while for large dbasal, e.g., 46 Å, the emission of Tb3+ emerged and the self-quenching between Eu3+ ions weakened. (3) The energy transfer efficiency deceased with an increase in the distance between adjacent layers. In other words, either the energy transfer between Eu3+ and Tb3+ or the energy migration between Eu3+ ions was more efficient when they were located in adjacent layers than in intralayers even when they were the nearest neighbours.
Introduction
Rare earths, owing to their attractive optical properties arising from the 4f electronic shells,1 play an important role in the development of optical materials. Because of the extremely close radii, it is easy to dope several types of rare earth ions into the same host matrix to realize the tuneable emission colour of luminescence materials.2 Simultaneously, due to the interaction effects among rare earths,3 the luminescence intensities of a particular rare earth would be enhanced or quenched with the co-doping of other rare earths.4 For example, the investigation on energy transfer between Eu3+ and Tb3+ in Tb2(WO4)3:Eu3+ indicated that with an increase of the doped Eu3+ concentration, the emission of Tb3+ became weaker, accompanying the concentration quenching of Eu3+.5 Such behaviour was also extensively investigated in many other solid phases, such as TbBO3,6 NaTbF4:Eu,7 SrTiO3,8 and TbPO4.9Layered rare earth hydroxides (LRHs), with a general formula of Ln2(OH)6−mAm·nH2O (0.5 ≤ m ≤ 2.0, where Ln stands for trivalent rare earths and A for interlayer anions),10 are attracting increasing attention since Gándara et al. reported their findings in 2006.11 OH− groups (and H2O in some cases of m) coordinate with Ln to form polyhedra and act as the bridge connecting the neighbouring rare earths to form the layer; the layers stack to form the layered structure with interlayer gallery containing A and water. Recently, intercalation, ion exchange, and delamination into 2D crystals have been intensively studied due to LRHs' unique physicochemical properties.12 LRHs can be also used as an ideal precursor to produce oxide phosphors13 and the up-conversion host matrix β-NaYF4,14 bringing new opportunities for LRHs in practical applications. However, only a few studies on energy transfer in LRHs have been reported. Li et al.15 found that for L(Y0.97−xTb0.03Eux)Hs (type m = 1), with an increase of Eu3+ concentration, the emission of Tb3+ became weaker, suggesting that the energy transferred from Tb3+ to Eu3+; the same result was observed in PMMA@SA-LGdH:Tb0.5−xEux (x = 0–0.50).16 Although it is well known that the coordinated OH−/H2O would generate efficient non-radiative emission for the de-excitation of rare earths,17 this effect of OH−/H2O on energy transfer between the rare earths in LRHs has not been studied extensively. Furthermore, this effect and the structural features of LRHs arouse another issue: the energy transfer between the adjacent layers is different from that in the intralayer due to the layered structure.
To clarify these issues, in this study, we synthesized a series of LEuxTb1−xHs (x = 0–0.95) and changed the interlayer distances to a large extent. According to the photoluminescence investigation results, we propose a model for the energy transfer in LRHs.
Experimental
Synthesis of LEuxTb1−xHs (x = 0, 0.05, 0.2, 0.5, 0.8, and 0.95)
Eu2O3 and Tb4O7 were obtained from Shanghai Aladdin Bio-chem Technology Co., Ltd.; sodium dodecyl sulfate (NaDS), from Tianjin Bodi Chemical Co., Ltd; sodium oleate (NaOA), from J&K Scientific Co., Ltd.; and hexamethylenamine (HMT) and the other reagents from Xi Long Chemical Co., Ltd. Eu/Tb nitrate or hydrochloride was prepared from Eu2O3/Tb4O7 and the corresponding acid by recrystallization.Different A anion intercalated LRHs are referred as to A-LRHs below. Cl−- and NO3−-LEuxTb1−xHs (x = 0, 0.05, 0.2, 0.5, 0.8, and 0.95) were prepared through homogenous precipitation method.18 Briefly, the rare-earth salts were added into an aqueous solution of sodium salt (NaCl or NaNO3) and HMT at the molar ratios of (Eu + Tb) salts/sodium salt/HMT = 1/13/1, and then heated in a Teflon-lined stainless steel autoclave at 90 °C for 12 h. After air-cooling to room temperature, the resultant solid was centrifuged, washed with distilled water and then with anhydrous ethanol several times, and finally dried at 40 °C overnight.
DS−-LRHs were obtained by treating NO3−-LRHs (0.1 g) in NaDS (0.3708 g, keeping the molar ratio of DS−/NO3− = 3) aqueous solution (80 mL) via the DS−/NO3− ion exchange. After autoclaving at 70 °C for 2 days, the resultant solid was collected after filtering. Then, the solid was washed with deionized water and dried at 40 °C for 24 h. In addition, via the same method, OA−-LRHs were prepared by mixing 0.1 g NO3−-LRHs and 1.4982 g NaOA (OA−/NO3− = 12) in 80 mL deionized water and stirring for 24 h.
Synthesis of nanosheets of LRHs
The nanosheets (2D crystals) of the LRHs, noted as NSs-LRHs, were obtained by delamination of the DS−-LRHs samples (0.1 g) in formamide (50 mL)18 after being heated at 40 °C for 3 days. The nanosheets existed in formamide as a colloidal suspension.Characterization
Powder X-ray diffraction (XRD) measurement was performed with a Phillips X'Pert Pro MPD diffractometer with Cu-Kα radiation (λ = 0.1541 nm) at room temperature. The generator setting was 40 kV and 40 mA, with a step size of 0.017° and a scan time of 10 s per step. For a Rietveld refinement using the RIETAN-FP software,19 the XRD patterns were collected at room temperature with step size of 0.017°, scan time of 150 s per step, and 2θ ranging from 4.5° to 120°. At the final refinement, the temperature-factors of H2O were set to be equal to those of OH−.Fourier-transform infrared (FT-IR) spectra were recorded on a Nicolet-380 Fourier-transform infrared spectrometer using the KBr method. Eu and Tb contents were analysed by ICP atomic emission spectroscopy (Jarrell-ASH, ICAP-9000) after the solid samples dissolved in dilute HNO3 solution, and C, H and N contents were determined by Elementar Vario Elemental analyzer. Atomic force microscope (AFM) observation was carried out in a Veeco NanoScope IIIA microscope after the sample was deposited on a silicon wafer substrate.
Photoluminescence measurements were performed on a Shimadzu RF-5301PC spectrofluorophotometer equipped with a 150 W xenon lamp as the excitation source using monochromator slit widths of 5 nm for NSs-LRHs on both excitation and emission sides and 3 nm for the other samples. The luminescence decay curves were obtained by using Steady State & Time-resolved Fluorescence Spectrometer TemPro-01. All measurements were carried out at room temperature.
Results and discussion
Interlayer spacings and intralayer structure
Fig. 1A depicts the typical XRD patterns of the samples with different interlayer spacings of LEu0.5Tb0.5H. The arrangements of the interlayer species are shown in Fig. 1B. The diffraction patterns of the Cl−- (Fig. 1A(a)) and NO3−-LEu0.5Tb0.5H (Fig. 1A(b)) samples can be well indexed to orthorhombic (a = 12.874(1), b = 7.299(0), c = 8.439(4) Å) and monoclinic (a = 12.849(0), b = 7.119(1), c = 16.355(0) Å, β = 94.88(1)°) symmetries, respectively, as previously reported,20 but the two samples have similar basal spacing (dbasal) values (8.32 and 8.31 Å, respectively). Larger dbasal values are displayed in the samples with different organic anion galleries: ∼25 Å for DS− (Fig. 1A(c)) and ∼46 Å for OA− (Fig. 1A(d)). The latter value was also observed in OA−-LEuH and OA−-LTbH.21 The dbasal values can be construed according to the dimensions and the area per unit charge (Scharge) of the layers and the organic ions.22 Scharge values are 0.51 nm2 for OA− as calculated using the ChemOffice software,23 0.19 nm2 for DS−,18 and 0.23 nm2 for the layer calculated according to the lattice parameters of Cl−-LEu0.5Tb0.5H. The length is ∼22 Å for oleate21 and 18.2 Å for DS− and the thickness of the layer is 6.5 Å.18 Thus, for the OA−-LRH samples, the larger Scharge(OA−) value compared to Scharge (layer) implies a bilayer arrangement of OA− anions (Fig. 1B), which is in agreement between the predicted dbasal of (2 × 22 + 6.5=) 50.5 Å and the measured value of ∼46 Å. For the same reason, the Scharge(DS−) value are smaller than Scharge(layer) value, which allows an alternating antiparallel monolayer arrangement of DS− (Fig. 1B), which predicts a dbasal value of (18.2 + 6.5=) 24.7 Å, agreeing with the observed value of 25.3 Å (Fig. 1A(c)). The thickness of NSs-LEu0.5Tb0.5H was measured as 1.57 nm (Fig. 1C), indicating that the unilamellar were obtained.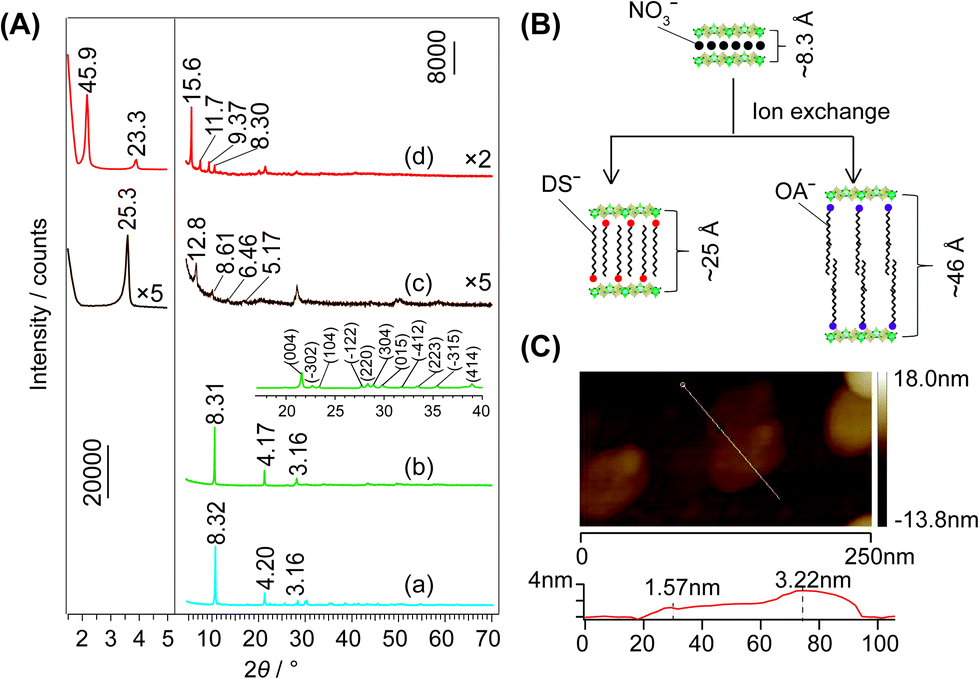 | ||
| Fig. 1 (A) XRD patterns of (a) Cl−-, (b) NO3−-, (c) DS−- and (d) OA−-LEu0.5Tb0.5H, (B) the schematic representation of the synthesis processes and the dbasal for the samples, and (C) AFM images of NSs-LEu0.5Tb0.5H, with the height profiles along the lines in the bottom panel. | ||
Altering x in LEuxTb1−xHs invokes barely remarkable dbasal changes for the entire Cl−- or NO3−-type samples as shown in the XRD patterns (Fig. S1, S2 and Table S1, ESI†). Moreover, the discrepancy of ∼0.1 Å, changing irregularly with x, could be explained by the very close natures of Eu3+ and Tb3+ ions. Conversely, the large difference of ∼1.0 Å in dbasal for the organic-type samples (Table S1, and Fig. S3, S4, ESI†) indicates the easy deformation of organic interlayer species. The chemical analysis for the Cl−- (Table S2, ESI†) and NO3−-LRHs samples (Table S3, ESI†) indicates good agreements between the formulae of m = 1 type LRHs (i.e. Ln2(OH)5(Ax)1/x·nH2O (ref. 10)) and the analysis results. For all the samples, the interlayer species except for Cl− are confirmed by the FT-IR spectra (Fig. S5–S7, ESI†). For DS−- and OA−-LEu0.5Tb0.5H, a scanning electron microscopy/energy-dispersive X-ray (SEM/EDX) observation indicated that each element, including Eu, Tb, C, and O (and S for DS−-LEu0.5Tb0.5H), was distributed uniformly in the samples (Fig. S8, ESI†).
In m = 1 type LRHs, two types of polyhedra, [Ln(OH)7(H2O)] and [Ln(OH)8(H2O)] (noted as LnO8 and LnO9, respectively), should exist. A LnO8 polyhedron links to two other LnO8 polyhedra and four LnO9 polyhedra via edge-sharing, forming the host layers.20a Eu3+ or Tb3+ ions in the space group P21212 have three Wyckoff sites, which are 2a, 2b and 4c, corresponding to LnO8, LnO8 and LnO9, respectively. In the co-doping case, the smaller ion Tb3+ (0.92 Å), rather than Eu3+ (0.95 Å),2 tends to be coordinated in LnO8,24 but the radial difference is too small to determine the distribution. As shown in Fig. 2A, three distribution models are proposed to conduct Rietveld refinements for Cl−-LEu0.5Tb0.5H using the analysed composition of Eu0.51Tb0.49(OH)2.45Cl0.42(CO3)0.06·0.87H2O (Table S2, ESI†). The refinement result based on the model of a random distribution (Fig. 2A(a)) is shown in Fig. 3 and Table 1. The calculated pattern is in good agreement with the measured pattern (Fig. 3); the R-factors (Table 1), the refined crystal model, and 3D electron density distribution image (Fig. 2B) are satisfactory. However, employing the other two models (Fig. 2A(b) and A(c)) leads to slight differences, including those in R-factors (Fig. S9, S10 and Table S4, S5, ESI†). It could be concluded that it is difficult to use the XRD technique to determine which model is preferred because the two rare earths have slight differences in radius and atomic scattering factor.25 It should be noted that we also combined the fluorescent theoretical calculation to determine the possible distribution of Eu3+ and Tb3+ in the layers, but in the system, it is difficult for LRHs to be calculated using Gaussian 09 programs.26 Fig. 4 presents the lattice parameters, calculated by the Rietveld refinements (Fig. S11–S14 and Table S6–S9, ESI†) as a function of Eu3+ contents. Both a and b increase linearly with the increase in Eu3+ content, thus following Vegard's law.27 This implies that continuous solid solutions were formed; the same has been reported in LRHs of Y/Eu,13b,28 Y/Tb29 and Eu/Gd,30 which can be explained by the slight distortion energy of the crystal lattice.29
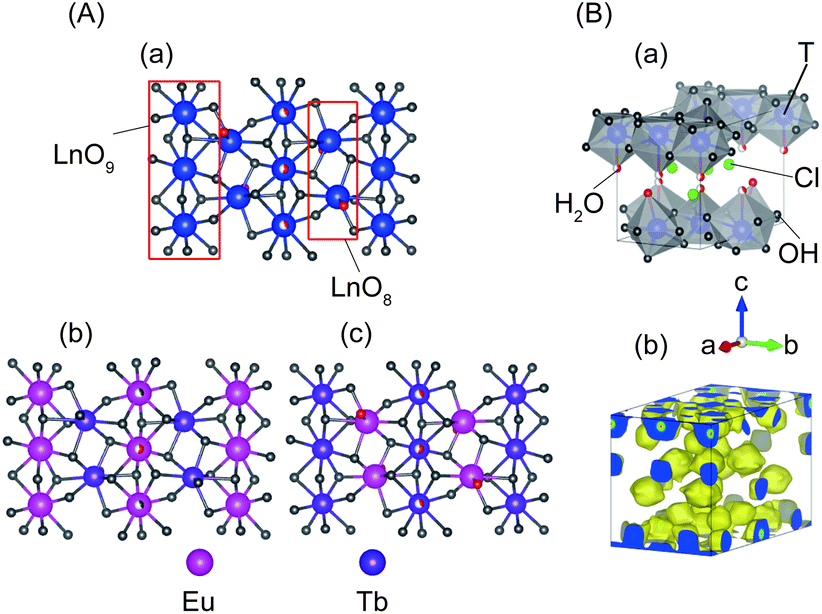 | ||
| Fig. 2 For Cl−-LEu0.5Tb0.5H with the space group P21212, (A) three Eu3+/Tb3+ distribution models of the layer projected along [001] directions, (a) random distribution, (b) Tb3+ in LnO8 and Eu3+ in LnO9, (c) Tb3+ in LnO9 and Eu3+ in LnO8; and (B) refined structural models based on the random distribution, (a) crystal structure, (b) 3D electron-density distribution image (isosurface density level of 0.5 Å−3). T stands for the rare earth Eu3+ or Tb3+. | ||
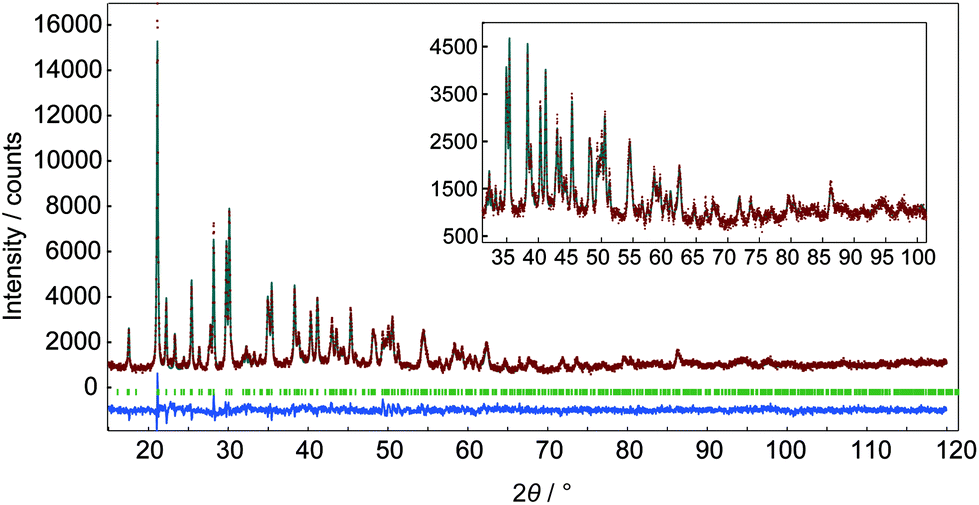 | ||
| Fig. 3 Fitting patterns of Cl−-LEu0.5Tb0.5H. The experimental and simulated intensities are plotted as dotted and solid lines, respectively; the line at the bottom is their intensity difference, the tick marks indicate the positions of all possible Bragg reflections from the structure model. | ||
| Species | Wyckoff index | x | y | z | g | B/Å2 |
|---|---|---|---|---|---|---|
| a Space group: P21212 (no. 18); a = 12.874(0) Å; b = 7.299(2) Å; c = 8.439(3) Å; V = 793.0(4) Å3; Rwp = 7.329%, Rp = 5.726%, RR = 19.458%, Re = 2.834%, S = 2.5864%. T stands for the rare earth Eu3+ or Tb3+, g stands for the occupancy, B stands for the temperature-factor. | ||||||
| T1 | 4c | 0.271(5) | 0.248(8) | 0.929(9) | 1.0 | 0.841(4) |
| T2 | 2b | 0 | 0.5 | 0.949(3) | 1.0 | 0.841(4) |
| T3 | 2a | 0 | 0 | 0.930(5) | 1.0 | 0.841(4) |
| OH(1) | 4c | 0.485(9) | 0.270(2) | 0.906(6) | 1.0 | 0.303(0) |
| OH(2) | 4c | 0.083(0) | 0.229(2) | 0.838(1) | 1.0 | 0.303(0) |
| OH(3) | 4c | 0.160(8) | 0.411(9) | 0.085(9) | 1.0 | 0.303(0) |
| OH(4) | 4c | 0.646(3) | 0.449(8) | 0.925(7) | 1.0 | 0.303(0) |
| OH(5) | 4c | 0.143(7) | 0.775(5) | 0.828(5) | 1.0 | 0.303(0) |
| H2O(1) | 4c | 0.198(1) | 0.827(2) | 0.378(3) | 1.0 | 2.922(5) |
| H2O(2) | 2b | 0 | 0.5 | 0.608(5) | 0.36 | 2.922(5) |
| H2O(3) | 2a | 0 | 0 | 0.629(0) | 0.54 | 2.922(5) |
| Cl | 4c | 0.125(6) | 0.216(9) | 0.430(9) | 1.0 | 2.723(7) |
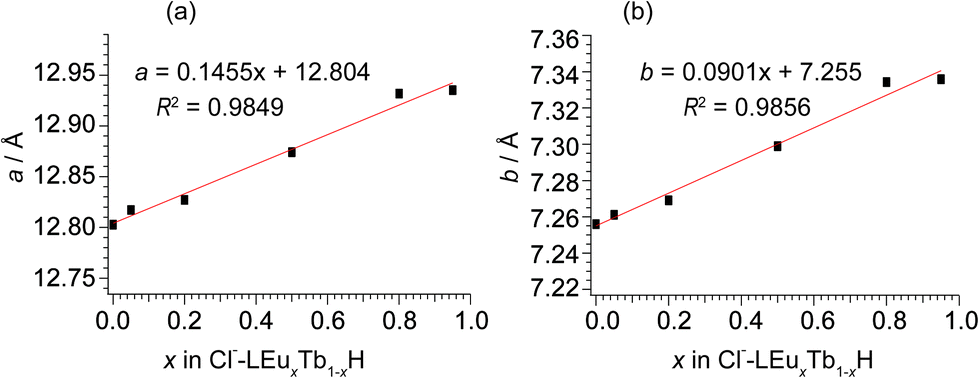 | ||
| Fig. 4 The correlation of lattice parameters of (a) a and (b) b with the Eu3+ content in Cl−-LEuxTb1−xHs. | ||
Photoluminescence of LRHs with different interlayer spacings
The emission and excitation spectra of NO3−- and DS−-LEuxTb1−xHs are shown in Fig. 5 and S15, ESI.† When x = 0, the excitation spectra (Fig. 5a, and S15a, ESI†) monitored with 544 nm emission of Tb3+ (5D4 → 7F5) consist of the characteristic f → f transition lines of Tb3+ from the 7F6 ground state to the different excited states. Moreover, upon excitation into the 7F6 → 5D3 transition of Tb3+ at 376 nm, the peaks in the emission spectra (Fig. 5b and S15b, ESI†) can be assigned to the characteristic emission of Tb3+, relating to 5D4 → 7Fj (j = 6, 5, 4, 3) levels at 489, 544, 584 and 620 nm.31 However, with Eu3+ doping, both NO3−- and DS−-LRHs samples primarily exhibit the characteristic emission of Eu3+, corresponding to 5D0 → 7F0,1,2,3,4 transitions, while the emission of Tb3+ is hardly observed (Fig. 5d and S15d, ESI†). The presence of the excitation bands of Tb3+ in the excitation spectra (Fig. 5c and S15c, ESI†) when monitored at 613 nm with 5D0 → 7F2 of Eu3+ indicates that an efficient energy transfer occurred from Tb3+ to Eu3+ in these samples,32 also suggesting that Eu3+ had been successfully doped into the LTbH lattice. When x < 0.5, the luminescence intensity of Eu3+ increases with the increasing Eu3+ concentration; however, when x ≥ 0.5, it becomes weaker and weaker. This result suggests that the luminescence of Eu3+ is a competitive result of a dual effect: (1) the increase of Eu3+ concentration enhances the probability of energy transfer from Tb3+ to Eu3+ and (2) it also increases the probability of nonradioactive energy migration between Eu3+ ions to quenching centres, where the excitation energy is lost nonradiatively.33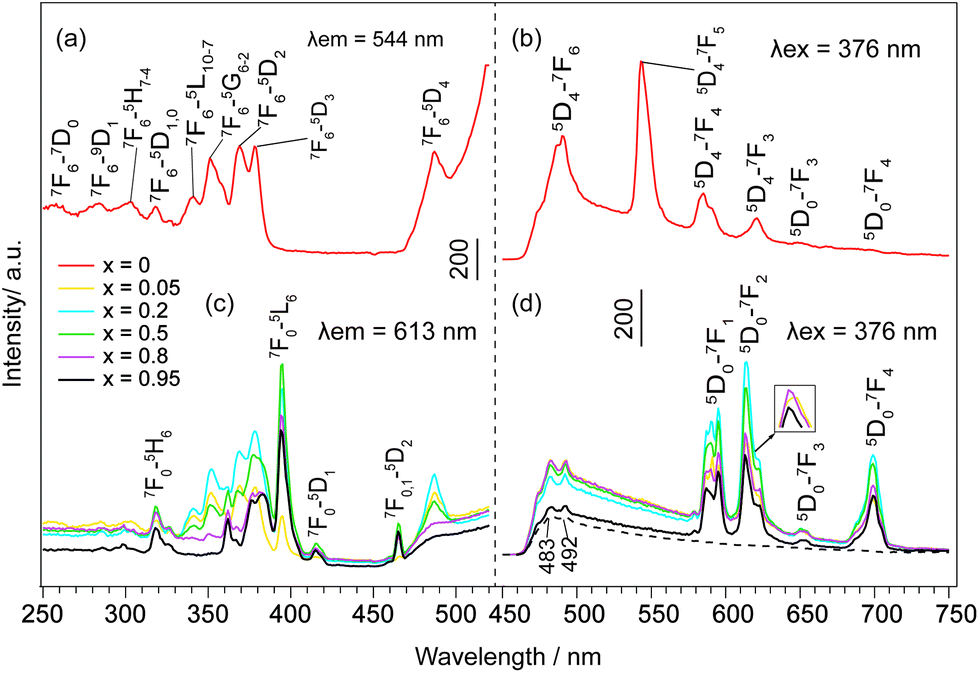 | ||
| Fig. 5 (a, c) Excitation and (b, d) emission spectra of NO3−-LEuxTb1−xHs. The peaks at 483 and 492 nm (dashed line) are due to spectral responses of the equipment by the blank. | ||
For OA−-LEuxTb1−xHs with larger dbasal, the luminescence behaviour changes greatly as compared to that of NO3− and DS−-LEuxTb1−xHs. In the excitation spectra monitored at 544 nm (Fig. 6A(a)), no matter whether Eu3+ is doped, the peaks attributed to the intra-4f8 transitions from 7F6 to 5L10–7, 5G6–2, and 5D2,3 states of Tb3+ are observable; as monitored with Eu3+ emission (Fig. 6A(b)), the excitation bands of Tb3+ still exist. Under 376 nm excitation, the characteristic emission of Tb3+ emerges noticeably. The luminescence intensity of Tb3+ decreases with increasing x from 0 to 0.95 and the intensity for Tb3+ at x = 0.05 is slightly lower than that at x = 0. When x < 0.8, the luminescence intensity of Eu3+ increases gradually with the increasing Eu3+ concentration; when x ≥ 0.8, it wears off (Fig. 6A(c)).
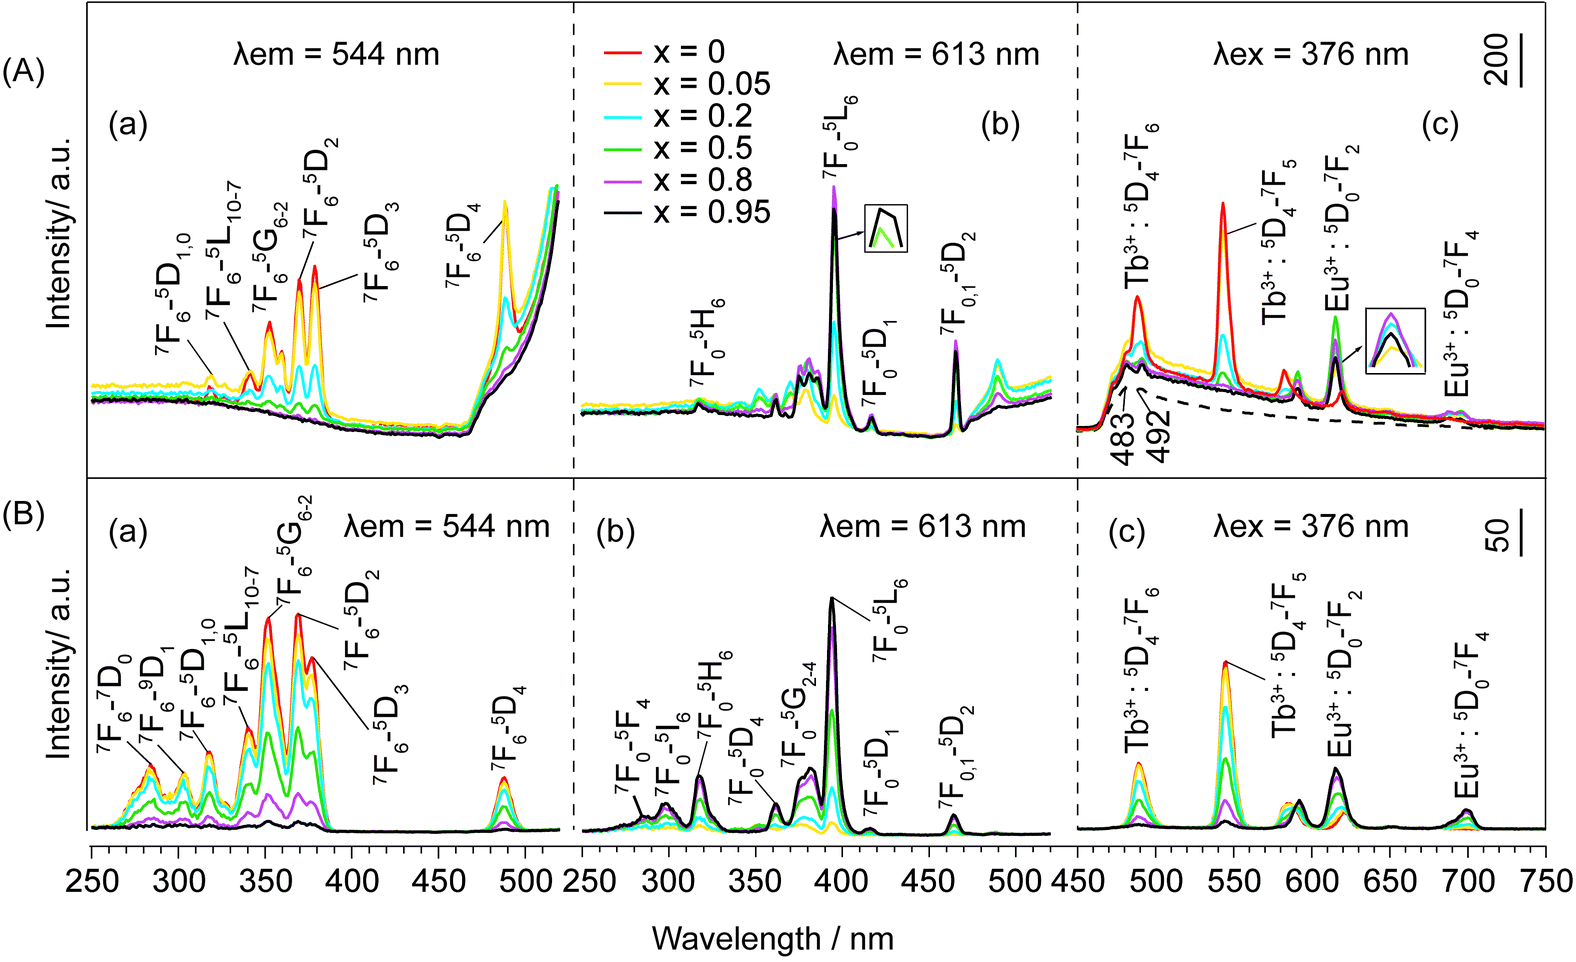 | ||
| Fig. 6 Excitation spectra monitored at (a) 544 nm, (b) 613 nm and emission spectra excited at (c) 376 nm of (A) OA−- LEuxTb1−xHs (the peaks at 483 and 492 nm of the dashed line are due to spectral responses of the equipment by the blank) and (B) NSs-LEuxTb1−xHs. | ||
Overall, under the same measurement condition, the quenching of Tb3+ weakens with the increase in dbasal, and the quenching concentration of Eu3+ observable at x = 0.5 for NO3−- and DS−-LEuxTb1−xHs and at x = 0.8 for OA−-LEuxTb1−xHs demonstrates that the expansion extent of the interlayer distances plays a decisive role in the energy transfer. Such energy transfers are realized primarily between the adjacent layers rather than in the intralayer, where the rare earths are even closer.
Photoluminescence of 2D crystals
In the case of exfoliated 2D crystals, an infinite interlayer distance or only the energy transfer in the intralayer could be reasonably considered. Under excitation at 376 nm, the emission spectra (Fig. 6B(c)) of NSs-LRHs show both luminescence intensities of Eu3+ and Tb3+ in proportion to their own concentrations. Furthermore, as monitored at λem = 613 nm, the very weak bands in the excitation spectra (Fig. 6B(b)) imply that only a small amount of energy was transferred from Tb3+ to Eu3+. This behaviour reveals that the energy transfer between the neighbouring rare earths in the intralayer could be negligible. This result is in agreement with the observations in the layered compounds discussed above.Fig. 7 shows the Commission International de L'Eclairage (CIE) chromaticity coordinates for NSs-LRHs excited at 284 and 318 nm. The related emission spectra are shown in Fig. S16, ESI.† The (x, y) coordinates vary systematically from green to red with the doped concentration of Eu3+, manifesting that the as-obtained NSs-LEuxTb1−xHs can show multicolour emissions in the visible region when excited by the selective excitation bands. It should be noted that the colour coordinate (0.3552, 0.3562) of x = 0.8 samples excited under 284 nm results in white light emission. It is inevitable to obtain the white light emission in the Eu3+ and Tb3+ co-doping 2D crystals because the energy transfer in the intralayer is negligible.
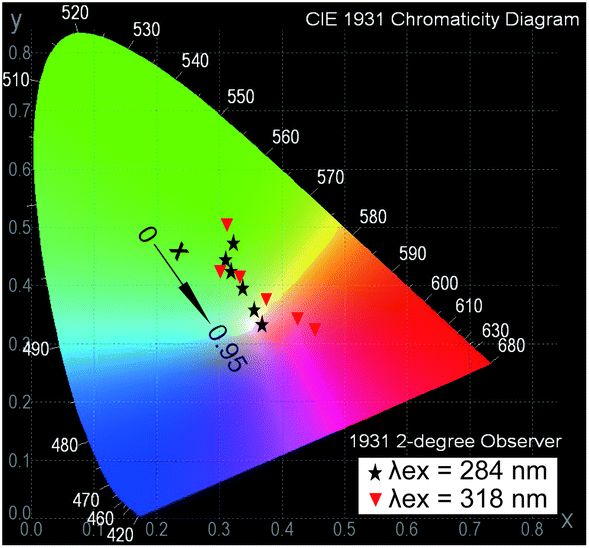 | ||
| Fig. 7 CIE chromaticity coordinates for NSs-LEuxTb1−xHs excited at 284 and 318 nm. | ||
Luminescence lifetimes
Two possible routes of energy transfer between Eu3+ and Tb3+ in LRHs are proposed in Scheme 1. Route (I), as shown in Scheme 1, represents that energy is transferred through the OH group, which bridges adjacent Eu3+ and Tb3+ located in the intralayer. The OH groups de-excite the energy transferred from Tb3+, making the transfer inefficient. In route (II), the energy is directly transferred from Tb3+ to Eu3+ as the two ions reside in the adjacent layers. The results discussed above indicate that the transfer would be more efficient through route (II) than route (I). In other words, route (II) might be the main procedure of energy transfer in LRHs. To further clarify this, we investigated the luminescence lifetimes for LTbH (x = 0) and LEu0.05Tb0.95H (x = 0.05). The luminescence decay curves of Tb3+ are depicted in Fig. 8.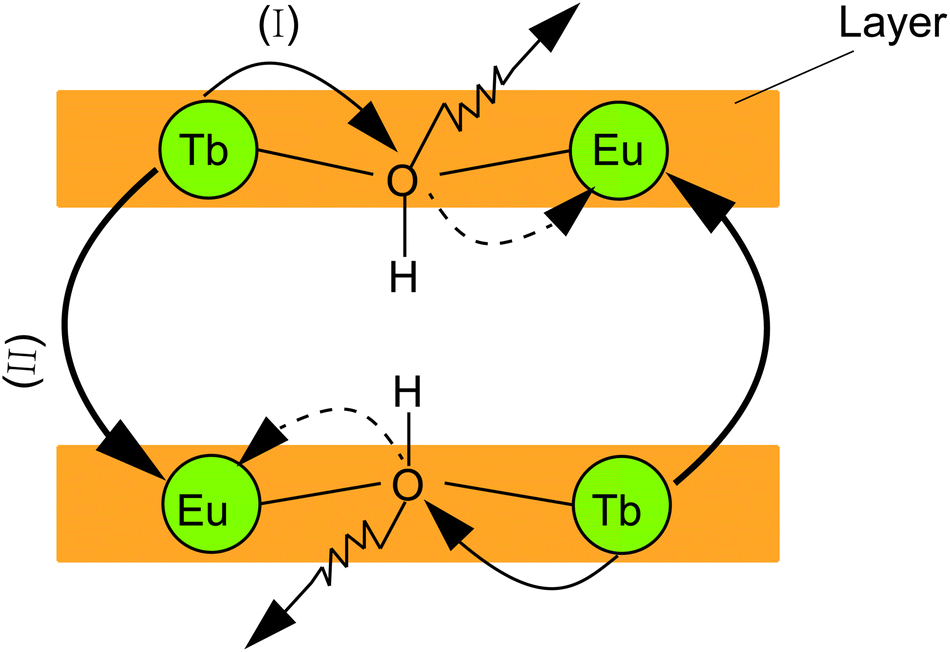 | ||
| Scheme 1 Illustration of energy transfer between Eu3+ and Tb3+ in LRHs. | ||
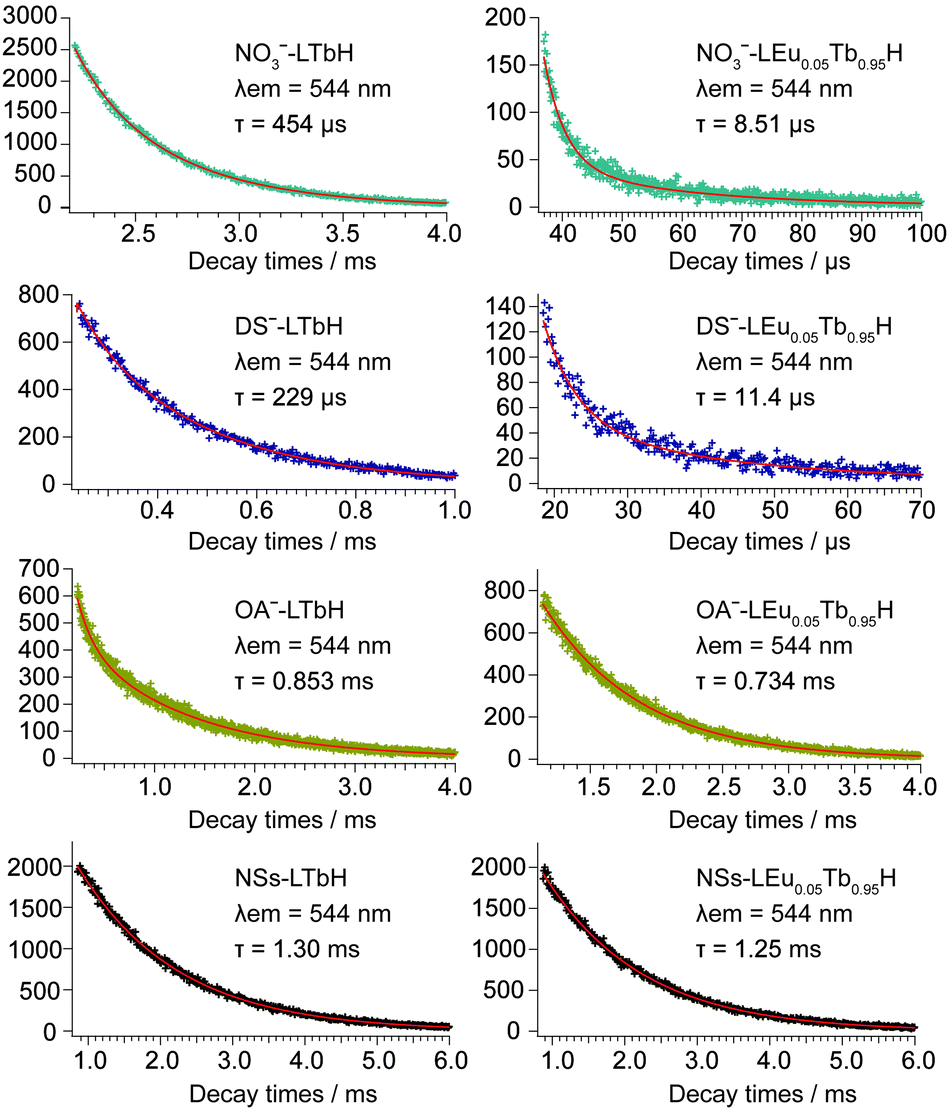 | ||
| Fig. 8 Luminescence decay curves of LTbH and LEu0.05Tb0.95H monitored at 544 nm, corresponding to 5D4–7F5 level of Tb3+. | ||
As shown in Fig. 8, the curves can be fitted into a double-exponential function according to eqn (1),
I(t) = I0 + A1![[thin space (1/6-em)]](https://www.rsc.org/images/entities/char_2009.gif) exp(−t/τ1) + A2exp(−t/τ2) exp(−t/τ1) + A2exp(−t/τ2)
| (1) |
| ηET = 1 − τ/τ0 | (2) |
| x | NO3− (μs) | DS− (μs) | OA− (ms) | NSs (ms) |
|---|---|---|---|---|
| 0 | 454 | 229 | 0.853 | 1.30 |
| 0.05 | 8.51 | 11.4 | 0.734 | 1.25 |
| ηET (%) | 98.1 | 95.0 | 14.0 | 3.85 |
The above results support strongly that the energy transfer between Eu3+ and Tb3+ in route (II), as illustrated in Scheme 1, is predominant in LRHs.
Conclusions
Due to the unique structure of LRHs, the de-excitation of OH groups on the energy transfer between rare earths is effective in the intralayer. This leads to the fact that the efficiency of the energy transfer from Tb3+/Eu3+ to Eu3+ in the intralayer is very weak, and efficient energy transfer is primarily achieved when the rare earths locate in adjacent layers. White light can be obtained in the 2D crystals of LEu0.8Tb0.2H under 284 nm. This might be of potential use as a natural white light source under ultraviolet light excitation.Conflicts of interest
There are no conflicts to declare.Acknowledgements
This study was supported by the National Science Foundation of China (Grants. 51572031 and 51272030) and Program for Changjiang Scholars and Innovative Research Team in University.Notes and references
- A. Gupta, N. Brahme and D. P. Bisen, J. Lumin., 2014, 155, 112 CrossRef CAS.
- H. Shen, S. Feng, Y. Wang, Y. Gu, J. Zhou, H. Yang, G. Feng, L. Li, W. Wang, X. Liu and D. Xu, J. Alloys Compd., 2013, 550, 531 CrossRef CAS.
- L. G. V. Uitert and S. Iida, J. Chem. Phys., 1962, 37, 986 CrossRef.
- E. Nakazawa and S. Shionoya, J. Chem. Phys., 1967, 47, 3211 CrossRef CAS.
- Z. Hou, Z. Cheng, G. Li, W. Wang, C. Peng, C. Li, P. a. Ma, D. Yang, X. Kang and J. Lin, Nanoscale, 2011, 3, 1568 RSC.
- J. Yang, C. Zhang, C. Li, Y. Yu and J. Lin, Inorg. Chem., 2008, 47, 7262 CrossRef CAS PubMed.
- Z. Chen, Z. Geng, D. Shao, Z. Zhou and Z. Wang, CrystEngComm, 2012, 14, 2251 RSC.
- G. García-Rosales, F. Mercier-Bion, R. Drot, G. Lagarde, J. Roques and E. Simoni, J. Lumin., 2012, 132, 1299 CrossRef.
- W. Di, X. Wang, P. Zhu and B. Chen, J. Solid State Chem., 2007, 180, 467 CrossRef CAS.
- K.-H. Lee and S.-H. Byeon, Eur. J. Inorg. Chem., 2009, 2009, 4727 CrossRef.
- F. Gándara, J. Perles, N. Snejko, M. Iglesias, B. Gómez-Lor, E. Gutiérrez-Puebla and M. Á. Monge, Angew. Chem., Int. Ed., 2006, 45, 7998 CrossRef PubMed.
- X. Wu, J.-G. Li, Q. Zhu, W. Liu, J. Li, X. Li, X. Sun and Y. Sakka, J. Mater. Chem. C, 2015, 3, 3428 RSC.
- (a) K.-H. Lee, B.-I. Lee, J.-H. You and S.-H. Byeon, Chem. Commun., 2010, 46, 1461 RSC; (b) Q. Zhu, J.-G. Li, C. Zhi, X. Li, X. Sun, Y. Sakka, D. Golberg and Y. Bando, Chem. Mater., 2010, 22, 4204 CrossRef CAS.
- (a) B. Shao, Q. Zhao, Y. Jia, W. Lv, M. Jiao, W. Lu and H. You, Chem. Commun., 2014, 50, 12706 RSC; (b) B. Shao, Q. Zhao, W. Lv, M. Jiao, W. Lu and H. You, J. Mater. Chem. C, 2015, 3, 1091 RSC.
- X. Wu, J.-G. Li, J. Li, Q. Zhu, X. Li, X. Sun and Y. Sakka, Sci. Technol. Adv. Mater., 2013, 14, 015006 CrossRef PubMed.
- L. Liu, M. Yu, J. Zhang, B. Wang, W. Liu and Y. Tang, J. Mater. Chem. C, 2015, 3, 2326 RSC.
- R. M. Supkowski and W. D. Horrocks Jr, Inorg. Chim. Acta, 2002, 340, 44 CrossRef CAS.
- Y. Zhao, J.-G. Li, M. Guo and X. Yang, J. Mater. Chem. C, 2013, 1, 3584 RSC.
- F. Izumi and K. Momma, Solid State Phenom., 2007, 130, 15 CrossRef CAS.
- (a) F. Geng, Y. Matsushita, R. Ma, H. Xin, M. Tanaka, F. Izumi, N. Iyi and T. Sasaki, J. Am. Chem. Soc., 2008, 130, 16344 CrossRef CAS PubMed; (b) F. Geng, Y. Matsushita, R. Ma, H. Xin, M. Tanaka, N. Iyi and T. Sasaki, Inorg. Chem., 2009, 48, 6724 CrossRef CAS PubMed.
- B.-I. Lee, J.-S. Bae, E.-S. Lee and S.-H. Byeon, Bull. Korean Chem. Soc., 2012, 33, 601 CrossRef CAS.
- G. Huang, S. Ma, X. Zhao, X. Yang and K. Ooi, Chem. Mater., 2010, 22, 1870 CrossRef CAS.
- http://www.cambridgesoft.com/.
- L. Hu, R. Ma, T. C. Ozawa and T. Sasaki, Inorg. Chem., 2010, 49, 2960 CrossRef CAS PubMed.
- D. T. Cromer, A. C. Larson and J. T. Waber, Acta Crystallogr., 1964, 17, 1044 CrossRef CAS.
- M. J. Frisch, G. W. Trucks, H. B. Schlegel, G. E. Scuseria, M. A. Robb, J. R. Cheeseman, G. Scalmani, V. Barone, B. Mennucci, G. A. Petersson, H. Nakatsuji, M. Caricato, X. Li, H. P. Hratchian, A. F. Izmaylov, J. Bloino, G. Zheng, J. L. Sonnenberg, M. Hada, M. Ehara, K. Toyota, R. Fukuda, J. Hasegawa, M. Ishida, T. Nakajima, Y. Honda, O. Kitao, H. Nakai, T. Vreven, J. A. Montgomery Jr, J. E. Peralta, F. Ogliaro, M. Bearpark, J. J. Heyd, E. Brothers, K. N. Kudin, V. N. Staroverov, R. Kobayashi, J. Normand, K. Raghavachari, A. Rendell, J. C. Burant, S. S. Iyengar, J. Tomasi, M. Cossi, N. Rega, J. M. Millam, M. Klene, J. E. Knox, J. B. Cross, V. Bakken, C. Adamo, J. Jaramillo, R. Gomperts, R. E. Stratmann, O. Yazyev, A. J. Austin, R. Cammi, C. Pomelli, J. W. Ochterski, R. L. Martin, K. Morokuma, V. G. Zakrzewski, G. A. Voth, P. Salvador, J. J. Dannenberg, S. Dapprich, A. D. Daniels, O. Farkas, J. B. Foresman, J. V. Ortiz, J. Cioslowski and D. J. Fox, GAUSSIAN 09 (Revision A.02), Gaussian, Inc., Wallingford, CT, 2009 Search PubMed.
- Q. Yuan, Q. Liu, W.-G. Song, W. Feng, W.-L. Pu, L.-D. Sun, Y.-W. Zhang and C.-H. Yan, J. Am. Chem. Soc., 2007, 129, 6698 CrossRef CAS PubMed.
- L. Wang, D. Yan, S. Qin, S. Li, J. Lu, D. G. Evans and X. Duan, Dalton Trans., 2011, 40, 11781 RSC.
- J. Liang, R. Ma and T. Sasaki, Dalton Trans., 2014, 43, 10355 RSC.
- Z. Xu, C. Li, G. Li, R. Chai, C. Peng, D. Yang and J. Lin, J. Phys. Chem. C, 2010, 114, 2573 CAS.
- A. Huignard, T. Gacoin and J.-P. Boilot, Chem. Mater., 2000, 12, 1090 CrossRef CAS.
- J. Yang, G. Li, C. Peng, C. Li, C. Zhang, Y. Fan, Z. Xu, Z. Cheng and J. Lin, J. Solid State Chem., 2010, 183, 451 CrossRef CAS.
- L. Zhou, J. Yang, S. Hu, Y. Luo and J. Yang, J. Mater. Sci., 2015, 50, 4503 CrossRef CAS.
- M. Back, M. Boffelli, A. Massari, R. Marin, F. Enrichi and P. Riello, J. Nanopart. Res., 2013, 15, 1–14 CrossRef.
- Y.-C. Li, Y.-H. Chang, Y.-S. Chang, Y.-J. Lin and C.-H. Laing, J. Phys. Chem. C, 2007, 111, 10682 CAS.
- R. Chai, H. Lian, C. Li, Z. Cheng, Z. Hou, S. Huang and J. Lin, J. Phys. Chem. C, 2009, 113, 8070 CAS.
- K. Riwotzki, H. Meyssamy, A. Kornowski and M. Haase, J. Phys. Chem. B, 2000, 104, 2824 CrossRef CAS.
Footnote |
| † Electronic supplementary information (ESI) available: Additional XRD patterns, FT-IR spectra, chemical analysis results, fitting patterns, structure parameters and fluorescence spectra. See DOI: 10.1039/c7ra12206c |
| This journal is © The Royal Society of Chemistry 2018 |