
 Open Access Article
 This Open Access Article is licensed under a
 Creative Commons Attribution 3.0 Unported Licence
A novel method of three-dimensional hetero-spectral correlation analysis for the fingerprint identification of humic acid functional groups for hexavalent chromium retention†
Jia Zhang,
Huilin Yin,
Barnie Samuel,
Fei Liu * and
Honghan Chen
* and
Honghan Chen
Beijing Key Laboratory of Water Resources & Environmental Engineering, China University of Geosciences, Beijing 100083, China. E-mail: feiliu@cugb.edu.cn
First published on 19th January 2018
Abstract
Two-dimensional hetero-spectral correlation analysis has been widely used for the interpretation of spectral changes of humic substances involved in various environmental processes. However, when three different types of spectroscopies are utilised, only a pairwise correlation can be achieved. In order to overcome this problem, a novel method of three-dimensional hetero-spectral correlation analysis with scaling technique was developed in this study, which can further establish a direct correlation between three different types of spectroscopies, including FTIR, 13C CP/MAS NMR, and XPS. The proposed method was applied to the fingerprint identification of undissolved humic acid functional groups for Cr(VI) retention, which is one of the most important points for understanding the migration and transformation of Cr(VI) in a subsurface environment. The results indicated that mainly free and dissociated carboxylic groups, phenolic groups, and polysaccharide participated in the reaction with Cr(VI), and these functional groups were mainly located at aromatic domains. Besides, the variations of functional groups were related to the reduction of Cr(VI), and the reduced Cr(III) mainly bound to aromatic domains. The successful application of the proposed method demonstrated that it can serve as a promising tool for further investigations concerning more complicated environmental processes and even other scientific fields by supplying more detailed, reliable and visualised spectral information.
1. Introduction
Hexavalent chromium Cr(VI) is widely used for electroplating, leather tanning, and corrosion protection, and the infiltration of the chromium containing wastewater generated from the industrial processes has made it one of the most common heavy metal pollutants in contaminated soil and groundwater.1 Cr(VI) anions (mainly Cr2O72−, HCrO4−, and CrO42−) are very mobile in the terrestrial environment with extreme toxicity to organisms and potential carcinogenicity to humans, which make them of great scientific concern.2 Undissolved humic acid (HA) with a great quantity of active functional groups is widespread in the soil matrix, the content of which is generally two magnitudes higher than that of dissolved HA in soil.3 The undissolved HA has a significant retention effect on the migration of Cr(VI), and thus it is of great value to reveal the interaction mechanism between undissolved HA and Cr(VI) for understanding the fate of Cr(VI) in the subsurface.4,5 However, the reaction processes and HA molecular structures are extremely complex resulting in an unclear interaction mechanism, which may include the reduction of Cr(VI), the complexation of Cr(VI) anion or reduced Cr(III) cation, and particularly the participation of a variety of functional groups that may be involved in the different reaction processes above.6 Thus the identification of the types of HA functional groups participating in the reaction with Cr(VI) is regarded as the most important step to reveal the interaction mechanism.Infrared spectroscopy (IR) is considered as a useful tool to monitor the variation of HA functional groups during reaction with Cr(VI) due to its high sensitivity for organic functional groups.7 Spectral changes in mid-infrared region have been observed in previous investigations which were mainly assigned to the oxidation of carboxylic and phenolic groups and the formation of chelate between carboxyl and Cr ion.8–10 However, are there any other HA functional groups taking part in the reaction with Cr(VI)? What kinds of molecular structure domains are these functional groups more likely to be associated with? How can these spectral intensity changes indicating the variation of HA functional groups be directly linked to the interaction with Cr(VI)? At present, these questions still remain unclear, and the main reasons are as follows: firstly, for the presence of many similar functional groups in HA resulting from its complex molecular structure, the IR peaks overlap badly in mid-infrared region leading to significant decrease of the spectral resolution, and this makes it difficult to effectively identify the subtle intensity variation of the spectra artificially.11 Secondly, IR has been demonstrated to be effective for functional groups identification, but not for molecular structure, which is generally revealed by nuclear magnetic resonance (NMR). So how to cross-fertilize the two different classes of spectroscopy probes to provide more concrete information about the involving functional groups still remains to be solved. Thirdly, little attention has been given to the transformation of Cr valence states on the surface of undissolved HA in the past researches, and it was generally considered that all Cr(VI) removed from the liquid phase tended to react with HA functional groups.12 However, it has been found in our previous investigation that not all the Cr(VI) adsorbed onto HA is reduced to Cr(III), and a fair amount of Cr still remains in hexavalent state on HA, which indicates that not all the Cr(VI) removed from liquid phase tend to induce the reaction with certain functional groups.13,14 Therefore, it is of great importance to make a direct association between the variation of functional groups and Cr(VI) transformation on HA that can be characterised by X-ray photoelectron spectroscopy (XPS).
Two-dimensional hetero-spectral correlation analysis, which integrates two different types of spectra obtained from a system under the same perturbation and using multiple spectroscopic probes, can serve as a promising tool to solve above problems.15,16 It can achieve hetero-correlation between completely different types of physical techniques, such as IR and NMR, to shed light on the interpretation of molecular functional groups and structure synchronous variation of samples under certain external perturbation.17 In recent years the 2D hetero-spectral correlation analysis has been widely used in the field of environmental science.18–27 However, in some situations more than two types of spectroscopies need to be used for the characterisation of the same experimental sample, and by this situation only a pairwise correlation can be achieved according to the current method system.28 Therefore, how to achieve a direct correlation analysis for three different types of spectroscopy is of great value for the hetero-spectral correlation analysis theory to supply more detailed, reliable and visualised spectral information.
In the present work, a method of three-dimensional hetero-spectral correlation analysis was proposed and verified, and then the novel method was employed for the investigation of the undissolved HA functional groups for Cr(VI) retention by achieving the three-dimensional hetero-spectral correlation among three different types of spectroscopies, namely FTIR, 13C CP/MAS NMR, and XPS, which respectively reflect the variation of functional groups, molecular structure, and Cr speciation on HA. The preliminary experiment was conducted under pH ranged from 1 to 5, and it was found that the lower pH was beneficial for the retention of Cr(VI) by HA. Therefore, in order to get the results within an acceptable time scale and make the spectra variation with a detectable extent, we mainly presented the results obtained at pH 1. This situation is equally common in contaminated sites associated with electroplating and leather tanning industries,29,30 where the extremely acidic wastewater (pH 1) discharged into the environment directly or by the means of seepage pits have been reported in many sites.31
2. Materials and methods
2.1 Sample preparation
Standard HA was purchased from Sinopharm Chemical Reagent Co., China, and was sieved through a 74 μm sieve to remove course particulates, and homogenised. The elemental composition, acidic groups content, ash content, water content, surface area, point of zero charge (PZC) can be found in our previous work.13A series of 250 ml of Cr(VI) solutions with different initial concentrations ranging from 0.5 to 8 mM were added into 300 ml brown flasks containing 125.0 ± 0.5 mg undissolved HA. The solution contained a background electrolyte of 0.01 M NaCl, and the initial pH was adjusted to 1 by adding 2.5 M HCl. Each solution was shaken at 25 °C using a horizontal shaker with an intensity of agitation of 200 rpm for 20 d (the preliminary experiment proved that 20 d was sufficient for reaction equilibrium). All experiments were performed in triplicate. The vacuum filtration was used to separate undissolved HA from the solutions, and HA samples were freeze-dried for FTIR, 13C CP/MAS NMR and XPS analysis. The filtrate was filtered through a 0.22 μm membrane, and the concentration of Cr(VI) in the filtrate was determined using a UV/vis spectrophotometer (SHIMADZU UV-1800) at 540 nm after reaction with 1,5-diphenylcarbazide indicator (DPC).32 Total chromium was determined using ICP-AES (SPECBLUE) at 283.56 nm. The Cr(III) concentration in the filtrate was determined by the difference between total chromium and Cr(VI) concentration.
2.2 FTIR, 13C CP/MAS NMR, and XPS characterization
FTIR spectra of samples were obtained on an IR spectrometer (Bruker LUMOS, Germany) at room temperature. All samples were fully ground to guarantee high homogeneity prior to tests. The samples were uniformly mixed with dried KBr powder at mass ratio of 1![[thin space (1/6-em)]](https://www.rsc.org/images/entities/char_2009.gif) :200. Each spectrum was obtained after 64 scans with 2 cm−1 resolution, and the spectrum used for analysis was the average of scanning results obtained from triplicate samples.
:200. Each spectrum was obtained after 64 scans with 2 cm−1 resolution, and the spectrum used for analysis was the average of scanning results obtained from triplicate samples.
Solid-state 13C CP/MAS NMR spectra of the samples were collected on a Bruker AVANCE III 400 NMR spectrometer with 4 mm NMR rotors with Kel-F caps. NMR spectra were obtained by applying the following parameters: rotor spin rate of 13 kHz, 1 s recycle time, 2 ms contact time, 20 ms acquisition time, and 10000 scans. Chemical shifts were calibrated with adamantane.
XPS was measured with Thermo escalab 250XI. The X-ray excitation was provided by a monochromatic Al Kα (excitation energy 1486.6 eV). The binding energies of the spectra were corrected using the hydrocarbon component of adventitious carbon at 284.8 eV.
2.3 Two-dimensional and three-dimensional hetero-spectral correlation analysis
According to the theory of two-dimensional spectroscopy correlation analysis (2DCOS) proposed by Noda,33 the dynamic spectra which represent the variation of spectral intensity compare with reference spectrum can be calculated from the following:
![[x with combining tilde]](https://www.rsc.org/images/entities/i_char_0078_0303.gif) j(v) = (v,tj) = x(v,tj) − j(v) = (v,tj) = x(v,tj) − ![[x with combining macron]](https://www.rsc.org/images/entities/i_char_0078_0304.gif) (v), j = 1,2,⋯, m (v), j = 1,2,⋯, m
| (1) |
(v,tj) denotes the dynamic spectra measured at m equally spaced points in perturbation t between t1 and tm, and the average spectrum  has been subtracted from raw data x(v,tj). The synchronous correlation intensity for two-dimensional hetero-spectral correlation analysis can be directly calculated from the following:
 | (2) |
In order to achieve the correlation analysis for three different types of spectroscopy simultaneously, we first proposed a concept of three-dimensional hetero-spectral correlation intensity Ων,μ,λ, which can be calculated from the following:
| Ων,μ,λ = Φν,μΦν,λΦμ,λ | (3) |
As the discrepancies of variation extent for different spectral signals, during the calculation of correlation intensities, the signal variations with large amplitudes tend to dominate the correlation map and obscure the equally important details arising from relatively subtle but significant signal changes. This phenomenon has been reported previously,26,27 and Noda introduced scaling techniques to overcome this problem resulting in an desired effect.34 In this study we also employed similar method to solve the scale problem.
The standard deviation of spectral correlation intensity at v is defined as follows:
 | (4) |
According to the scaling techniques suggested by Noda, the scaled three-dimensional hetero-spectral correlation intensity is given by:
| Ω(scaled)ν,μ,λ = Φν,μΦν,λΦμ,λ[σ(ν)2σ(μ)2σ(λ)2]−α | (5) |
Prior to correlation analysis, the spectra of FTIR were normalized and denoised by Savitzky–Golay smoothing. The peak fitting of XPS data was conducted on XPSPEAK41 software. The 2DCOS analysis was produced using 2Dshige software (Kwansei-Gakuin University, Japan). A homemade software TDCOS 1.0 for three-dimensional hetero-spectral correlation analysis was developed using Visual Basic by one of the authors (Jia Zhang).
3. Results and discussion
3.1 Analysis of simulated data
 | ||
| Fig. 1 Three different types of simulated spectra with different overlapping characteristics. (a) Badly overlapped; (b) entirely isolated; (c) slightly overlapped. | ||
As shown in Fig. 2, the intensities of peaks in each spectrum vary in different directions and extent as a function of the external perturbation variable t, which can be any physical quantities that may influence the spectral intensities, such as time, temperature, and concentration. These independent peaks and intensity variations are given as a Gaussian peak function:35
 | (6) |
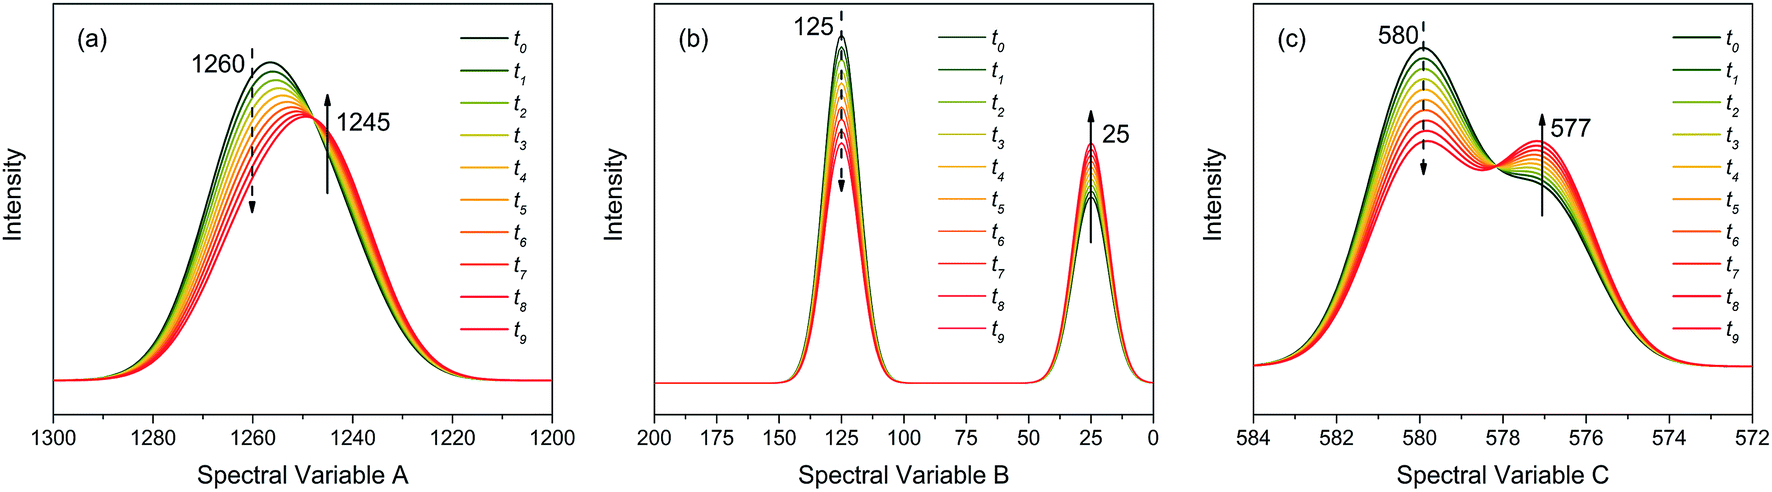 | ||
| Fig. 2 Three different types of simulated dynamic spectra with different variation directions and extend. (a) Badly overlapped; (b) entirely isolated; (c) slightly overlapped. | ||
| Peak | A(t) | μ | σ |
|---|---|---|---|
| A peak 1 | 1 − 1/20 × t | 1260 | 10 |
| A peak 2 | 1/2 × (1 + 1/20 × t) | 1245 | 10 |
| B peak 1 | 1 − 1/30 × t | 125 | 7 |
| B peak 2 | 1/2 × (1 + 1/30 × t) | 25 | 7 |
| C peak 1 | 1 − 1/30 × t | 580 | 1.2 |
| C peak 2 | 1/2 × (1 + 1/30 × t) | 577 | 1.2 |
As indicated, the intensities of peak 1 in all the three spectra decreased to a large extent, and that of peak 2 increased in a small extent. In order to clarify the correlation relationship between independent peaks of the three different types of spectra, a traditional two-dimensional hetero-spectral correlation was achieved in the form of pairwise correlation as shown in Fig. 3. According to the principles of hetero-spectral correlation analysis, the variation directions of corresponding peaks of two different types of spectra can be determined by the colour-filled regions in the maps, where the red and blue regions respectively indicated that the corresponding peaks varied simultaneously in the same and opposite directions, and the absolute value of the colour-filled region reflects the variation extent of corresponding peaks. For example, the red region with a relatively large positive value of correlation intensity at the bottom left corner of Fig. 3(a) represents that the spectral intensities at 1260 (spectra A) and 125 (spectra B) vary in the same direction with a relatively large extent, and the blue region with a relatively small negative value of correlation intensity at the bottom right corner of Fig. 3(b) represents that the spectral intensities at 1245 (spectra A) and 580 (spectra C) vary in the opposite direction with a relatively small extent. It can be seen that the two-dimensional hetero-spectral correlation analysis can serve as a useful tool to reveal the correlation relationship between the variation of two different types of spectra, however, obviously it is no longer a visualised way to show the correlation relationship between three different types of spectra on account of its failure to establish a direct correlation analysis between them.
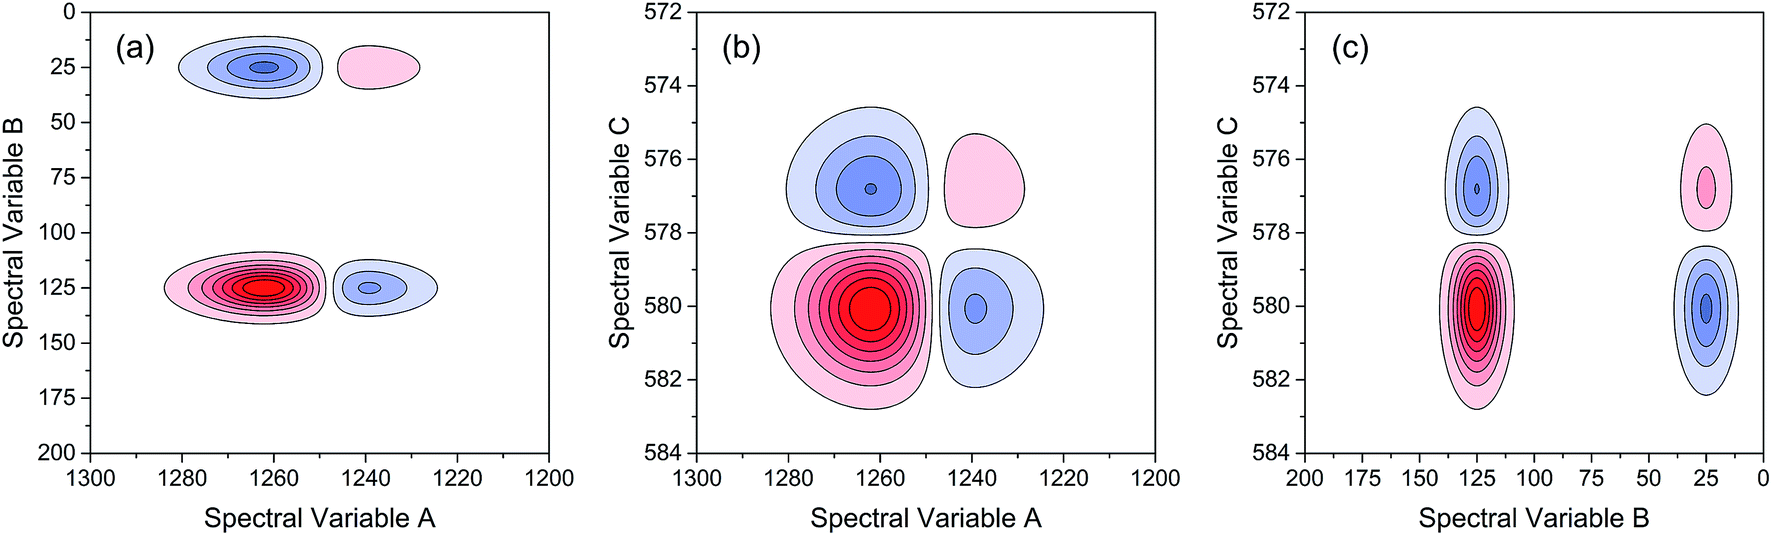 | ||
| Fig. 3 Two-dimensional hetero-spectral correlation maps of simulated data. (a) A and B; (b) A and C; (c) B and C. Red regions represent the positive correlation intensity; blue regions represent the negative correlation intensity. | ||
 | ||
| Fig. 4 Bubble diagram of three-dimensional hetero-spectral correlation for simulated data. Scaling factor α = 0.75. | ||
Based on the theory of three-dimensional hetero-spectral correlation analysis, the correlation intensity can only be positive, while it is obvious that these bubbles indicate various combinations of peak changing directions determined by three different types of spectra. Consequently, it is of great value to differ the various situations of peak changing directions combination by dividing these bubbles into several groups (Fig. 5). As indicated, the bubbles in Fig. 4 were divided into eight situations, which respectively correspond to different combinations of peak change way obtained from the three different types of spectra including all the possible situations. The detailed change situations are marked in the figures, and the result of each situation can be obtained from the TDCOS 1.0 software automatically.
 | ||
| Fig. 5 Bubble diagrams for eight different situations of peak changing characteristics from the three sets of simulated dynamic spectra. A, B and C represent the three different types of simulated dynamic spectra. ↑ indicates the peak intensity increases with external perturbation, and ↓ indicates the peak intensity decreases with external perturbation. Scaling factor α = 0.75. | ||
As shown above, three aspects of information can be obtained from the three-dimensional hetero-spectral correlation analysis: (1) which three different spectral variable from various spectroscopies have correlation properties; (2) how the relative correlation intensities are for these correlation bubbles; (3) what are the detailed changing directions of the three changing peaks obtained from the three sets of dynamic spectra for each correlation bubble. Compared with the traditional two-dimensional hetero-spectral correlation analysis, the proposed method has three aspects of advantages: (1) a direct correlation relationship can be established among three different types of spectra instead of a pairwise correlation; (2) the result of specific situation of peak changing direction combination can be obtained discretionarily using the homemade software; (3) the method supplies a more visualized, stabilized and reliable way to illustrate the correlation result of spectral intensity variation of three different types of spectra obtained from a single experimental sample under external perturbation.
3.2 Analysis of practical data
![[double bond, length as m-dash]](https://www.rsc.org/images/entities/char_e001.gif) O stretching of free carboxyl,36 CO stretching of dissociated carboxyl,8 and C–O stretching of phenol.9 The intensities of absorption peaks at 1113, 1095, 1032, 1008 cm−1 slightly decreased with the increasing Cr(VI) concentration, which were assigned to the C–O stretching of ester and polysaccharose.37–39 In contrast, the intensities of absorption peak at 1548 cm−1 increased significantly with increasing Cr(VI) concentration, which was ascribed to chelated carboxylic groups.10 The increased intensity of the peak at 804 cm−1 was very likely associated with Cr(III) accumulation which was supported by the FTIR spectrum of CrCl3·6H2O (Fig. S3†).
O stretching of free carboxyl,36 CO stretching of dissociated carboxyl,8 and C–O stretching of phenol.9 The intensities of absorption peaks at 1113, 1095, 1032, 1008 cm−1 slightly decreased with the increasing Cr(VI) concentration, which were assigned to the C–O stretching of ester and polysaccharose.37–39 In contrast, the intensities of absorption peak at 1548 cm−1 increased significantly with increasing Cr(VI) concentration, which was ascribed to chelated carboxylic groups.10 The increased intensity of the peak at 804 cm−1 was very likely associated with Cr(III) accumulation which was supported by the FTIR spectrum of CrCl3·6H2O (Fig. S3†).
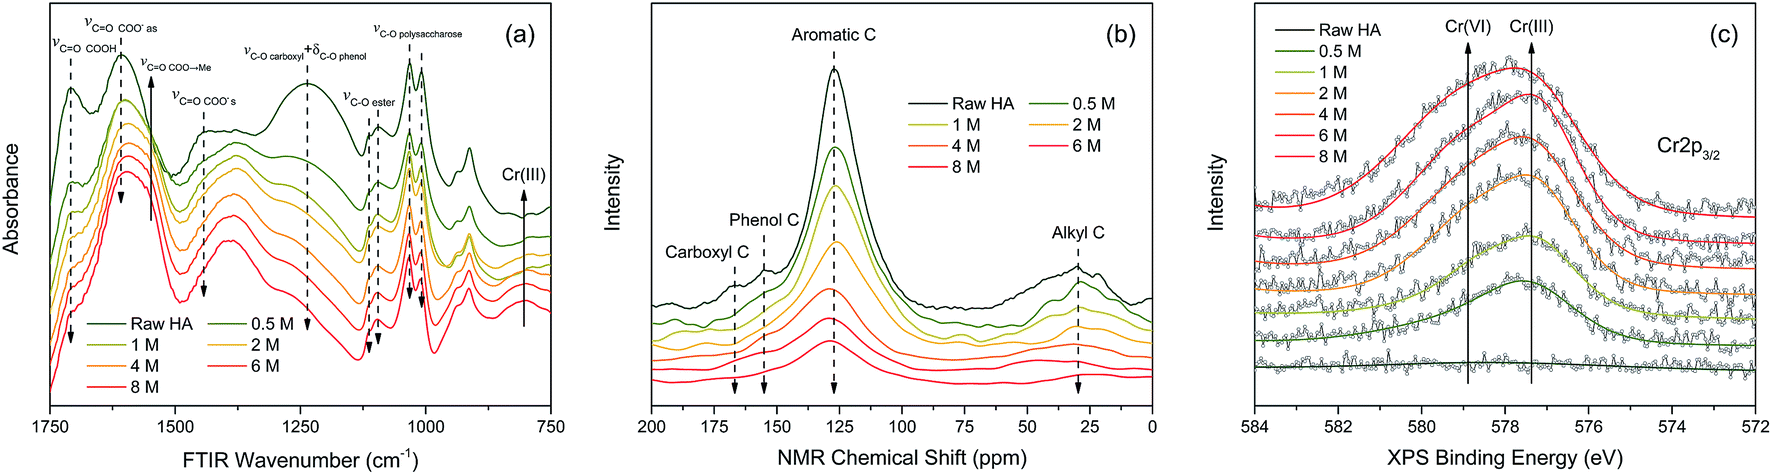 | ||
| Fig. 6 (a) FTIR, (b) 13C CP/MAS NMR, and (c) Cr 2p XPS spectra obtained from HA after reacting with different initial Cr(VI) concentrations ranged from 0.5 to 8.0 mM. The raw HA is referring to the HA without any perturbation. | ||
In order to indicate the molecular structure variations of HA after reacting with Cr(VI), a set of NMR spectra were carried out and the result is shown in Fig. 6(b). The intensities of the peaks at 168, 155, 127, and 30 ppm decreased with the increasing Cr(VI) concentration, which were attributed to carboxyl carbons, phenol carbons, aromatic carbons, and aliphatic carbons respectively.40 Among them, the intensity decrease of aromatic carbons peak was the most significant one. The attenuation of NMR peak intensity in this study can be caused by two factors: (1) the corresponding carbons transformed into other types of carbons resulting from the oxidation by Cr(VI); (2) the chemical shift of corresponding carbons was strongly shielded owing to the diamagnetic effect of the Cr valence electrons.41
The oxidation state variation of Cr on HA was further determined by Cr 2p XPS, and the result is shown in Fig. 6(c). The peaks at 577.6 and 578.9 eV increased substantially with the increasing aqueous Cr(VI) concentration, which were attributed to Cr(III) and Cr(VI) respectively.
The variations of HA functional groups and molecular structures were essentially induced by the reaction with Cr. Thus the spectral intensity variations of FTIR, NMR and XPS, which respectively reflect the characteristics of HA functional groups, molecular structures, and Cr oxidation state distributions, should have certain correlation relationships with each other. Therefore, the traditional two-dimensional hetero-spectral correlation analysis was utilised to verify the correlation relationship between different types of spectroscopy, and the results are shown in Fig. 7. It can be seen in Fig. 7(a) that the FTIR bands at 1708, 1443, 1236 and 1032 cm−1 were positively correlated with NMR band at 127 ppm, and the FTIR band at 1548 cm−1 was negatively correlated with NMR band at 127 ppm. This indicated that the HA functional groups participating in the reaction with Cr(VI) were mainly related to the aromatic domain of HA molecules. According to Fig. 7(b) and (c), the FITR and NMR bands were strongly correlated with XPS band at 577.6 eV that represents the signal of reduced Cr(III), which indicated that the variation of functional groups were mainly induced by the reduction of Cr(VI). As mentioned above, when three types of spectra are employed for correlation analysis, the two-dimensional hetero-spectral correlation analysis is obviously no longer a visualised way to show the correlation relationship between them.
 | ||
| Fig. 7 Two-dimensional hetero-spectral correlation between different types of spectra. (a) FTIR-NMR; (b) FTIR-XPS; (c) NMR-XPS. Red regions represent the positive correlation intensity; blue regions represent the negative correlation intensity. | ||
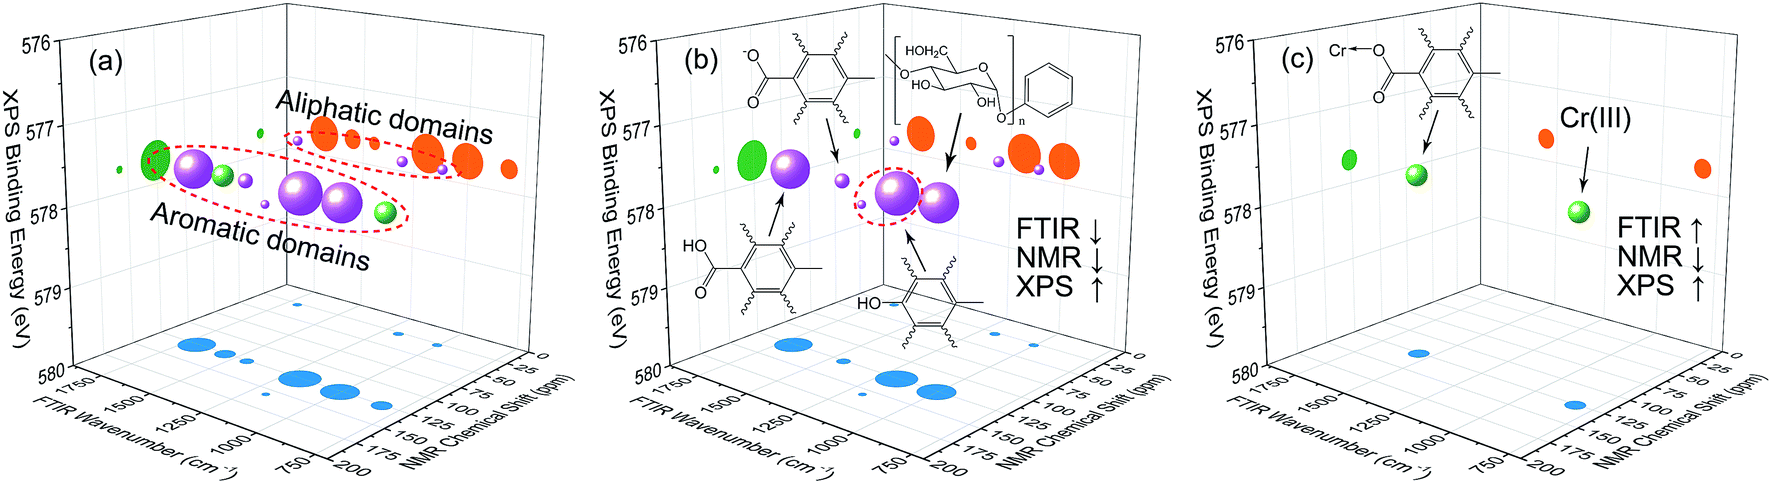 | ||
| Fig. 8 Bubble diagram of three-dimensional hetero-spectral correlation analysis for FTIR, NMR, and XPS. ↑ indicates the peak intensity increases with external perturbation, and ↓ indicates the peak intensity decreases with external perturbation. Scaling factor α = 0.75. | ||
According to the results of three-dimensional hetero-spectral correlation analysis obtained from the homemade software, the correlation bubbles were divided into two groups with different peaks changing direction combinations. The correlation bubbles in Fig. 8(b) were involved in the situation that with increasing Cr(VI) concentration the peak intensities of FTIR and NMR decreased and that of XPS increased, which indicated that the corresponding functional groups and molecular structures participated in the reduction of Cr(VI) into Cr(III). The functional groups for Cr(VI) reduction mainly included free carboxylic groups (1708 cm−1), dissociated carboxylic groups (1443 cm−1), phenolic groups (1236 cm−1), and polysaccharide (1032 cm−1), which were more likely located at aromatic domains (127 ppm). Meanwhile, the correlation bubbles in Fig. 8(c) were involved in the situation that with increasing Cr(VI) concentration the peak intensities of NMR decrease and that of FTIR and XPS both increased, which indicated that the reaction between HA and Cr(VI) resulted in the formation of corresponding complex of carboxyl-Cr (1548 cm−1). Additionally, the reduced Cr(III) (804 cm−1) was more likely located at the aromatic domains of HA.
4. Conclusions
In this study, the novel method of three-dimensional hetero-spectral correlation analysis with scaling technique was first proposed to achieve a fingerprint identification of undissolved HA functional groups for Cr(VI) retention by establishing a direct correlation between three different types of spectroscopies, including FTIR, 13C CP/MAS NMR, and XPS. The results showed that mainly carboxyl, phenol, and polysaccharide were involved in the retention of Cr(VI) by HA, and all of them were more likely located at the aromatic domains of HA. Additionally, the variations of HA functional groups and molecular structure were both related to the reduction of Cr(VI), and the reduced Cr(III) was mainly bound to aromatic domains. Compared with traditional two-dimensional hetero-spectral correlation analysis, the three-dimensional hetero-spectral correlation analysis can serve as a promising tool to supply much more detailed, reliable and visualized spectral information, and it is of great potential to extend it to other types of spectroscopies for further investigations concerning more complicated environmental processes and even other scientific fields.Conflicts of interest
The authors declare no conflict of interest.Acknowledgements
This work was financially supported by the National Natural Science Foundation of China (Grant 41672239) and China Geological Survey (1212011121173).References
- B. Dhal, H. N. Thatoi, N. N. Das and B. D. Pandey, J. Hazard. Mater., 2013, 250–251, 272–291 CrossRef CAS PubMed.
- D. A. Brose and B. R. James, Environ. Sci. Technol., 2013, 47, 12985–12991 CrossRef CAS PubMed.
- W. Xiao, Y. Zhang, T. Li, B. Chen, H. Wang, Z. He and X. Yang, J. Environ. Qual., 2012, 41, 1452–1458 CrossRef CAS PubMed.
- G. Arslan, S. Edebali and E. Pehlivan, Desalination, 2010, 255, 117–123 CrossRef CAS.
- D. M. Zhilin, P. Schmitt-Kopplin and I. V. Perminova, Environ. Chem. Lett., 2004, 2, 141–145 CrossRef CAS.
- P. Janos, V. Hula, P. Bradnova, V. Pilarova and J. Sedlbauer, Chemosphere, 2009, 75, 732–738 CrossRef CAS PubMed.
- B. Muik, B. Lendl, A. Molinadiaz, M. Valcarcel and M. J. Ayoracañada, Anal. Chim. Acta, 2007, 593, 54–67 CrossRef CAS PubMed.
- N. H. Hsu, S. L. Wang, Y. C. Lin, G. D. Sheng and J. F. Lee, Environ. Sci. Technol., 2009, 43, 8801–8806 CrossRef CAS PubMed.
- S. W. Huang, P. N. Chiang, J. C. Liu, J. T. Hung, W. H. Kuan, Y. M. Tzou, S. L. Wang, J. H. Huang, C. C. Chen and M. K. Wang, Chemosphere, 2012, 87, 587–594 CrossRef CAS PubMed.
- T. T. Zhao, W. Z. Ge, Y. X. Nie, Y. X. Wang, F. G. Zeng and Y. Qiao, Fuel Process. Technol., 2016, 150, 71–77 CrossRef CAS.
- H. A. N. Abdulla, E. C. Minor and P. G. Hatcher, Environ. Sci. Technol., 2010, 44, 8044–8049 CrossRef CAS PubMed.
- S. Y. Chen, S. W. Huang, P. N. Chiang, J. C. Liu, W. H. Kuan, J. H. Huang, J. T. Hung, Y. M. Tzou, C. C. Chen and M. K. Wang, J. Hazard. Mater., 2011, 197, 337–344 CrossRef CAS PubMed.
- J. Zhang, L. Chen, H. Yin, S. Jin, F. Liu and H. Chen, Environ. Pollut., 2017, 86–92 CrossRef PubMed.
- J. Zhang, H. Yin, L. Chen, F. Liu and H. Chen, Environ. Pollut., 2017 DOI:10.1016/j.envpol.2017.10.120.
- M. Thomas and H. H. Richardson, Vib. Spectrosc., 2000, 24, 137–146 CrossRef CAS.
- I. Noda and Y. Ozaki, Two-dimensional correlation spectroscopy: applications in vibrational and optical spectroscopy, John Wiley & Sons, 2005 Search PubMed.
- I. Noda, Chin. Chem. Lett., 2015, 26, 167–172 CrossRef CAS.
- G. H. Yu, Z. Tang, Y. C. Xu and Q. R. Shen, Environ. Sci. Technol., 2011, 45, 9224–9231 CrossRef CAS PubMed.
- W. Chen, N. Habibul, X. Y. Liu, G. P. Sheng and H. Q. Yu, Environ. Sci. Technol., 2015, 49, 2052–2058 CrossRef CAS PubMed.
- R. M. B. O. Duarte, S. M. S. C. Freire and A. C. Duarte, Atmos. Environ., 2015, 116, 245–252 CrossRef CAS.
- F. Sun, M. L. Polizzotto, D. Guan, J. Wu, Q. Shen, W. Ran, B. Wang and G. Yu, J. Hazard. Mater., 2017, 326, 18–25 CrossRef CAS PubMed.
- F. Sun, Y. Li, W. Xiang, Z. Chi and G. Yu, Environ. Pollut., 2017, 223, 457–465 CrossRef CAS PubMed.
- X. Y. Liu, W. Chen, C. Qian and H. Q. Yu, Environ. Sci. Technol., 2017, 51 Search PubMed.
- Y. Wang, X. Zhang, X. Zhang, Q. Meng, F. Gao and Y. Zhang, Chemosphere, 2017, 180, 531 CrossRef CAS PubMed.
- Y. K. Lee and J. Hur, Environ. Pollut., 2017, 227, 490 CrossRef CAS PubMed.
- Y. Zhang, Y. Wang, X. Zhang, R. Li, Y. Chen and Q. Meng, Environ. Sci. Pollut. Res., 2017, 1–10 Search PubMed.
- B. Hu, P. Wang, C. Wang, J. Qian, J. Hou, X. Cui and N. Zhang, Chemosphere, 2017, 188, 424 CrossRef CAS PubMed.
- X. S. He, B. D. Xi, Z. Y. Zhang, R. T. Gao, W. B. Tan and D. Y. Cui, Chemosphere, 2014, 117, 701–707 CrossRef CAS PubMed.
- J. Liu, X. H. Zhang, H. Tran, D. Q. Wang and Y. N. Zhu, Environ. Sci. Pollut. Res., 2011, 18, 1623–1632 CrossRef CAS PubMed.
- K. Dermentzis, A. Christoforidis, E. Valsamidou, A. Lazaridou and N. Kokkinos, Global NEST J., 2011, 13, 412–418 Search PubMed.
- C. L. Hsu, S. L. Wang and Y. M. Tzou, Environ. Sci. Technol., 2007, 41, 7907 CrossRef CAS PubMed.
- L. C. Hsu, S. L. Wang, Y. C. Lin, M. K. Wang, P. N. Chiang, J. C. Liu, W. H. Kuan, C. C. Chen and Y. M. Tzou, Environ. Sci. Technol., 2010, 44, 6202 CrossRef CAS PubMed.
- I. Noda, Appl. Spectrosc., 1993, 47, 1329–1336 CrossRef CAS.
- I. Noda, J. Mol. Spectrosc., 2008, 883–884, 216–227 CAS.
- H. Huang, Anal. Chem., 2007, 79, 8281 CrossRef CAS PubMed.
- L. Li, W. Huang, P. A. Peng, G. Sheng and J. Fu, Soil Sci. Soc. Am. J., 2003, 67, 740–746 CrossRef CAS.
- P. E. Fanning and M. A. Vannice, Carbon, 1993, 31, 721–730 CrossRef CAS.
- J. M. O'Reilly and R. A. Mosher, Carbon, 1983, 21, 47–51 CrossRef.
- C. Sellitti, J. L. Koenig and H. Ishida, Carbon, 1990, 28, 221–228 CrossRef CAS.
- B. Xing, Environ. Pollut., 2001, 111, 303 CrossRef CAS PubMed.
- E. Kolehmainen, K. Laihia, J. Korvola, V. S. Kaganovich, M. I. Rybinskaya and Z. A. Kerzina, J. Org. Chem., 1995, 485, 109–114 CrossRef CAS.
Footnote |
| † Electronic supplementary information (ESI) available. See DOI: 10.1039/c7ra12146f |
| This journal is © The Royal Society of Chemistry 2018 |