 Open Access Article
Creative Commons Attribution 3.0 Unported Licence
Small PLGA nanocapsules Co-encapsulating copper sulfide nanodots and fluorocarbon compound for photoacoustic imaging-guided HIFU synergistic therapy†
Minghua Yaoa,
Ming Ma *bc,
Huixiong Xua,
Xiaoxia Panc,
Guang Xua and
Rong Wu*a
aDepartment of Ultrasound in Medicine, Shanghai Tenth People's Hospital, Tongji University School of Medicine, 301 Yanchangzhong Road, Shanghai 200072, People's Republic of China. E-mail: wurong7111@163.com
bState Key Laboratory of High Performance Ceramics and Superfine Microstructures, Shanghai Institute of Ceramics, Chinese Academy of Sciences, 1295 Dingxi Road, Shanghai 200050, People's Republic of China. E-mail: mma@mail.sic.ac.cn
cState Key Laboratory of Molecular Engineering of Polymers, Fudan University, 220 Handan Road, Shanghai 200433, People's Republic of China
First published on 24th January 2018
Abstract
High intensity focused ultrasound (HIFU), as a promising and minimally invasive therapeutic modality against various solid tumors, has received considerable attention in the biomedical field. However, both the accuracy and efficacy of this technique are currently unsatisfactory. Herein, a nanometer-sized organic/inorganic hybrid enhancement agent for photoacoustic imaging (PAI)-guided HIFU therapy was designed and fabricated by concurrently encapsulating both Cu2−xS nanodots (NDs) and perfluorooctyl bromide (PFOB) into a poly(lactic-co-glycolic acid) PLGA nanocapsule (denoted CPPNs). These nanocapsules assumed a unique core/satellite/shell sandwich structure, and combined the merits of small and uniform particle size (about 120 nm), favorable biosafety, and multifunctional theranostic ability into one system. The high performance of Cu2−xS NDs in the absorption and conversion of near infrared laser confers high PAI contrast capability to the CPPNs, by which the location of the CPPNs within a tumor can be monitored successfully under PAI. Furthermore, our in vitro and in vivo results confirmed that the encapsulated PFOB in CPPNs increased the cavitation effect and thus enhanced the ablation efficacy under HIFU exposure. CPPNs show great potential as an efficient and powerful theranostic agent for future PAI-guided HIFU synergistic therapy.
1. Introduction
High intensity focused ultrasound (HIFU) is considered a promising minimally invasive therapeutic modality for various solid tumors, and has been the focus of numerous studies over the past decade.1–3 By concentrating multiple intersecting beams of ultrasound (US) into the targeted tumor region, both hyperthermia and mechanical effects can be rapidly generated in order to efficiently induce regional coagulative necrosis and blood vessel damage.4,5 However, this technique still has several limitations, which restricts its broad application for clinical cancer therapy.6,7 The current HIFU technique generally suffers from the inevitable depth-dependent decay of acoustic energy along the US pathway, resulting in low therapeutic efficacy in treating deeply buried tumors.8 To solve this problem, HIFU synergistic agents (SAs), comprised of lipid or polymeric shells and fluorocarbon liquid cores, have been constructed for the enhancement of HIFU therapy by altering the acoustic environment of tumor tissues.9–11 Unfortunately, the large particle sizes associated with HIFU SAs, in the micrometer range resulting from the traditional emulsification fabrication method, are unfavorable for long-time blood circulation and for escaping the reticuloendothelial system, and therefore present unsatisfactory therapeutic efficacy.12With a view to improving therapeutic outcomes and reducing side effects, real-time US contrast imaging is generally applied in HIFU therapy in current preclinical research, to ascertain the distribution of HIFU SAs after intravenous injection and to monitor the therapeutic response.13 Nevertheless, these US-guided HIFU strategies are still not satisfactory because of their inadequate therapeutic accuracy and low image contrast.14 In recent years, there have been several reports on HIFU SAs with magnetic resonance imaging (MRI) contrast properties, such as hollow/porous organosilica–Fe3O4 hybrid nanocapsules15 and manganese oxide (MnOx) nanoparticle embedded mesoporous nanoagents.16 These were developed with a view to enhanced MRI-guided HIFU therapy with superior imaging resolution and longer imaging duration, compared to HIFU with conventional US contrast agents. However, this type of highly integrated HIFU and MRI approach has not been widely applied in clinic due to high associated costs and complex operation.17 Significant advances in nanomaterial synthesis and imaging techniques are therefore urgently required to improve the therapeutic efficacy and accuracy of HIFU cancer therapy.
Photoacoustic imaging (PAI) is a noninvasive biomedical imaging technique, which combines the contrast of optical imaging and high resolution of US.18–20 The penetration depth of PAI in tissue-mimicking phantoms and biological tissues exceeds 5 cm, thus satisfying the imaging requirements for superficial tumors.21 Importantly, it has been confirmed that PAI techniques can be integrated with HIFU ablation techniques, which could help doctors to detect the location of the target tumor tissues and therefore perform HIFU ablation procedures with more accuracy.22–24 Moreover, to promote therapeutic efficacy, several HIFU SAs containing PA contrast agents have been successfully fabricated.25–28 For example, Zhang et al. designed, fabricated, and applied perfluorohexane-incorporated hollow mesoporous Prussian blue nanoparticles (HMPBs), which resulted in both sensitive and precise PAI and the simultaneous enhancement of HIFU therapy.25 Although the concept is impressive, concerns remain as to the low degradation rate and potential toxicity of HMPBs. Recently, Yan et al. synthesized hematoporphyrin monomethyl ether (HMME)-loaded poly(lactic-co-glycolic acid) (PLGA) microcapsules (HMME/PLGA) for multifunctional applications in PAI-guided HIFU treatment.26 In comparison to HMPB based SAs, the polymer composition endowed the system with feasible biodegradability, however, the particle size is too large (approximately 357 ± 0.72 nm in diameter) to penetrate through the barrier between vascular endothelial cells. Besides, monomeric chromophores generally have limited light absorption capacity in comparison to noble metals, thus presenting lower performance in terms of PA contrast imaging.29 Overall, significant structural improvements are urgently required in constructing nano-scale SAs for high-efficiency PAI-guided enhanced HIFU therapy. Recently, metal sulfide nanoparticle-based PAI contrast agents, such as copper sulfide, sliver sulfide, and bismuth sulfide nanoparticles, have received extensive attention due to their strong near-infrared absorption, unique optical properties, and well-controlled nano-scale particle size, without the need for elaborate shape design.30–32 Specifically and importantly, the optical absorption wavelength of Cu2−xS nanodots (NDs) can be well manipulated within a suitable optical imaging window, which is ideal for obtaining clinically relevant penetration depths with satisfactory spatial resolution. In particular, Cu2−xS NDs are highly stable in vivo, and can retain their photothermal and photoacoustic effects for longer than other thiolate-protected metal nanoparticles and Ag2S NDs.33
With all of this in mind, herein we report on an emulsion solvent evaporation strategy to construct a multifunctional PLGA nanocapsule, concurrently encapsulating PAI contrast Cu2−xS NDs and a typical HIFU synergistic liquid, perfluorooctyl bromide (PFOB, the nanocapsules were denoted by Cu2−xS/PFOB@PLGA, CPPNs). As a promising theranostic agent, the newly designed nanocapsule system exhibited a unique core/satellite/shell sandwich structure, with PFOB liquid encapsulated in the core, as well as multiple Cu2−xS NDs sandwiched between the liquid core and polymer shell (Scheme 1). The high performance of Cu2−xS NDs in the absorption and conversion of NIR laser endows the CPPNs with high PAI contrast capability for guiding the HIFU synergistic therapy. Moreover, this organic/inorganic nanocomposite could be safely used for other potential clinical applications due to the excellent biodegradability and biocompatibility of PLGA, as well as the optimized particle size of Cu2−xS NDs, conducive to rapid elimination from the body. More importantly, the particle size of the CPPNs is only approximately 120 nm, much smaller than other HIFU therapeutic nanocapsules, rendering them more suitable for high-capacity passive accumulation within tumors. Therefore, this emerging nanoplatform should show great application potential in PAI-guided HIFU synergistic therapy, which may provide an ideal theranostic strategy for noninvasive tumor treatment in the future.
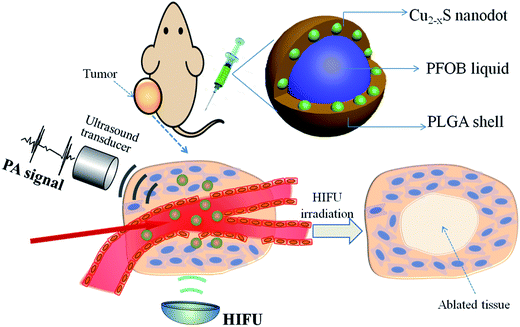 | ||
| Scheme 1 Schematic illustration of CPPNs for photoacoustic imaging-guided synergistic HIFU therapy, including the structural design and theranostic model. | ||
2. Experimental section
2.1 CPPN synthesis and characterization
![[thin space (1/6-em)]](https://www.rsc.org/images/entities/char_2009.gif) 000 rpm and washed three times with CHCl3, before being dispersed in CHCl3 and stored at 4 °C until further use.
000 rpm and washed three times with CHCl3, before being dispersed in CHCl3 and stored at 4 °C until further use.![[thin space (1/6-em)]](https://www.rsc.org/images/entities/char_2009.gif) 000 rpm and stored in PBS solution at 4 °C, until needed for further use.
000 rpm and stored in PBS solution at 4 °C, until needed for further use.2.2 Cu2−xS NDs stability evaluation
2 mg of CPPNs were transferred into dialysis bags (cut off molecular weight 3500 g mol−1). Next, two bags were soaked in plastic tubes containing 30 mL saline at pH 7.4 and 6.0, separately. The tubes were placed into a shaking table at 150 rpm and 37 °C. At various time intervals, 2.0 mL of the solution was collected and diluted with deionized water. Then, the copper ion concentration in solution was measured through ICP-MS.2.3 CPPN biosafety evaluation
2.4 Establishment of the tumor-bearing nude mice model and bio-distribution of CPPNs
Approximately 6 × 10⁷ 4T1 cells were injected into the back of each nude mouse with a volume of 0.15 mL. Tumor dimensions were measured daily using a caliper and tumor volume was calculated according to the following equation:| V = π × L × W2/6, | (1) |
When the volume of the tumor reached ∼1 cm3, six tumor-bearing nude mice were randomly divided into two groups to evaluate the CPPN bio-distribution, 1 h and 24 h after the intravenous injection. The mice were sacrificed at these time points, and Cu concentrations in different organs (tumor, heart, liver, spleen, lung, and kidney) were assessed through ICP-MS after digestion by HClO4/HNO3 (v/v = 3/1) solution.
2.5 Evaluation of CPPN performance in PAI
2.6 Evaluation of CPPNs in HIFU ablation
3. Results and discussion
3.1 Structural characterization of Cu2−xS/PLGA nanocapsules
The fabrication of CPPNs is schematically illustrated in Fig. 1A. Hydrophobic oleylamine-coated Cu2−xS NDs were firstly synthesized in oleylamine solution through a low-temperature redox reaction. TEM images show that Cu2−xS ND particle sizes ranged from 2.5 to 10.5 nm, with an average diameter of 5.9 nm (Fig. 1B and S1†). Such small dimensions are considered bio-safe for clinical cancer therapy translation since they are easily removed from blood by renal clearance, more so than larger analogues.34 A typical emulsion-evaporation process in a mixed dichloromethane/water solvent was employed to simultaneously encapsulate the fabricated Cu2−xS NDs and super-hydrophobic PFOB HIFU-synergistic liquid into the PLGA capsule. Dichloromethane was chosen as the nonpolar liquid phase to ensure full solubility of PLGA and PFOB, as well as the Cu2−xS NDs. Sodium cholate was introduced into the aqueous phase in the synthetic processing of Cu2−xS/PFOB@PLGA nanoparticles, distinct from a traditional emulsion-evaporation strategy, in order to shrink the diameters of the PLGA-based capsules by decreasing oil/water interfacial tension.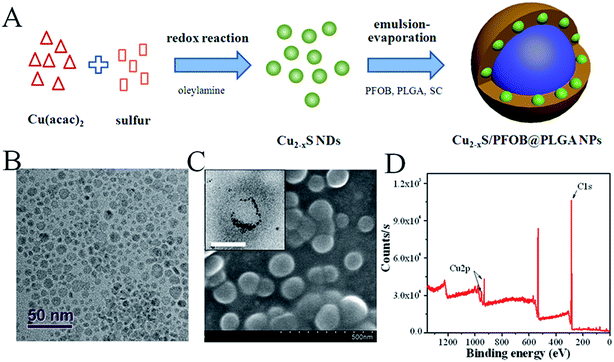 | ||
| Fig. 1 (A) Schematic diagram of the CPPN synthetic procedure (B) TEM images of Cu2−xS NDs. (C) SEM and TEM (inset) images of CPPNs. The scale bar of the inset TEM image is 50 nm. (D) XPS analysis of CPPNs. The Cu 2p spectrum was further divided into Cu 2p1/2 and Cu 2p3/2, and the corresponding peaks were measured at 952.4 eV and 932.5 eV, respectively (Fig. S3†). | ||
The spherical morphology and microstructure of the CPPNs are shown in Fig. 1C. Notably, a considerable quantity of NDs with deep contrast were uniformly distributed around the PFOB liquid inner core, which corresponded to the Cu2−xS NDs, as evidenced by the XPS results detailed in Fig. 1D and S2.† The nanocapsule Cu 2p spectrum exhibited two sets of peaks due to differential elemental valencies. Correspondingly, the characteristic binding energies seen at 932.6 and 952.5 eV were assigned to Cu+, while the peaks observed at 933.7 and 954.6 eV were attributed to Cu2+ (Fig. S3†).
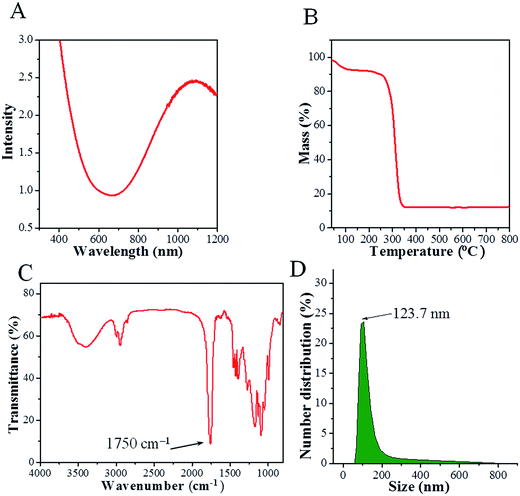
The UV-vis spectrum of a CPPN aqueous dispersion is presented in Fig. 2A. High optical absorption can be observed over the 600 to 1100 nm wavelength range, which is highly consistent with the spectrum of pure Cu2−xS NDs in dichloromethane (shown in Fig. S4†), indicating that the PLGA coating had no influence on the optical properties of Cu2−xS NDs. Moreover, such strong optical absorption in the near-infrared region points to the potential of CPPNs as contrast agents for in vivo PAI. Additionally, the release of copper ions at different time points under two pH conditions (7.4 and 6.0) was determined to evaluate the stability of the Cu2−xS NDs. The results (Fig. S5†) revealed that the quantity of copper ions released was less than 0.1% for both pH conditions, indicating that Cu2−xS NDs can retain their photoacoustic effects for long periods.
The organic composition of the CPPNs was elucidated through TG and FTIR analyses. The mass percentage of Cu2−xS ND was about 10% (w/w) of the whole CPPN, as determined by TG analysis (Fig. 2B). The FTIR spectrum of the CPPNs is presented in Fig. 2C. A sharp absorption band at about 1750 cm−1 can be observed, characteristic of carbonyl stretching vibrations, which are present in both the D,L-lactide and glycolide monomer components of PLGA. The strong bands observed between 1300 cm−1 and 1050 cm−1 correspond to both asymmetric and symmetric C–C(![[double bond, length as m-dash]](https://www.rsc.org/images/entities/char_e001.gif) O)–O vibrations. Additionally, there were also obvious bands observed between 3000 cm−1 and 2800 cm−1, due to aliphatic C–H stretching vibrations, present over all of the polymer skeleton. Notably, characteristic sodium cholate fingerprint peaks (1564 cm−1 and 1649 cm−1) were absent, indicating that sodium cholate was not retained within the CPPNs.36 In summary, the CPPN FTIR spectrum was very similar to the standard PLGA spectrum described in the reported literature, confirming that the organic composition of the capsule shell was mostly comprised of PLGA.37 Furthermore, 19F NMR was used to confirm the existence of PFOB liquid in the CPPNs. The spectra (Fig. S6†) showed obvious characteristic peaks of PFOB, confirming the successful encapsulation of PFOB within the PLGA nanoparticles.
O)–O vibrations. Additionally, there were also obvious bands observed between 3000 cm−1 and 2800 cm−1, due to aliphatic C–H stretching vibrations, present over all of the polymer skeleton. Notably, characteristic sodium cholate fingerprint peaks (1564 cm−1 and 1649 cm−1) were absent, indicating that sodium cholate was not retained within the CPPNs.36 In summary, the CPPN FTIR spectrum was very similar to the standard PLGA spectrum described in the reported literature, confirming that the organic composition of the capsule shell was mostly comprised of PLGA.37 Furthermore, 19F NMR was used to confirm the existence of PFOB liquid in the CPPNs. The spectra (Fig. S6†) showed obvious characteristic peaks of PFOB, confirming the successful encapsulation of PFOB within the PLGA nanoparticles.
The CPPNs were uniform in size with an average hydrodynamic size of 123.7 nm and 145.8 nm at room temperature and 37 °C, respectively, as evaluated by DLS technique (Fig. 2D). Comparatively, the hydrodynamic size of CPPNs at 37 °C was somewhat higher than the same at room temperature, which can be attributed to the swelling behavior of the PLGA polymer and the PFOB liquid core. Additionally, the stability of CPPNs was evaluated by suspending the particles in saline at 37 °C. Notably, the mean hydrodynamic size of the CPPNs remained within a 140 nm to 180 nm range, confirming the stability of the CPPNs (Fig. S7†). Importantly, the vast majority of CPPNs exhibited nanometer grade dimensions, which is much smaller than the Bi2S3-embedded PLGA nanocapsules (Bi2S3/PLGA) and HMME/PLGA microcapsules mentioned and reported previously.9,26 It is believed that such small sized CPPN particles (∼123.7 nm) would be conducive to crossing the vascular endothelium and accumulating within tumors through the enhanced permeability and retention (EPR) effect.38
3.2 CPPN biosafety
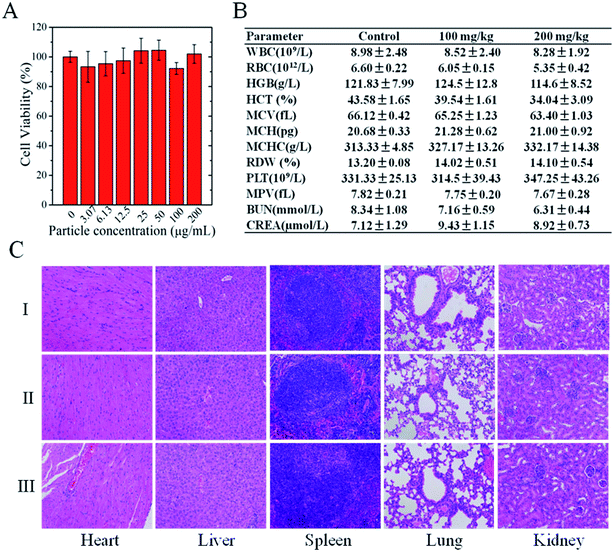
We evaluated the biosafety of CPPNs through in vitro cytotoxicity analyses and in vivo toxicity tests in healthy nude mice. TEM images show that CPPNs could be efficiently internalized after incubation with 4T1 cells for 4 h (Fig. S8†). The CCK-8 assay was employed to further confirm the effect of CPPNs on cell viability, as shown in Fig. 3A. After culture with different concentrations of CPPNs for 24 h, there was no obvious difference in the cell proliferation amongst the groups, which points to favorable CPPN biocompatibility.Four weeks after receiving a tail vein injection of CPPN, negligible influence on hemocompatibility was observed in the biochemical and complete blood analysis of nude mice (Fig. 3B). Furthermore, there was no obvious histopathologic change or damage to organs, including heart, liver, spleen, lung, and kidney, in either the control or the test groups, as shown in Fig. 3C. These in vivo and in vitro results demonstrate the favorable biosafety of CPPNs in physiological environments.
3.3 CPPNs enhance PAI quality
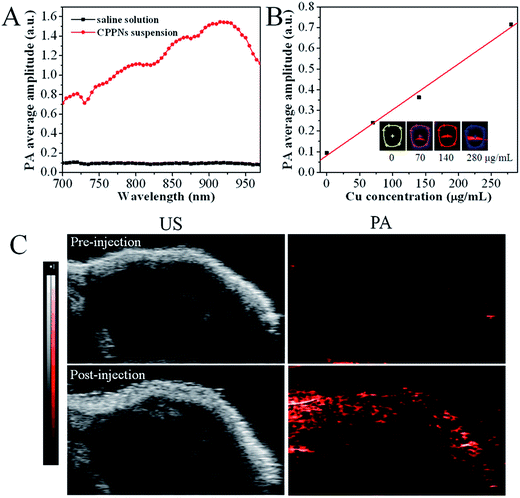
In order to investigate the influence of CPPNs on PAI, both in vitro and in vivo imaging assessments were conducted using a VEVO LASR imaging system, with adjustable excitation wavelength in the near-infrared range. Fig. 4A shows the PA response of CPPNs in saline solution over an excitation range of 700 to 970 nm. The PA signal baseline was approximately 0.1, in contrast, obvious enhancement of the PA response could be observed with the addition of CPPNs, probably due to the optical absorption and thermophysical properties of Cu2−xS NDs. Notably, the fact that the CPPN enhancement effect was not uniform over the entire spectral range demonstrates that the optical and thermophysical properties were selectively sensitive across the near-infrared region. The strongest PA response was at a wavelength of 930 nm, which was chosen as the imaging system excitation wavelength for subsequent experiments, based on this result. Additionally, PA response enhancement increased with increasing CPPN concentration, Fig. 4B. Subsequently, in order to confirm the efficacy of CPPNs in PAI in vivo, 4T1 tumor-bearing Balb/c nude mice were injected intravenously with 0.1 mL of saline, as controls, or CPPNs at a concentration of 200 μg mL−1. Tumor-site B-mode US images and PA images at a wavelength of 930 nm were captured before and after the administration of CPPNs. As shown in Fig. 4C, the PA signal could not be detected before injection. In contrast, obvious PA signal enhancement in the tumor region could be observed 1 h post CPPN injection. Overall, the above results demonstrate that CPPNs hold significant potential as efficient PA contrast agents, both in vitro and in vivo.Furthermore, ICP-MS was employed to quantify the distribution of CPPNs within tumors and typical organs (heart, liver, spleen, lung, and kidney) 1 h and 24 h after intravenous CPPN injection. The statistical results show that about 7.1% of Cu had been uptaken by tumor tissues 1 h post-injection, indicating that enhanced PAI can be mainly attributed to tumor-site enrichment of Cu2−xS NDs (Fig. S9†). Notably, the Cu content had decreased to 2.2% in the tumor region after 24 h, which suggested that PLGA-coated Cu2−xS NDs were gradually eliminated from the tumor, probably due to both PLGA degradation and the small particle dimensions of the Cu2−xS NDs, which favors physiological elimination.
3.4 In vitro HIFU treatment of CPPNs
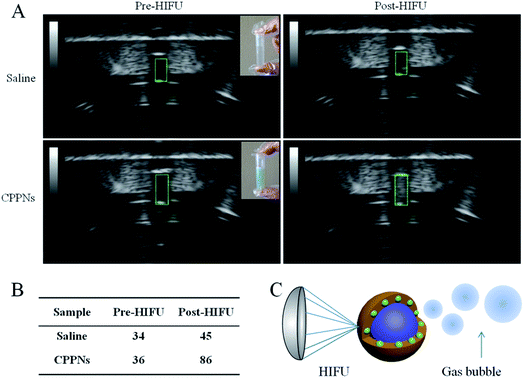
PFOB, which was sealed in situ as the inner core of the CPPNs, exhibits distinct characteristics such as relatively low boiling point and superhydrophobicity, and is considered an excellent HIFU synergistic liquid candidate. To confirm that HIFU was able to trigger the “liquid to gas” phase transition of the encapsulated PFOB, B-mode US images of a CPPN suspension were recorded before and post HIFU exposure. Saline solutions were subjected to HIFU exposure under the same conditions for comparison. Variations of echogenicity in different groups could be immediately observed after receiving HIFU irradiation. As shown in Fig. 5, there was no obvious gray scale difference in the saline group before and after HIFU irradiation, with corresponding gray scale values of 34 dB to 45 dB, respectively. In stark contrast, high echogenicity with a sharp gray scale increase from 36 dB to 86 dB was observed for the CPPN group, pre- and post-irradiation, respectively: indicative of microbubble formation due to the HIFU-induced temperature rise. Morphological CPPN changes were also observed under SEM (Fig. S10†) after HIFU irradiation. Interestingly, the nanometer-size spherical shape of the CPPNs (shown in Fig. 1C) could hardly be observed in the SEM images. Instead, large irregular granules with micrometer dimensions could be observed, indicating structural collapse of the polymer shell. This phenomenon indirectly suggests that HIFU irradiation may induce PFOB release based on a phase transition route. Importantly, according to previous studies, it is believed that these PFOB gas microbubbles may amplify the cavitation effect, resulting in HIFU synergistic effects.393.5 Ex vivo HIFU treatment of CPPNs
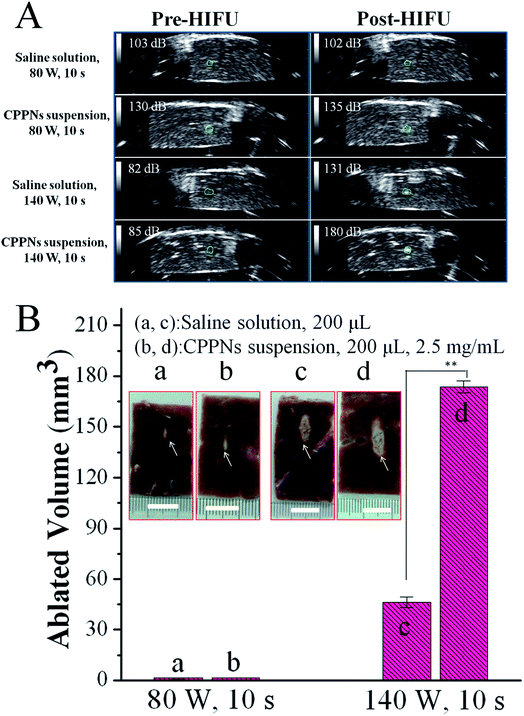
In order to assess the acoustic enhancement capability of CPPNs ex vivo, B-mode US imaging was employed to observe the gray scale changes in degassed bovine livers at a HIFU focus point. This allowed for the quantitative determination of acoustic environmental changes owing to coagulative ablation. In detail, 200 μL of saline or CPPN solution (2.5 mg mL−1) was injected into a focused region of degassed bovine tissue under the guidance of US imaging, which was then subjected to HIFU at an output power of 80 W or 140 W for 10 s. As shown in Fig. 6A, there were no distinguishable gray scale changes in the saline or CPPN groups when the degassed bovine livers were exposed to HIFU at a power output of 80 W for 10 s. When the power was increased to 140 W, the saline group presented obvious enhancement in echogenicity, with an average gray scale change from 82 dB to 131 dB. Impressively, a sharp increase in gray scale, from 85 dB to 180 dB, was observed for the CPPN group, a much larger change than for the saline group.The volume of coagulative necrotic tissue in each degassed bovine liver was also calculated after HIFU exposure. As shown in Fig. 6B, no visual difference could be found between the saline group and the CPPN group when the output power was fixed at 80 W. This result is consistent with previous studies that have demonstrated that relatively low HIFU output power fails to successfully trigger the PFOB cavitation effect, due to low thermal accumulation by HIFU exposure under those conditions.40 As expected, significant necrotic volume enlargement was observed in the CPPN group (173.6 mm3) compared to the saline group (46.3 mm3) when the power was increased to 140 W, indicating the excellent enhancement influence of CPPNs at relatively high HIFU output power.
3.6 In vivo HIFU treatment of CPPNs
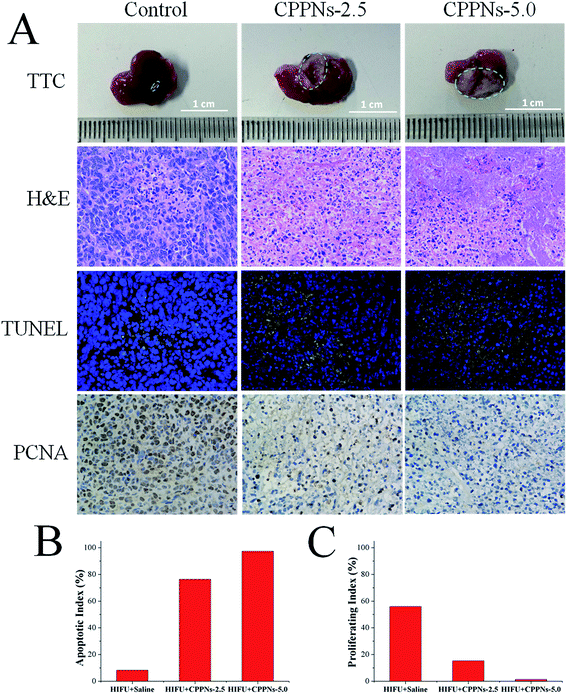
To investigate the therapeutic efficacy of HIFU treatment in vivo, 4T1 tumor-bearing mice were randomly divided into three groups, and received intravenous injection of different samples of equivalent volume (0.25 mL): (A) saline (control); (B) 2.5 mg mL−1 CPPNs (defined as CPPNs-2.5) and (C) 5.0 mg mL−1 CPPNs (defined as CPPNs-5.0). For each group, HIFU exposure was conducted at an output power of 150 W for 10 s (5 s twice, 5 s interval) 1 h after intravenous injection. As shown in Fig. 7A, a remarkable demarcated region between the coagulative necrotic region (white) and non-ablated tissues (red) could be observed in the gross inspection cross section of the CPPN-treated groups after TTC staining. In particular, the tumor was almost completely ablated when the CPPN concentration was increased to 5.0 mg mL−1. The quantitative necrotic volumes of the CPPNs-2.5 and CPPNs-5.0 groups were measured to be 108.2 mm3 and 136.1 mm3, respectively, which were significantly larger than that of the control group (2.5 mm3).To further confirm the degree of destruction after HIFU irradiation in all groups, a series of pathological examinations were undertaken, including H&E staining, TUNEL, and immunohistochemical marking for PCNA. The H&E staining showed that there was no distinct cell damage in the control group, indicating the low therapeutic efficiency of HIFU irradiation alone in the tumor xenograft model. In contrast, obvious coagulative necrosis characteristics, including karyorrhexis, karyopyknosis, and nucleolysis, were observed in both CPPNs-treated groups.
Additionally, the TUNEL assay was applied to evaluate cell apoptosis. The degree of cell apoptosis was reflected by the intensity of the green fluorescence signal, which represented the quantity of single strands of broken DNA in damaged cells. As shown in Fig. 7A, apoptosis was significantly more prevalent in the two CPPN-treated groups than the control group. Quantitatively, the AI of each group was calculated and the results are detailed in Fig. 7B. The two CPPN groups had much higher AI values (76.32% and 97.33% for CPPNs-2.5 and CPPNs-5.0, respectively) than the control group (8.22%), further indicating that CPPNs can improve the therapeutic efficacy of HIFU treatment by inducing tumor cell apoptosis.
The expression of PCNA in each group was also assessed by immunohistochemical staining, which reflects tumor cell proliferation ability. It was easy to find the PCNA-positive tumor cells in the control group, with brown granules observable in the cell nuclei; implying incomplete ablation of tumor tissue (Fig. 7A). However, PCNA-positive tumor cells could hardly be found in the CPPN-treated groups. As shown in Fig. 7C, the corresponding PI of the control group (55.97%) was much higher than those of the CPPN groups (15.26% and 1.40% for CPPNs-2.5 and CPPNs-5.0, respectively). These results suggest that the expression of PCNA was significantly suppressed after HIFU irradiation in the presence of CPPNs.
Finally, tumor cell morphology in each group was observed under TEM (Fig. S11†). While cells in the control group mostly retained their morphological character, the cells in the CPPN groups presented irreversible cell membrane damage and lost their nuclear and mitochondrial integrity. Overall, both the ex vivo and in vivo results demonstrate that CPPNs show excellent synergistic capability in HIFU irradiation against tumor tissues.
4. Conclusions
In summary, an organic/inorganic hybrid enhancement agent for PAI-guided HIFU therapy was successfully fabricated by an emulsion-solvent evaporation strategy. The synthesized CPPNs combined the merits of small particle size (∼123.7 nm), favorable biosafety, and multifunctional theranostic ability into an integrated system. More importantly, the CPPNs exhibited high performance ability in PA contrast imaging as well as in the enhancement of HIFU tumor treatment, both in vitro and in vivo. Overall, we believe that the CPPNs are promising theranostic agents for PAI-guided HIFU synergistic therapy, which have great potential for future clinical cancer therapy applications.Conflicts of interest
There are no conflicts to declare.Acknowledgements
This work was supported by the National Natural Science Foundation of China [grant numbers 81601499, 51402329, 81471673 and 81671699]. The authors are grateful to Mr Qi Wang for his help with high intensity focused ultrasound (HIFU) experiment.References
- A. Napoli, A. Bazzocchi, R. Scipione, M. Anzidei, L. Saba, P. Ghanouni, D. A. Cozzi and C. Catalano, Radiology, 2017, 285, 186–196 CrossRef PubMed.
- B. H. Lang, Y. C. Woo and C. K. H. Wong, Radiology, 2017, 284, 897–906 CrossRef PubMed.
- P. Rischmann, A. Gelet, B. Riche, A. Villers, G. Pasticier, P. Bondil, J. L. Jung, H. Bugel, J. Petit, H. Toledano, S. Mallick, O. Rouviere, M. Rabilloud, H. Tonoli-Catez and S. Crouzet, Eur. Urol., 2017, 71, 267–273 CrossRef PubMed.
- E. Maloney and J. H. Hwang, Int. J. Hyperthermia, 2015, 31, 302–309 CrossRef PubMed.
- J. VanOsdol, K. Ektate, S. Ramasamy, D. Maples, W. Collins, J. Malayer and A. Ranjan, J. Controlled Release, 2017, 247, 55–63 CrossRef CAS PubMed.
- Y. Chen, H. Chen and J. Shi, Adv. Healthcare Mater., 2015, 4, 158–165 CrossRef CAS PubMed.
- J. F. Ward, Surg. Oncol. Clin. N. Am., 2011, 20, 389–407 CrossRef PubMed.
- X. Wang, H. Chen, Y. Chen, M. Ma, K. Zhang, F. Li, Y. Zheng, D. Zeng, Q. Wang and J. Shi, Adv. Mater., 2012, 24, 785–791 CrossRef CAS PubMed.
- M. H. Yao, M. Ma, Y. Chen, X. Q. Jia, G. Xu, H. X. Xu, H. R. Chen and R. Wu, Biomaterials, 2014, 35, 8197–8205 CrossRef CAS PubMed.
- J. Li, T. Krupka, J. Yao, R. Wang, L. Jiang, Y. Zhou, G. Zuo, Z. Wang, L. Dai, J. Ren, Y. Zheng and D. Wang, PLoS One, 2015, 10, e0117358 Search PubMed.
- Y. Sun, Y. Zheng, P. Li, D. Wang, C. Niu, Y. Gong, R. Huang, Z. Wang, Z. Wang and H. Ran, BMC Cancer, 2014, 14, 800 CrossRef PubMed.
- P. P. Deshpande, S. Biswas and V. P. Torchilin, Nanomedicine, 2013, 8, 1509–1528 CrossRef CAS PubMed.
- M. Ma, H. Chen and J. Shi, Sci. Bull., 2015, 60, 1170–1183 CrossRef CAS.
- S. Ellis, V. Rieke, M. Kohi and A. C. Westphalen, J. Med. Imaging Radiat. Oncol., 2013, 57, 391–399 CrossRef PubMed.
- M. Ma, F. Yan, M. Yao, Z. Wei, D. Zhou, H. Yao, H. Zheng, H. Chen and J. Shi, ACS Appl. Mater. Interfaces, 2016, 8, 29986–29996 CAS.
- Y. Chen, H. Chen, Y. Sun, Y. Zheng, D. Zeng, F. Li, S. Zhang, X. Wang, K. Zhang, M. Ma, Q. He, L. Zhang and J. Shi, Angew. Chem., Int. Ed., 2011, 50, 12505–12509 CrossRef CAS PubMed.
- F. M. Knuttel, S. E. M. Huijsse, T. L. Feenstra, C. T. W. Moonen, M. van den Bosch, E. Buskens, M. J. W. Greuter and G. H. de Bock, J. Ther. Ultrasound, 2017, 5, 23 CrossRef PubMed.
- G. J. Tserevelakis, I. Vrouvaki, P. Siozos, K. Melessanaki, K. Hatzigiannakis, C. Fotakis and G. Zacharakis, Sci. Rep., 2017, 7, 747 CrossRef PubMed.
- P. J. van den Berg, K. Daoudi and W. Steenbergen, J. Photoacoust., 2015, 3, 89–99 CrossRef CAS PubMed.
- S. Sreejith, T. T. M. Huong, P. Borah and Y. Zhao, Sci. Bull., 2015, 60, 665–678 CrossRef CAS.
- L. V. Wang, Nat. Photonics, 2009, 3, 503–509 CrossRef CAS PubMed.
- H. Cui, J. Staley and X. Yang, J. Biomed. Opt., 2010, 15, 021312 CrossRef PubMed.
- A. Prost, A. Funke, M. Tanter, J. F. Aubry and E. Bossy, J. Biomed. Opt., 2012, 17, 061205 CrossRef PubMed.
- K. Daoudi, M. Hoogenboom, M. den Brok, D. Eikelenboom, G. J. Adema, J. J. Futterer and C. L. de Korte, Biomed. Opt. Express, 2017, 8, 2235–2244 CrossRef PubMed.
- N. Zhang, X. Cai, W. Gao, R. Wang, C. Xu, Y. Yao, L. Hao, D. Sheng, H. Chen, Z. Wang and Y. Zheng, Theranostics, 2016, 6, 404–417 CrossRef CAS PubMed.
- S. Yan, M. Lu, X. Ding, F. Chen, X. He, C. Xu, H. Zhou, Q. Wang, L. Hao and J. Zou, Sci. Rep., 2016, 6, 31833 CrossRef CAS PubMed.
- W. Xun, J. L. Sanders, D. N. Stephens and O. Oralkan, Conf. Proc. IEEE Eng. Med. Biol. Soc., 2016, 3235–3238 Search PubMed.
- G. D. Moon, S. W. Choi, X. Cai, W. Li, E. C. Cho, U. Jeong, L. V. Wang and Y. Xia, J. Am. Chem. Soc., 2011, 133, 4762–4765 CrossRef CAS PubMed.
- J. U. Menon, P. Jadeja, P. Tambe, K. Vu, B. Yuan and K. T. Nguyen, Theranostics, 2013, 3, 152–166 CrossRef CAS PubMed.
- R. Liu, L. Jing, D. Peng, Y. Li, J. Tian and Z. Dai, Theranostics, 2015, 5, 1144–1153 CrossRef CAS PubMed.
- J. Liu, X. Zheng, L. Yan, L. Zhou, G. Tian, W. Yin, L. Wang, Y. Liu, Z. Hu, Z. Gu, C. Chen and Y. Zhao, ACS Nano, 2015, 9, 696–707 CrossRef CAS PubMed.
- Y. Feng, Q. F. Yao, J. G. Li, N. Goswami, J. P. Xie and J. Yang, Nano Res., 2016, 9, 942–950 CrossRef CAS.
- B. W. Mountain and T. M. Seward, Geochim. Cosmochim. Acta, 2003, 67, 3005–3014 CrossRef CAS.
- J. Mou, P. Li, C. Liu, H. Xu, L. Song, J. Wang, K. Zhang, Y. Chen, J. Shi and H. Chen, Small, 2015, 11, 2275–2283 CrossRef CAS PubMed.
- O. Diou, N. Tsapis, C. Giraudeau, J. Valette, C. Gueutin, F. Bourasset, S. Zanna, C. Vauthier and E. Fattal, Biomaterials, 2012, 33, 5593–5602 CrossRef CAS PubMed.
- W. Shuang, W. U. Xiaowen, L. I. Haiping, R. Zhang and W. Hou, Chem. Res. Chin. Univ., 2014, 35, 1982–1987 Search PubMed.
- M. Stevanovic, J. Savic, B. Jordovic and D. Uskokovic, Colloids Surf., B, 2007, 59, 215–223 CrossRef CAS PubMed.
- F. Sadat Tabatabaei Mirakabad, K. Nejati-Koshki, A. Akbarzadeh, M. R. Yamchi, M. Milani, N. Zarghami, V. Zeighamian, A. Rahimzadeh, S. Alimohammadi, Y. Hanifehpour and S. W. Joo, Asian Pac. J. Cancer Prev., 2014, 15, 517–535 CrossRef PubMed.
- M. Ma, H. Xu, H. Chen, X. Jia, K. Zhang, Q. Wang, S. Zheng, R. Wu, M. Yao, X. Cai, F. Li and J. Shi, Adv. Mater., 2014, 26, 7378–7385 CrossRef CAS PubMed.
- D. Niu, X. Wang, Y. Li, Y. Zheng, F. Li, H. Chen, J. Gu, W. Zhao and J. Shi, Adv. Mater., 2013, 25, 2686–2692 CrossRef CAS PubMed.
Footnote |
| † Electronic supplementary information (ESI) available. See DOI: 10.1039/c7ra12074e |
| This journal is © The Royal Society of Chemistry 2018 |

