 Open Access Article
Creative Commons Attribution 3.0 Unported Licence
Antioxidative and antimicrobial edible chitosan films blended with stem, leaf and seed extracts of Pistacia terebinthus for active food packaging
Murat Kaya *a,
Sanaz Khademab,
Yavuz Selim Cakmaka,
Muhammad Mujtaba
 ag,
Sedef Ilkc,
Lalehan Akyuz
 d,
Asier M. Salaberriae,
Jalel Labidi
 e,
Ako Hamasaeed Abdulqadira and
Engin Deligözf
aDepartment of Biotechnology and Molecular Biology, Faculty of Science and Letters, Aksaray University, 68100 Aksaray, Turkey. E-mail: muratkaya3806@yahoo.com; Fax: +90-382-288-2125; Tel: +90-382-288-2184
bUniversity of Science and Culture, The Faculty of Basic Sciences and Technologies, 19166, Tehran, Iran
cCentral Laboratory Research Center, Ömer Halisdemir University, 51240 Niğde, Turkey
dAksaray University, Technical Vocational School, Department of Chemistry Technology, 68100, Aksaray, Turkey
eBiorefinery Processes Research Group, Department of Chemical and Environmental Engineering, University of the Basque Country (UPV/EHU), Plaza Europa 1, 20018 Donostia-San Sebastian, Spain
fDepartment of Physics, Faculty of Science and Letters, Aksaray University, 68100 Aksaray, Turkey
gInstitute of Biotechnology, Ankara University, Ankara 06110, Turkey
First published on 17th January 2018
Abstract
Methanol extracts of stem, leaf, and seed obtained from Pistacia terebinthus which are rich in phenolic compounds were used for the first time to produce chitosan-based antioxidative and antimicrobial films. All the produced films were characterized by FT-IR, TGA, DSC, SEM, contact angle measurements, and UV-Vis spectroscopy and mechanically. As was expected, incorporation of the plant extracts into chitosan films enhanced the antioxidant and antimicrobial activities effectively. Also, the elasticity of chitosan-seed and chitosan-stem films was improved. The eco-friendly nature of the produced blend films was determined through soil and water degradation analyses. All these findings lead to the conclusion that the produced blend films with Pistacia terebinthus extracts can be applied as alternative food packaging material.
1. Introduction
Petroleum-based films are creating serious environmental problems worldwide due to their un-degradable features and harmful effects on humans and other organisms.1,2 To escape these problems, scientists have been developing biodegradable and edible films using natural ingredients such as lipids, proteins, polysaccharides and some other animal and plant extracts.3–7 Edible films improve the shelf life of products by delaying food spoilage, preserving food against pathogens, preventing oxidation and protecting from moisture.3,8,9 The natural materials used for the production of edible films have many benefits such as edibility, biocompatibility, antioxidant, thermostability and antimicrobial properties, food protection, pharmaceutical applications etc. Also, these materials are inexpensive, easily available and abundant.Chitosan, a deacetylated derivative of chitin is a well-known commonly used film forming material.10 Chemically chitosan consists of (1,4)-linked 2-amino-deoxy-b-D-glucan. It has a broad spectrum of applications in every practical field of life directly or indirectly i.e. pharmacy, medicine, agriculture, food, cosmetic, textile and water treatment etc. thanks to it's acceptable mechanical, chemical and biological properties.11–13 To improve the mechanical, hydrophobic, antioxidant and antimicrobial properties of native chitosan films, various active compounds (lipids, fatty acids, essential oils and some other plant extracts) have been incorporated into chitosan films.14,15
P. terebinthus is a deciduous tree and belongs to Anacardiaceae family. It is a small tree growing up to 10 m in the Middle East and Mediterranean region.16 The extracts of this plant have anti-inflammation and antioxidant flavonoid, omega-3 fatty acids, tannin and other valuable compounds.17,18 Being a traditional medicine, it is using for the treatment of liver and kidney and also drinks coffee.19,20 It can be used in the production of vegetable oils because of its high amount of oleic acid.17 These advantages make the extracts of P. terebinthus as a suitable ingredient to be used in edible film production.
Considering various useful properties of P. terebinthus, this study was aimed to produce edible chitosan-based films incorporated with the stem, leaf, and seed methanol extracts. The produced films were characterized both biologically (antimicrobial and antioxidant activities) and physicochemically (FT-IR, TGA, DSC, SEM, contact angle, mechanical properties and optical transmittance).
2. Materials and methods
2.1. Materials
Chitosan (medium molecular weight and 85% de-acetylation degree, Cas No. 448877) was purchased from SIGMA-Aldrich, USA. The acetic acid (CH3COOH), hydrochloric acid (HCl), glycerol (C3H8O3) and methanol (CH3OH) were supplied from MERCK, Germany. The plant material (P. terebinthus) was collected from Aleppo, Northern Iraq on 13 July 2016.2.2. Extract isolation
Each plant part i.e., seed, leaf, and stem were ground to fine powder by using WARING commercial blender. Methanol was added to each sample and sonicated using WUC-D10H, DAIHAN sonicator for 10 m. Finally, the methanol solution was evaporated and plant extracts were obtained.2.3. Determination of phenolic compounds
The phenolic component analysis was performed on an Agilent brand 1290 Infinity model HPLC instrument. Analyzes were performed using the C18 column and DAD detector according to Caponio, et al.21 2% acetic acid (A) and methanol (B) were used as the mobile phase. The flow rate was 1 mL min−1. For mobile phase; (3 min 95% A/5% B, 15 min 80% A/20% B, 2 min isocratic, 10 min 60% A/40% B, 10 min 50% 10 min) was applied with a gradient of 100% B. The extract was injected with 10 μL of the solution prepared with methanol to give a concentration of 20 mg mL−1.2.4. Film production
Four different types of chitosan films were produced, three of which were incorporated with leaf, stem and seed extract while the fourth one was used as a control without incorporating any extract. Briefly, 1 g of chitosan was added to 100 mL of distilled water and 100 μL of 1% acetic acid to make chitosan solution. The mixture was stirred for 48 h via magnetic stirrer. Then 1 g of each plant extract was added to 5 mL methanol and was vortex (VELP SCIENTIFICA, Vortex mixer) for 5 min. Then 1 mL of methanol mixture was incorporated with 60 mL of chitosan solution and 100 μL of glycerol as plasticizer. All solutions were homogenized at 26![[thin space (1/6-em)]](https://www.rsc.org/images/entities/char_2009.gif) 000 rpm for 5 min with a homogenizer (Heidolph, Silent Crusher M). Each solution was poured into a plastic Petri dish. The Petri dishes were kept at 30 °C for 48 h. Finally, the films were collected from Petri dishes and stored for further analysis.
000 rpm for 5 min with a homogenizer (Heidolph, Silent Crusher M). Each solution was poured into a plastic Petri dish. The Petri dishes were kept at 30 °C for 48 h. Finally, the films were collected from Petri dishes and stored for further analysis.
2.5. Fourier transform infrared spectroscopy (FT-IR)
The FT-IR spectra of control and blend films were recorded at 8 cm−1 resolution and in the range between 600 to 4000 cm−1 by PerkinElmer Spectrometer.2.6. Thermogravimetric analysis (TGA)
The thermal stabilities of the films were carried out for both control and blend films via TGA Q500 – TA Instruments. ∼5 mg of the film sample was used for each analysis. Film samples were heated at a constant temperature rate of 10 °C min−1 from 30 °C to 600 °C under a nitrogen atmosphere.2.7. Differential scanning calorimeter (DSC)
To determine the endothermic and exothermic properties of film samples incorporated with P. terebinthus extracts, DSC analysis was carried by using a Mettler Toledo DSC822e (Schwerzenbach, Switzerland). The analysis was carried out under N2 atmosphere under the temperature range between −50 to 420 °C. For each film sample, 50 mg was used during the analysis. Film samples were placed in a hermetic aluminum pan and the heating scan was regulated as 5 °C min−1.2.8. Scanning electron microscopy (SEM)
For determination of surface morphology and cross-section of the control film and chitosan-based films incorporated with P. terebinthus extracts SEM analysis was performed using Zeiss, Eco 40 (Germany). All the film samples were coated with the layer of gold/palladium prior to taking images.2.9. Biodegradability
Biodegradability was tested by using two different methods i.e., water solubility and soil degradation. Both of the methods were repeated thrice. Solubility in water and soil was calculated by using the following equation:| WL (%) = weight loss/initial weight × 100 |
2.10. Contact angle
Sessile drop contact angle analysis was carried out for control film and chitosan-based films incorporated with P. terebinthus extracts using a Data Physics video-based contact angle measurement system OCA20. Accurate drop volume was measured through software controlled dosing volume weight-drop. The contact angle was measured by using water. For each film sample, eight measurements were taken.2.11. UV-Vis transparency
The transparency of control film and chitosan-based blended with P. terebinthus plant extracts was observed in the visible light range (400–700 nm) by using a UV spectrophotometer (Shimadzu UV-3600 UV-Vis-NIR).2.12. Mechanical properties
The tensile strength (TS), the percentage of elongation at break (EB %), and Young's modulus (YM) were recorded in the ambient temperature for control film and chitosan-based blended film with P. terebinthus plant extracts. The load cell of 250 N and at a rate of 5 mm min−1, deformation of the films were determined by using Material Testing Systems (MTS Insight 10) equipment. MTS Test Works 4 software was applied for calculating the mechanical properties. Mitutoyo, China (a digital micrometer) was used for the measurements of the film thickness.2.13. Antioxidant activity
| Inhibition (I%) = ((Acontrol − Asample)/Acontrol) × 100 |
| Acontrol = absorbance of DPPH solution |
| Asample = the absorbance of the films + DPPH |
2.14. Antimicrobial activity
2.15. Anti-quorum sensing activity
| % Violacein inhibition = ((control (OD585) − test (OD585))/control (OD585)) × 100 |
3. Results and discussion
3.1. FT-IR
In order to determine the molecular interactions in the films among chitosan and leaf, seed and stem extracts of P. terebinthus, FT-IR analysis was carried out. FTIR spectra of chitosan, P. terebinthus extracts and blend films are shown in Fig. 1. In the first spectrum, characteristic chitosan peaks were recorded as –OH bonds (3288.10 cm−1), C–H aliphatic stretching vibration (2873.78 cm−1), amide I (1651.51 cm−1), amide II (1557.79 cm−1), amide III (1374.07 cm−1) and C–O stretching vibration (1025.51 cm−1). As seen from the spectrum of chitosan film, structural changes occurred during the film formation. Addition of the glycerol to the film matrix (chitosan, acetic acid, and water), affected the intermolecular interactions resulted in expand in the OH bond and increase in the intensity of amide I, II and III bands.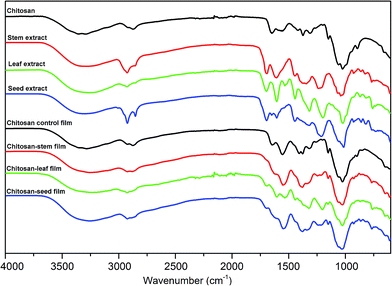 | ||
| Fig. 1 FT-IR spectra of chitosan; stem, leaf and seed extracts of Pistacia terebinthus; chitosan control film; chitosan-stem film; chitosan-leaf film and chitosan-seed film. | ||
The FTIR spectra of P. terebinthus' leaf, seed, and stem extracts showed a broad absorption peak nearly 3300 cm−1 corresponding to –OH stretching. However, the spectrum of the leaf extract was observed differently from the spectra of stem and seed extracts. C–H symmetric stretching vibrations of the polyphenolic structures at around 2925.00 cm−1 showed strong absorption peaks in the seed and stem extracts, while the peak of leaf extract revealed a weak absorption in the same region. Increase in polyphenolic content in the leaf extract (see HPLC results) resulted in overlapping of the OH band with the CH stretching peak.
C![[double bond, length as m-dash]](https://www.rsc.org/images/entities/char_e001.gif) O stretching vibrations were detected at 1691.76, 1698.91 and 1695.23 cm−1 for steam, leaf and seed extracts, respectively. Shifting of the C
O stretching vibrations were detected at 1691.76, 1698.91 and 1695.23 cm−1 for steam, leaf and seed extracts, respectively. Shifting of the C![[double bond, length as m-dash]](https://www.rsc.org/images/entities/char_e001.gif) O peak absorption to lower wavelength may result from the conjugation of the carbonyl group bonded to an aromatic ring. Conjugated C
O peak absorption to lower wavelength may result from the conjugation of the carbonyl group bonded to an aromatic ring. Conjugated C![[double bond, length as m-dash]](https://www.rsc.org/images/entities/char_e001.gif) C stretching vibrations of the aromatic ring were detected at around 1600.00 cm−1 for all the extracts. Schulz and Baranska23 reported that the bands appearing near at 1601 cm−1 assigned to the benzene ring of the polyphenolic compounds. In the present study, these peaks of leaf and seed extract were observed at around 1606 cm−1 as more intense than the stem extract peak. This phenomenon can be explained with the leaf and seed extract had higher polyphenolic content. The peaks at around 1440.00 cm−1 can also be formed by contribution of aromatic C
C stretching vibrations of the aromatic ring were detected at around 1600.00 cm−1 for all the extracts. Schulz and Baranska23 reported that the bands appearing near at 1601 cm−1 assigned to the benzene ring of the polyphenolic compounds. In the present study, these peaks of leaf and seed extract were observed at around 1606 cm−1 as more intense than the stem extract peak. This phenomenon can be explained with the leaf and seed extract had higher polyphenolic content. The peaks at around 1440.00 cm−1 can also be formed by contribution of aromatic C![[double bond, length as m-dash]](https://www.rsc.org/images/entities/char_e001.gif) C bonds. C–H out-of-plane bending vibrations of substitute aromatic ring were observed in the range of 927.00–750.00 cm−1.
C bonds. C–H out-of-plane bending vibrations of substitute aromatic ring were observed in the range of 927.00–750.00 cm−1.
It was observed that the intensities and frequency regions of peaks in the spectrum of chitosan film changed the type of the extract in tested samples. Inter- and intra-molecular hydrogen bonds formed between stem extract and film matrix were resulted in broader –OH bond peak (3253.14 cm−1) than in the spectrum of chitosan control film. Interestingly, C![[double bond, length as m-dash]](https://www.rsc.org/images/entities/char_e001.gif) O stretching vibration belonging to chitosan and stem extract was not observed in the chitosan-stem film. This may be due to the fact that, all of the C
O stretching vibration belonging to chitosan and stem extract was not observed in the chitosan-stem film. This may be due to the fact that, all of the C![[double bond, length as m-dash]](https://www.rsc.org/images/entities/char_e001.gif) O group found in the chitosan-stem film were affected by the hydrogen bonds. Besides, the intensities of amide II (1549.12 cm−1) and amide III (1379.55 cm−1) peaks of chitosan increased. Additionally, weak peaks observed in the wave-number range 609.00–926.27 cm−1 were attributed to C–H bending vibrations of substituted aromatic ring. This was another indication of strong intermolecular interactions between stem extract and film matrix.
O group found in the chitosan-stem film were affected by the hydrogen bonds. Besides, the intensities of amide II (1549.12 cm−1) and amide III (1379.55 cm−1) peaks of chitosan increased. Additionally, weak peaks observed in the wave-number range 609.00–926.27 cm−1 were attributed to C–H bending vibrations of substituted aromatic ring. This was another indication of strong intermolecular interactions between stem extract and film matrix.
In the leaf film spectrum, –OH bond expanded and overlapped with CH stretching peak due to the hydrogen bond formation between phenolic OH groups and chitosan. Conjugated C![[double bond, length as m-dash]](https://www.rsc.org/images/entities/char_e001.gif) C bonds of the aromatic ring were observed at 1605.44 cm−1 in the leaf spectrum. The intensities of the amide II (1532.03 cm−1), amide III (1322.14 cm−1) and CH2 (1204.27 cm−1) bending absorption increased due to the effect of the molecular interactions between leaf extract and the film matrix. Similar results were observed in the fingerprint region of the chitosan-seed film spectrum. However, –OH bond absorption was recorded as narrower than the leaf band absorption. This may be due to the fact that the number of hydrogen bonds was less in the chitosan-seed extract film.
C bonds of the aromatic ring were observed at 1605.44 cm−1 in the leaf spectrum. The intensities of the amide II (1532.03 cm−1), amide III (1322.14 cm−1) and CH2 (1204.27 cm−1) bending absorption increased due to the effect of the molecular interactions between leaf extract and the film matrix. Similar results were observed in the fingerprint region of the chitosan-seed film spectrum. However, –OH bond absorption was recorded as narrower than the leaf band absorption. This may be due to the fact that the number of hydrogen bonds was less in the chitosan-seed extract film.
Mayachiew and Devahastin24 reported that a new peak observed at the 1720 cm−1 with the addition of gooseberry extract into the chitosan film. They explained this peak as an ester linkage formed between chitosan and polyphenolic compounds. In the present study, the new peaks were observed at around 1720 cm−1 with the increase in the polyphenolic contents of extract. This result was an agreement with the Mayachiew and Devahastin result. The FTIR analysis results revealed that successfully incorporation of different extracts of P. terebinthus into the chitosan film resulted in different molecular interactions in the film matrix.
3.2. TGA analysis
The thermogravimetric results of the chitosan control and blend films are presented in Fig. 2. For all the films, degradation was recorded in three steps. The first stage was recorded around 50–100 °C (about 5% decomposition for each film). This first mass loss can be attributed to the water evaporation from the polymeric structures. The second step was observed around 120–200 °C and it can correspond to the decomposition of glycerol.25 The main mass loss was recorded around 240–300 °C and it was because of the denaturation of chitosan polymeric organization and plant extracts.26 In this step chitosan-stem extract film showed similar stability to the control film, however, the figure demonstrates, incorporation of seed extract to chitosan matrix decreased the thermal stability. These stages of decomposition were in agreement with the chitosan-based film incorporated with thyme oil.27 At the end of thermal degradation, ash contents for chitosan control, chitosan-stem, chitosan-leaf and chitosan-seed films was recorded as 34.44%, 29.19%, 39.122 and 35.51%, respectively. In general, the thermal stabilities of chitosan blend films were not affected by the incorporation of plant extracts.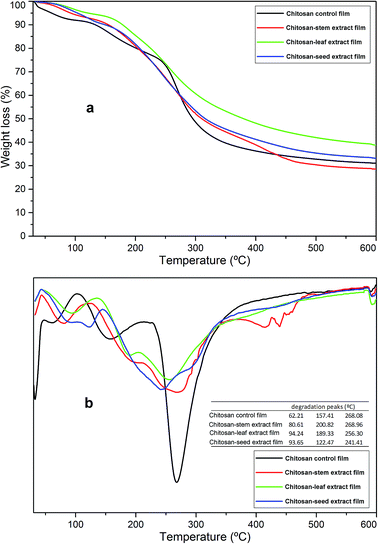 | ||
| Fig. 2 (a) TGA and (b) DTG thermograms of the chitosan control film and blend films incorporated with Pistacia terebinthus' extracts as; chitosan-stem film, chitosan-leaf film and chitosan-seed film. | ||
Additionally considering some previous reports regarding the production of chitosan blend films, same phenomena was recorded in those reports; i.e. Pelissari, F.M. et al.,28 observed the same results when cassava starch−chitosan films were incorporated with oregano essential oil. The overall thermal stability did not reveal any increase in case of blend films. Kanmani P. et al.,29 reported that no alteration was observed in the thermal stability (dTGAmax) of the chitosan films when blended with carrageenan/grapefruit seed extract.
3.3. DSC
The DSC thermograms of the chitosan film and composite films are shown in Fig. 3. Chitosan-control film exhibited two endothermic (72.24 and 154.64 °C) and one exothermic peak (269.65 °C). The first exothermic peak at 269 °C corresponded to the phase inversion temperature of decomposition of chitosan. Peng, Wu and Li30 reported the similar result for chitosan film. Also, they explained that the phase inversion temperature was reduced by the addition of tea extract into the chitosan film. The similar results were found in the present study. The thermal stability of chitosan films decreased with the incorporation of the leaf, stem and seed extracts, due to the decreasing of crystallinity of the films Martins J.T. et al.31 Blend films incorporated with P. terebinthus extracts showed two endothermic peaks. For chitosan-stem, chitosan-leaf and chitosan-seed the two endothermic peaks were observed as; 80.16–196.44 °C, 88.01–186.66 °C and 102.45–203.15 °C, respectively. The first endothermic peaks for chitosan-control and blend films can be attributed to evaporation of solvent traces (water, acetic acid, and methanol) used during the production of composite films.27 While the second endothermic DSC peaks for blend films can be ascribed to the denaturation of glycerol and extract components.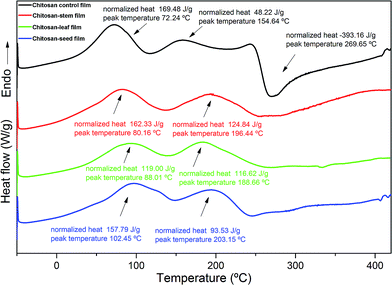 | ||
| Fig. 3 DSC thermograms of the chitosan control film and blend films incorporated with Pistacia terebinthus' extracts as; chitosan-stem film, chitosan-leaf film and chitosan-seed film. | ||
3.4. SEM
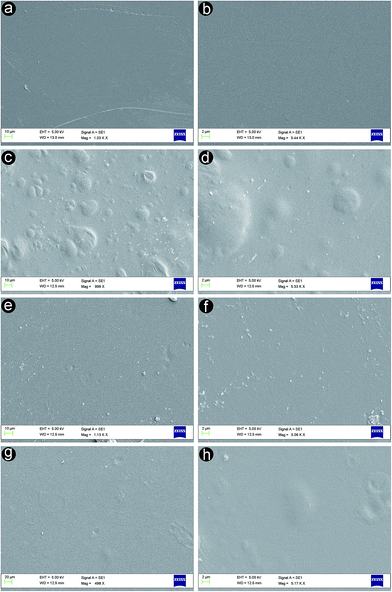
The surface characteristics of chitosan control and chitosan blend films are presented in Fig. 4. As is seen from the figure, surface morphology of chitosan-control was observed as smooth, compact, and without any crack or pores (Fig. 4a and b), it was similar to results of the other studies.25,27 Nevertheless, composite films exhibited irregular forms. The chitosan-stem extract film had many bulges and tiny particles on the surface (Fig. 4c and d). Chitosan-leaf extract film also exhibited heterogeneous form, but it had lower bulges and higher pieces (Fig. 4e and f) and was more homogenous than chitosan-stem extract film. Although chitosan-seed extract film showed some roughness and particles, it was detected as a more regular film to the blend films (Fig. 4g and h). Almost similar surface morphologies were revealed from the SEM micrographs in other studies reporting the incorporation of fruit extracts in chitosan blend films.32–353.5. Water solubility and soil degradation
The water solubility of the chitosan-control film was recorded as 24% in 48 h. Incorporations of plant extracts into the films demonstrated significant (P < 0.05) increase in film solubilities as 35.27%, 45.31% and 50.7% for chitosan-leaf, chitosan-stem, and chitosan-seed film, respectively. This chitosan film degradation was witnessed in accordance with previous reports (23.52 ± 1.26%).36 The weak intermolecular interactions between plant extracts and chitosan matrix resulted in higher degradation values into the chitosan blend films. Higher solubility rate for the chitosan-seed film was probably due to the faster diffusion and disruption of molecular interactions.Soil degradation rates in 15 days were recorded as 89.04% for chitosan control film, 98.76% for chitosan-leaf film, 78.65% for chitosan-stem film and 56.35% for the chitosan-seed film. The chitosan-leaf film exhibited higher soil degradability, however, lower soil degradability was observed for the chitosan-seed film.
3.6. Contact angle
The contact angle is another parameter to determine hydrophobic and hydrophilic nature of materials. Water wettability of the film surface is associated with the final angle of the water drop. In order to check the effect of the stem, seed and leaf extract on film wettability, the contact angle values were calculated for chitosan control, chitosan-stem, chitosan-seed and chitosan-leaf films as 86.3 ± 1.43°, 82.1 ± 1.83° and 91.35 ± 3.05° and 61.8 ± 5.54°, respectively. Chitosan-leaf extract film showed hydrophilic feature as its contact angle observed at 61.8°. However, chitosan-leaf extract film has lower water solubility rate. As seen from the HPLC results, leaf extract has maximum polyphenolic content. Increase in polyphenolic content caused strong interactions in the film matrix and reduced water solubility. However, hydrophilic groups of the polyphenolic compounds such as carboxyl, hydroxyl were interacted with the water on the film surface and reduced the contact angle. Same phenomena were reported by Jin et al.,37 when chitosan matrix was incorporated with genipin. An increase in the genipin content affected the overall film wettability in a positive manner. In another report by Ramírez et al.,38 a reducing pattern was observed for contact angle of the chitosan-based when incorporated with murta leaves extract.3.7. Visual appearance and light transmission of the films
Appearance and color of the food coatings are one of the most important factors influencing the nutrients quality and customers attraction. As is shown in the Fig. 5 chitosan control film was appeared as clear, glossy, smooth, and without any tents. The visual appearance of chitosan-stem extract, chitosan-leaf extract, and chitosan-seed extract composite films was observed as light yellow, green and light brown color, respectively. Previous literature reports also, explained the same phenomena, that adding plant extracts to chitosan matrix, changed the film's color.27,39 Control, chitosan-stem extract, and chitosan-seed extract films were homogeneous and without any wrinkle, pores or bubbles. Contrarily, chitosan-leaf extract film exhibited granules and evenly distributed rare bubbles on its surface. Chitosan-leaf film had not enough flexibility and it was broken easily. The color of chitosan-leaf extract film can be due to different compounds in the leaf structure and existence more pigments (chloroplasts) than the other parts.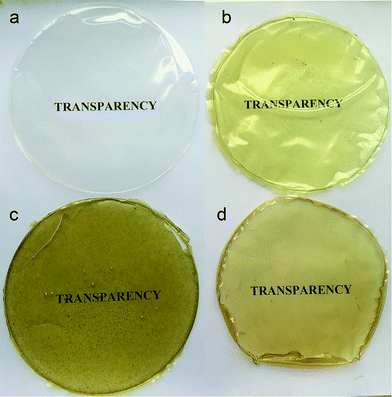 | ||
| Fig. 5 Visual transparency of the chitosan control film and blend films incorporated with Pistacia terebinthus' extracts as; chitosan-stem film, chitosan-leaf film and chitosan-seed film. | ||
Optical transmittance of chitosan control and blend films was measured in the visible spectrum (Fig. 6). The addition of plant extracts into chitosan film decreased the transparency. The transmittance rate at 700 nm was recorded 89.79% for chitosan control film, 66.6% for chitosan-seed film, 63.16% for chitosan-stem film and 44.76% for the chitosan-leaf film. The gradual decrease in the transparency rate of blend films can possibly due to the presence of pigments and tints on the film surface.
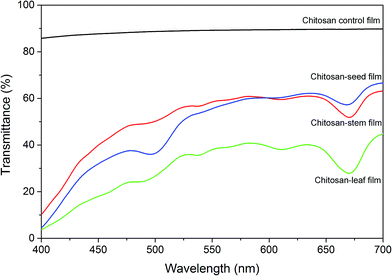 | ||
| Fig. 6 Optical transmittance of the chitosan control film and blend films incorporated with Pistacia terebinthus' extracts as; chitosan-stem film, chitosan-leaf film and chitosan-seed film. | ||
3.8. Mechanical properties and thickness
Evaluation of tensile strength, Young's modulus and elongation at break are vital characteristics for understanding the behavior of biomaterials during their practical applications i.e., packaging and shipping.40 In this context, mechanical properties of blend films were measured and the results are given in Fig. 7. Young's modulus can be described as a measurement of the stiffness of any bio-based materials. On the other hand, the tensile strength can be explained as the maximum engineering stress level reached in a tension test. When the value of Young's modulus is large, it indicates the stiffness of the material. In this context, in the present study, due to the higher value of Young's modulus for chitosan control and chitosan-leaf films were observed comparatively stiffer. For chitosan control film, Young's modulus (1251.89 ± 33.90 MPa) and tensile strength (26.86 ± 3.50 MPa) were recorded about two times higher than chitosan-leaf extract film and much higher than chitosan-stem extract and chitosan-seed extract films. In this context, chitosan control and chitosan-leaf films were recorded stiffer than other films.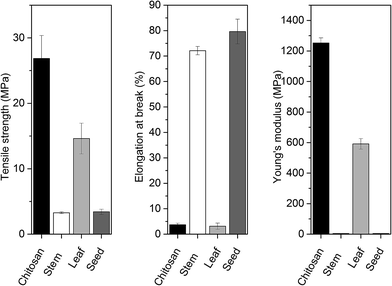 | ||
| Fig. 7 The mechanical properties of the chitosan control film and blend films incorporated with Pistacia terebinthus' extracts as; chitosan-stem film, chitosan-leaf film and chitosan-seed film. | ||
From Fig. 7, it can be seen that chitosan-stem extract and chitosan-seed extract films exhibited a large elongation at break. Therefore, these composite films had ductile nature. On the other hand, elongation at break values of chitosan-stem extract (72.13 ± 1.65%) and chitosan-seed extract (79.62 ± 4.86%) films was observed much higher than chitosan control film (3.72 ± 0.57%) and chitosan-leaf extract film (3.11 ± 1.23%). These results exhibited that incorporation of seed and stem extract from P. terebinthus highly increased the elasticity of the chitosan film. So the chitosan control film can be suggested as the stiffest among the other considered films. It can be noted that tensile strength and Young's modulus of chitosan control film were recorded about two times higher than chitosan-leaf extract film and much higher than chitosan-stem extract and chitosan-seed extract films. It is evident that the chitosan-stem extract exhibited flexible and weak behavior as indicated by a very high elongation at break, a very low tensile strength (3.28 ± 0.15 MPa). These results also revealed that incorporation of stem and seed extract from P. terebinthus highly increased the elasticity of the chitosan film.
When examined visually and handled, it was realized that chitosan-leaf extract film was fragile. However, chitosan-stem extract and chitosan-seed extract films were flexible. In some earlier studies, the addition of essential oils and plant extracts into the chitosan films increased the elongation at break39,41,42 as it was recorded in the present. Park and Zhao43 reported the reduction in tensile strength and elongation at break due to the decreasing of the crystallinity of the edible film and intermolecular hydrogen bonding formed in the film matrix. As seen from the HPLC results, the polyphenolic content of the leaf extract was too high, which capable of the H bonding.
Thickness values of chitosan control, chitosan-stem, chitosan-leaf and chitosan-seed films were measured as 50 ± 9.4 μm, 71.75 ± 5.31 μm, 104.75 ± 14.3 μm and 70.8 ± 1.7 μm, respectively.
3.9. Phenolic compounds
Phenolic compounds of stem, leaf and seed extracts from P. terebinthus were determined and the results are presented in Table 1. The presence of 15 different phenolic compounds was quantified (Fig. 8). Major phenolic compounds of leaf extract were recorded as epicatechin, sinapic acid, gallic acid and benzoic acid. Main components of stem extract were observed as hydroxybenzoic acid and gallic acid. In seed extract, gallic acid, epicatechin, and catechin were found as main phenolic compounds.| Phenolic compounds | Leaf (μg g−1) | Stem (μg g−1) | Seed (μg g−1) |
|---|---|---|---|
| Gallic acid | 4232.69 | 5074.34 | 5841.94 |
| Catechin | — | 4197.40 | 3110.45 |
| Chlorogenic acid | 330.40 | 168.87 | 1745.19 |
| Caffeic acid | 873.88 | — | 1968.65 |
| Hydroxybenzoic acid | 2630.26 | 5903.19 | — |
| Epicatechin | 6104.84 | 324.02 | 3710.97 |
| Syringic acid | 2582.08 | 456.45 | 32.56 |
| Coumaric acid | 1060.47 | — | — |
| Trans-ferrulic acid | — | — | — |
| Sinapic acid | 4280.29 | — | — |
| Benzoic acid | 3838.17 | — | 1776.75 |
| Hesperidin | 672.34 | — | 1918.01 |
| Rosmarinic acid | 1417.50 | — | — |
| Cinnamic acid | 748.95 | 914.59 | — |
| Quercetin | — | — | — |
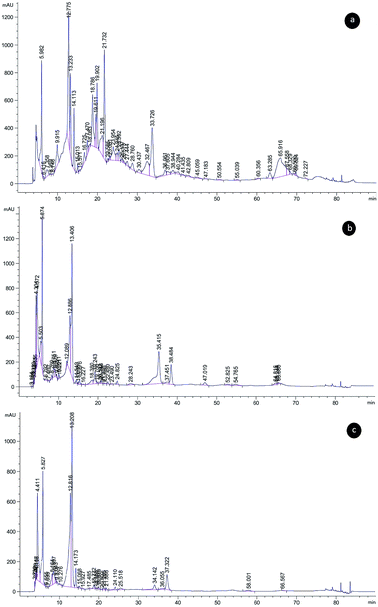 | ||
| Fig. 8 Chromatograms of the phenolic compounds identified and separated from Pistacia terebinthus' extracts; (a) leaf, (b) seed, (c) stem. | ||
3.10. Antioxidant activity
DPPH assay was used to determine the radical scavenging activities of the produced chitosan films incorporated with stem, leaf and seed extracts of P. terebinthus along with chitosan control. Antioxidant activities of chitosan control film, chitosan-stem film, chitosan-leaf film and chitosan-seed film were measured as 37.21 ± 2.07%, 94.43 ± 0.13%, 93.98 ± 0.17% and 95.91 ± 0.15% respectively. As is seen, the addition of methanol extracts from P. terebinthus' stem, leaf and seed notably improved the antioxidant properties of the blend films. This can be ascribed to already known the high antioxidant activity of P. terebinthus due to its hydrogen-donating property and rich phenolic content.17 Considering these results, it can be stated that with current analysis, one of the main aims of the present study was achieved as highly antioxidative edible films were produced by successfully incorporating the P. terebinthus extracts. Current antioxidant results for the produced films were observed to be higher than previously reported chitosan film with green tea extract14 and was found close to chitosan-based film with thyme oil.273.11. Antimicrobial efficacy
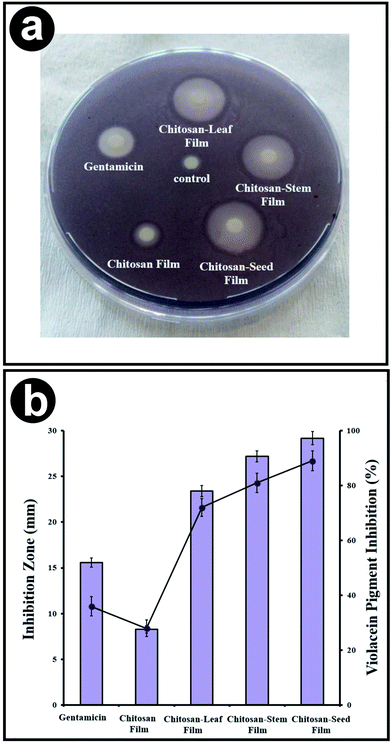
The antimicrobial activities of chitosan control, chitosan blend films with three different extracts of P. terebinthus was investigated against food borne pathogens. This is the first report on the antimicrobial activities of P. terebinthus extracts blended chitosan films against food pathogens. The chitosan blend films with the plant extract were found to be effective against especially Gram-negative bacteria such as P. microbilis, P. vulgaris, P. aeruginosa and E. coli (inhibition zones were ranged in 28.19 ± 0.92–21.33 ± 0.74 mm). Gram-negative bacteria are often resistant to conventional antimicrobial drugs because of their tenacious nature ability and expression of active efflux pumps however in the current study, Gram-negative bacteria did not reveal any activity in the case of chitosan blended films with P. terebinthus' extracts.44,45 Furthermore, different compounds of P. terebinthus incorporated into chitosan films also presented antibacterial zones as 26.63 ± 0.81–20.03 ± 0.68 mm against Gram positives. Also, chitosan-seed film indicated the greatest antimicrobial activity (ranged in 28.19 ± 0.98–20.33 ± 0.72 mm) than the other blended films. In all tests, control disc with the only solvent displayed no inhibition zone and chitosan control film showed lower inhibition zone than blended films. From this result, it was concluded that incorporating of the plant extract into chitosan films provided higher antimicrobial activity because of compounds of P. terebinthus contain several volatile ingredients, most important of which are flavonoids and polyphenols.46,47 In addition, the inhibition zones of chitosan blend films indicated higher activity than that of commercial antibiotic (gentamicin). To the most important goal of our study was that to incorporate the plant extract which is rich in flavonoids compounds into the chitosan matrix which has antimicrobial property can efficiently eliminate the persistent microorganisms such as S. typhimurium, E. coli, B. thuringiensis, P. aeruginosa and P. vulgaris. The discovery of plant and biopolymer based nontoxic agents could promote antimicrobial activity with minimal drawbacks since enhanced toxicity due to the application of conventional toxic chemicals.3.12. QSI bioassay
In the current study, chitosan films blended with extracts of stem, leaf, and seed from P. terebinthus was assessed for the anti-QS activity against the reporter strain C. violaceum CV026. In the disc diffusion method, the tested chitosan films displayed significant values of anti-QS activity which was computed according to the loss of purple pigmentation. All synthesized films inhibited the production of violacein with zones ranged in 8.11 and 29.38 mm. According to radios of inhibition zones, chitosan blend films with stem, leaf and seed extracts of P. terebinthus displayed higher pigment clearance than chitosan control film. Furthermore, interestingly the pigment inhibition of chitosan blended films, especially with seed, showed greater activity than commercial antibiotic (gentamicin). The highest values of quorum-sensing activity were obtained from chitosan-seed film.On the other hand, quantitative determination of the violacein production inhibition was also evaluated. All the tested chitosan blend films exhibited a significant reduction in production of violacein with the ranged in 28.13 ± 2.4–89.34 ± 3.5% (Fig. 9). Similarly, with results of QS inhibition zone, chitosan-seed and chitosan-stem films exerted a higher pigment inhibition (89 ± 3.6 and 81 ± 3.5%, respectively) against C. violaceum CV026 than chitosan-leaf film (72 ± 3.3%).
4. Conclusion
For the first time, stem, leaf and seed extracts obtained from P. terebinthus containing high phenolic substances were transferred into chitosan films. As a result, high antioxidative and antimicrobial films (against nine food-borne pathogens) were successfully produced and well characterized with commonly used analytical techniques. Additionally, supplementing plant extracts into chitosan film enhanced the overall elasticity of chitosan-stem and chitosan-seed films. Current results showed that the produced blend films could be suggested as a suitable alternative to synthetic plastics for applications in food coating and packaging industry.Conflicts of interest
The authors declare no conflicts of interest.References
- J. G. Derraik, Mar. Pollut. Bull., 2002, 44, 842–852 CrossRef CAS PubMed.
- D. K. Barnes, F. Galgani, R. C. Thompson and M. Barlaz, Philos. Trans. R. Soc. London, Ser. B, 2009, 364, 1985–1998 CrossRef CAS PubMed.
- F. Debeaufort, J.-A. Quezada-Gallo and A. Voilley, Crit. Rev. Food Sci. Nutr., 1998, 38, 299–313 CrossRef CAS PubMed.
- J. M. Krochta, Protein-Based Films Coat., 2002, 1–41 CAS.
- R. A. Talja, H. Helén, Y. H. Roos and K. Jouppila, Carbohydr. Polym., 2008, 71, 269–276 CrossRef CAS.
- M. Mujtaba, A. M. Salaberria, M. A. Andres, M. Kaya, A. Gunyakti and J. Labidi, Int. J. Biol. Macromol., 2017, 104, 944–952 CrossRef CAS PubMed.
- M. Kaya, L. Akyuz, I. Sargin, M. Mujtaba, A. M. Salaberria, J. Labidi, Y. S. Cakmak, B. Koc, T. Baran and T. Ceter, J. Ind. Eng. Chem., 2017, 47, 236–245 CrossRef CAS.
- T. Bourtoom, Int. Food Res. J., 2008, 15, 237–248 Search PubMed.
- R. Avena-Bustillos and J. Krochta, J. Food Sci., 1993, 58, 904–907 CrossRef CAS.
- M. Z. Elsabee and E. S. Abdou, Mater. Sci. Eng., C, 2013, 33, 1819–1841 CrossRef CAS PubMed.
- M. N. R. Kumar, React. Funct. Polym., 2000, 46, 1–27 CrossRef CAS.
- J. V. Tezotto-Uliana, G. P. Fargoni, G. M. Geerdink and R. A. Kluge, Postharvest Biol. Technol., 2014, 91, 72–77 CrossRef CAS.
- A. Anitha, S. Sowmya, P. S. Kumar, S. Deepthi, K. Chennazhi, H. Ehrlich, M. Tsurkan and R. Jayakumar, Prog. Polym. Sci., 2014, 39, 1644–1667 CrossRef CAS.
- U. Siripatrawan and B. R. Harte, Food Hydrocolloids, 2010, 24, 770–775 CrossRef CAS.
- V. A. Pereira, I. N. Q. de Arruda and R. Stefani, Food Hydrocolloids, 2015, 43, 180–188 CrossRef CAS.
- H. El Gharras, Int. J. Food Sci. Technol., 2009, 44, 2512–2518 CrossRef CAS.
- D. D. Kavak, E. Altıok, O. Bayraktar and S. Ülkü, J. Mol. Catal. B: Enzym., 2010, 64, 167–171 CrossRef CAS.
- A. Ghasemzadeh and N. Ghasemzadeh, J. Med. Plants Res., 2011, 5, 6697–6703 CAS.
- J. Rios and M. Recio, J. Ethnopharmacol., 2005, 100, 80–84 CrossRef CAS PubMed.
- W. X. Du, C. Olsen, R. Avena-Bustillos, M. Friedman and T. McHugh, J. Food Sci., 2011, 76, M149–M155 CrossRef CAS PubMed.
- F. Caponio, V. Alloggio and T. Gomes, Food Chem., 1999, 64, 203–209 CrossRef CAS.
- J. Choo, Y. Rukayadi and J. K. Hwang, Lett. Appl. Microbiol., 2006, 42, 637–641 CAS.
- H. Schulz and M. Baranska, Vib. Spectrosc., 2007, 43, 13–25 CrossRef CAS.
- P. Mayachiew and S. Devahastin, Food Chem., 2010, 118, 594–601 CrossRef CAS.
- B. Dou, V. Dupont, P. T. Williams, H. Chen and Y. Ding, Bioresour. Technol., 2009, 100, 2613–2620 CrossRef CAS PubMed.
- J. Zawadzki and H. Kaczmarek, Carbohydr. Polym., 2010, 80, 394–400 CrossRef CAS.
- D. Altiok, E. Altiok and F. Tihminlioglu, J. Mater. Sci.: Mater. Med., 2010, 21, 2227–2236 CrossRef CAS PubMed.
- F. M. Pelissari, M. V. Grossmann, F. Yamashita and E. A. G. Pineda, J. Agric. Food Chem., 2009, 57, 7499–7504 CrossRef CAS PubMed.
- P. Kanmani and J.-W. Rhim, Int. J. Biol. Macromol., 2014, 68, 258–266 CrossRef CAS PubMed.
- Y. Peng, Y. Wu and Y. Li, Int. J. Biol. Macromol., 2013, 59, 282–289 CrossRef CAS PubMed.
- J. T. Martins, M. A. Cerqueira and A. A. Vicente, Food Hydrocolloids, 2012, 27, 220–227 CrossRef CAS.
- S. Shojaee-Aliabadi, H. Hosseini, M. A. Mohammadifar, A. Mohammadi, M. Ghasemlou, S. M. Ojagh, S. M. Hosseini and R. Khaksar, Int. J. Biol. Macromol., 2013, 52, 116–124 CrossRef CAS PubMed.
- M. Ghasemlou, N. Aliheidari, R. Fahmi, S. Shojaee-Aliabadi, B. Keshavarz, M. J. Cran and R. Khaksar, Carbohydr. Polym., 2013, 98, 1117–1126 CrossRef CAS PubMed.
- J. F. Rubilar, R. M. Cruz, H. D. Silva, A. A. Vicente, I. Khmelinskii and M. C. Vieira, J. Food Eng., 2013, 115, 466–474 CrossRef CAS.
- M. Kaya, P. Ravikumar, S. Ilk, M. Mujtaba, L. Akyuz, J. Labidi, A. M. Salaberria, Y. S. Cakmak and S. K. Erkul, Innovative Food Sci. Emerging Technol., 2017, 45, 287–297 CrossRef.
- L. Wang, Y. Dong, H. Men, J. Tong and J. Zhou, Food Hydrocolloids, 2013, 32, 35–41 CrossRef.
- J. Jin, M. Song and D. Hourston, Biomacromolecules, 2004, 5, 162–168 CrossRef CAS PubMed.
- C. Ramírez, I. Gallegos, M. Ihl and V. Bifani, J. Food Eng., 2012, 109, 424–429 CrossRef.
- U. Siripatrawan and W. Vitchayakitti, Food Hydrocolloids, 2016, 61, 695–702 CrossRef CAS.
- J. S. Smith and Y. H. Hui, Food processing: principles and applications, John Wiley & Sons, 2008 Search PubMed.
- M. Hosseini, S. Razavi and M. Mousavi, J. Food Process. Preserv., 2009, 33, 727–743 CrossRef CAS.
- M. Moradi, H. Tajik, S. M. R. Rohani, A. R. Oromiehie, H. Malekinejad, J. Aliakbarlu and M. Hadian, LWT--Food Sci. Technol., 2012, 46, 477–484 CrossRef CAS.
- S.-I. Park and Y. Zhao, J. Agric. Food Chem., 2004, 52, 1933–1939 CrossRef CAS PubMed.
- J.-M. Pagès and L. Amaral, Biochim. Biophys. Acta, Proteins Proteomics, 2009, 1794, 826–833 CrossRef PubMed.
- L. J. Piddock, Clin. Microbiol. Rev., 2006, 19, 382–402 CrossRef CAS PubMed.
- S. Kawashty, S. Mosharrafa, M. El-Gibali and N. Saleh, Biochem. Syst. Ecol., 2000, 28, 915–917 CrossRef CAS PubMed.
- X. Zhao, H. Sun, A. Hou, Q. Zhao, T. Wei and W. Xin, Biochim. Biophys. Acta, Gen. Subj., 2005, 1725, 103–110 CrossRef CAS PubMed.
| This journal is © The Royal Society of Chemistry 2018 |

