 Open Access Article
Porous TiO2 with large surface area is an efficient catalyst carrier for the recovery of wastewater containing an ultrahigh concentration of dye
Yumeng Zhou,
Lijing Zhang and
Shengyang Tao *
*
Department of Chemistry, Dalian University of Technology, Dalian, Liaoning 116024, P. R. China. E-mail: taosy@dlut.edu.cn
First published on 16th January 2018
Abstract
The preparation of porous TiO2 as a carrier for the Fenton reaction is reported. Porous TiO2 is an excellent carrier to load with elemental iron due to the large specific surface area and negative surface charge. Porous TiO2 was synthesized in the form of a hierarchically porous silica monolith that was used as a microreactor, and a block copolymer served as a template for mesoporous forms. The crystalline TiO2 growing in confined spaces maintained the porous structure and high crystallinity. The surface area of our synthesized porous TiO2 can reach 205 m2 g−1. The zeta potential of the TiO2 was as low as −36.5 mV (pH 7). Elemental iron was highly and uniformly dispersed over the channel of the porous TiO2 via an impregnation method and served as the catalyst for the Fenton reaction. In the Fenton reaction, the synthesized catalyst performed strong catalytic activity during the degradation of wastewater containing an ultrahigh concentration of aqueous dye, at 400 ppm. The aqueous dye solution was degraded over 95% in 30 min, and the catalyst could be reused many times.
Introduction
Water is one of the most critical resources of human production and life. Due to the development of modern industry, water is commonly contaminated with a wide variety of toxic chemicals and organic pollutants that do not easily biodegrade. Wastewater treatment and protection of water resources have been under the spotlight in modern society. Numerous technologies have been reported that can be used in solving serious water pollution problems, including adsorption,1,2 chemical coagulation,3,4 biodegradation,5,6 photodegradation,7,8 and the Fenton reaction.9,10 Among these technologies, the Fenton reaction is a facile and green method to remove organic pollutants. The Fenton reaction as an advanced oxidation technology has many advantages, such as strong oxidation abilities and high efficiencies.In a traditional Fenton reaction, the homogenous iron catalyst could cause the iron ions to remain in the reaction system, which may further pollute the environment. Additionally, the traditional catalyst is limited to use in a short range of pH values around 3. To overcome these shortcomings, heterogeneous catalysts have been developed in recent years. A variety of materials such as Nafion11 sepiolite,12 resins,13 rectorites,14 and silica15 have served as carriers to load iron oxide, and these catalysts were able to be recycled. An excellent carrier should have good pore structure and chemical stability under oxidation.
Metal oxides with crystalline structures have recently attracted a great deal of attention because they have unique and tunable energy band structures16 and changeable states of surface defects.17,18 When metal oxides are used as the carrier in Fenton reactions, their specific surface areas, pore sizes, and surface chemical properties as well as their crystalline style are the key parameters.19 Large surface areas can provide sufficient reaction-active sites to load additional elemental iron, and pore channels are beneficial for mass diffusion, and can accelerate the reaction rates. The high crystallinity can improve the chemical stability of the carrier under the strong oxidation environment. However, the crystallization of metal oxides is usually accompanied by the rearrangement and migration of atoms, which causes a breakdown of the porous structure and a decrease in the specific surface area.20 Therefore, it is an important and challenging task to synthesize metal oxides that have both large surface areas and controllable crystalline structures.
A new and efficient strategy has been developed in recent years by which inorganic crystalline materials are synthesized in confined spaces to serve as microreactors.21–26 Qi and his colleague27 synthesized porous calcium carbonate single crystals via the templates of photonic crystals. A TiO2 crystal with a large surface area that could perform high photocatalysis was reported by Yin et al.28 This material was obtained through calcination in a confined space between two silica layers.
In our experiments, we prepared porous TiO2 with high crystallinity, high-temperature stability, large specific surface area, and strong negative surface charge using a hierarchically porous silica monolith that served as a confined space microreactor. This material was composed of aggregated TiO2 nanoparticles. The specific surface area of the material can reach as high as 205 m2 g−1. The zeta potential of the TiO2 was −36.5 mV (pH 7). The negative surface charge and large specific surface area contributed to the high dispersion of metal ions. Thus, iron oxide was uniformly dispersed in the porous TiO2. The obtained composite catalyst displayed highly efficient activity in the photo-Fenton reaction. Wastewater containing 400 ppm organic dyes was purified, and irradiation with visible light resulted in quick degradation of the dye in 30 min.
Experimental section
Materials
Tetramethoxysilane (TMOS) was obtained from the Chemical Factory of Wuhan University, and polyethylene glycol (PEG, M = 10![[thin space (1/6-em)]](https://www.rsc.org/images/entities/char_2009.gif) 000) and polyethylene oxide (PEO)–PEG–PEO (F127) were purchased from Sigma-Aldrich Company. Tetrabutyl titanate, absolute ethyl alcohol (analytical reagent (AR)), acetic acid (AR), nitric acid (AR), ammonia solution (25%), concentrated hydrochloric acid (36–38%, AR), and sodium hydroxide were obtained from Beijing Chemical Corporation. P25, rhodamine B (RhB), methylene blue (MB), orange II, iron nitrate nonahydrate, hydroxylammonium chloride, and commercial Fe2O3 were used as received from the Shanghai Aladdin Biochem Technology Corporation.
000) and polyethylene oxide (PEO)–PEG–PEO (F127) were purchased from Sigma-Aldrich Company. Tetrabutyl titanate, absolute ethyl alcohol (analytical reagent (AR)), acetic acid (AR), nitric acid (AR), ammonia solution (25%), concentrated hydrochloric acid (36–38%, AR), and sodium hydroxide were obtained from Beijing Chemical Corporation. P25, rhodamine B (RhB), methylene blue (MB), orange II, iron nitrate nonahydrate, hydroxylammonium chloride, and commercial Fe2O3 were used as received from the Shanghai Aladdin Biochem Technology Corporation.
Synthesis of the hierarchically porous silica template
Hierarchically porous silica (HPS) was synthesized by a method modified from a previous report.29 First, PEG (8.85 g) was dissolved in acetic acid (0.01 M, 75 ml), and then, the solution was stirred at room temperature until it became homogeneous. Subsequently, TMOS (30 ml) was added and stirred for approximately 10 min for hydrolysis at 0 °C. The obtained sol was aged at 40 °C for 36 h, and then treated with ammonia solution (1 M) at 110 °C for 9 h to obtain the monoliths. Next, the monoliths were soaked in nitric acid (0.01 M) for 12 h to neutralize the ammonium hydroxide on their surfaces. The monoliths were then dried at 60 °C. Finally, HPS was obtained after being calcined at 650 °C for 5 h.Synthesis of porous TiO2
First, F127 (20 g), tetrabutyl titanate (46.4 ml), and concentrated hydrochloric acid (21.2 ml) were dissolved in anhydrous ethanol (38.8 ml). The TiO2-sol was obtained by vigorously stirring the solution at room temperature for 2 h. Then, the as-made HPS was immersed in the TiO2-sol for 24 h. Next, the monoliths were washed with ethanol three times, and then dried in a drying oven at 60 °C. Subsequently, the dried solid was immersed in the TiO2-sol for another 24 h. After washing and drying, the monoliths were calcined at various temperatures (350 °C, 450 °C, 550 °C, 650 °C, and 800 °C) for 5 h. The HPS template was completely removed by treating with 2 M NaOH at 90 °C for 2 h, twice. The filtrate was thoroughly rinsed with water until the pH was neutral, and then, it was dried at 100 °C to obtain the final product, porous TiO2 (DTT). For comparison, we synthesized TiO2 with F127 as a soft template (noted as STT) and without template (NTT). The STT was obtained by drying the TiO2-sol and calcining it at 450 °C. The NTT was obtained by drying the solution consisting of ethanol, tetrabutyl titanate, and concentrated hydrochloric acid, and then calcining at temperatures of 450 °C, 600 °C, and 800 °C.Synthesis of Fe2O3@DTT and Fe2O3@HPS
The Fe2O3@DTT was synthesized by impregnation. First, 0.1 g DTT (calcined at 450 °C) was impregnated in 5 ml saturated iron nitrate solution. After 5 h, it was washed with deionized water in a Buchner funnel and dried at 80 °C. The Fe2O3@DTT catalyst was obtained after calcination at 150 °C. The synthesis of Fe2O3@HPS was similar to that of Fe2O3@DTT. Similarly, 0.1 g HPS was immersed in 5 ml saturated iron nitrate solution for 5 h. Then, it was thoroughly rinsed with water and subsequently dried at 80 °C. After calcining at 150 °C, Fe2O3@HPS was obtained.Photo-Fenton reaction of composite catalysts
Typically, 15 mg catalyst, 30 ml dye solution (at a certain concentration), 40 μl H2O2 (30 wt%), and 12.5 mg hydroxylammonium chloride were added to a quartz colorimetric tube at room temperature. The dye solution was used in the Fenton-reaction without adjusting pH. These reactants and catalysts were stirred in the dark for 3 h. Subsequently, the tube was exposed to the light from a xenon lamp (200–800 nm, 500 W), and the suspension continued reacting under visible light. A cutoff filter was placed so that it completely removed any radiation with wavelengths λ < 420 nm to ensure illumination by visible light only. The concentration of dyes was measured with a UV/Vis spectrophotometer after removing the catalyst.The degradation efficiency (η%) of dye was calculated by the following formula:
| η% = (C0 − C)/C0 | (1) |
Characterization
Transmission electron microscope (TEM) images were obtained with a Tecnai G220S-Twin electron microscope, equipped with a cold-field emission gun (200 kV). The X-ray diffraction (XRD) patterns were recorded with a Rigaku D/MAX-2400 X-ray powder diffractometer equipped with CuKα radiation (40 kV, 40 mA). The nitrogen adsorption and desorption isotherms were measured at 77 K using an ASAP 2010 analyzer (Micromeritics Co. Ltd.). The specific surface areas (SBET) were calculated by the Brunauer–Emmett–Teller (BET) method, and the pore size was calculated using the Barrett–Joyner–Halenda (BJH) model. The zeta potential was measured with a Zetasizer Nano ZS90 Zeta Potential Analyzer (Malvern Instruments Ltd.). The UV-Vis diffuse reflectance spectroscopy (UV-Vis DRS) spectra were obtained with a Cary 5000 UV-Vis-NIR spectrophotometer (Agilent Technologies Co. Ltd.). The spectra were recorded at room temperature in the range of 200–800 nm. The band gap was estimated by the following formula:30| αhν = A(hν − Eg)1/2 | (2) |
All the concentrations of dyes were analyzed with a UV/Vis spectrophotometer. The maximum absorption wavelength of rhodamine B (RhB) was 554 nm, that of methylene blue (MB) was 664 nm, and that of methyl orange (MO) was 463 nm. Total organic carbon (TOC) analysis was carried out with a Shimadzu TOC-VCPH analyser (Shimadzu Co. Ltd.). The pH of the samples was adjusted to less than 2 in order to eliminate the influence of the inorganic carbon. To explore the adsorption capacity of the prepared TiO2, tests were conducted using RhB, MB, and MO. The adsorption properties and equilibrium data were exhibited in the adsorption isotherms. The Langmuir adsorption isotherm is expressed as follows:
| Ce/Q = 1/Q × b + Ce/Q | (3) |
| Qe = (C0 − Ce) × V/M | (4) |
Results and discussion
Characterization of DTT
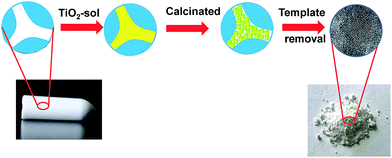
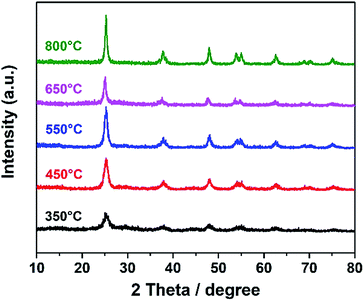
A dual-template strategy was used in the process of synthesizing TiO2 (Scheme 1). The hierarchically porous silica monolith served as a hard template and a microreactor to provide a confined space, while polymer F127 served as a soft template for mesoporous forms, which was mixed with the titanium oxide sol to form mesoporous DTT after calcination. The powder XRD patterns for mesoporous DTT calcined at different temperatures are shown in Fig. 1.According to the XRD spectra, all the TiO2 samples were in the anatase phase (JCPDS 21-1272). The intensity of the diffraction peak grew stronger, and the full width at half maximum (FWHM) was reduced with the increase in temperature. When the temperature was higher than 450 °C, no obvious change was observed in the XRD spectra. These results indicated that the anatase structure of TiO2 can be maintained, even with a calcination temperature up to 850 °C. Usually, TiO2 changes to the rutile phase at such a high temperature.31 The maintenance of the anatase phase suggested that the phase transformation was limited in the porous confined space during calcination. This limitation probably resulted from atomic rearrangement, leading to the volume change in the material, as the process was greatly limited in a confined space. Such confinement resulted in difficulty in occurrence of the phase transformation.
The grain sizes were obtained through the Scherrer equation:32
D = Kγ/β![[thin space (1/6-em)]](https://www.rsc.org/images/entities/char_2009.gif) cos cos![[thin space (1/6-em)]](https://www.rsc.org/images/entities/char_2009.gif) θ. θ.
| (5) |
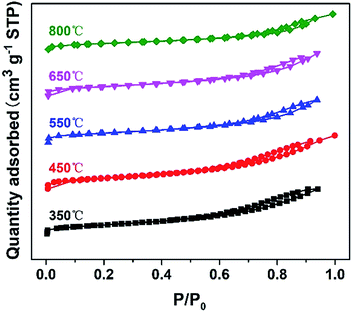
The nitrogen sorption isotherms of DTT are shown in Fig. 2. The N2 adsorption–desorption isotherm of the crystalline material belongs to the type-IV shape, according to the IUPAC classification. This shape suggested the existence of a mesoporous structure. The specific surface areas of the DTT increased at first, and then reduced. DTT calcined at 450 °C had a specific surface area that was the largest, at 205.26 m2 g−1. At low temperature, the amorphous TiO2 formed small grains, and the F127 decomposed so that small pores were formed. At high temperatures, the grain size increased as the specific surface areas relevantly decreased. Furthermore, specific surface areas of the material calcined at 800 °C remained at 109.71 m2 g−1, which was greater than the surface areas of many reported high-crystalline titanium materials. This result was probably caused by the small grain size of the DTT. All the related parameters of DTT are summarized in Table 1.
| Sample | SBET (m2 g−1) | Dp (nm) | Vp (cm3 g−1) | Grain size (nm) |
|---|---|---|---|---|
| 350 °C – DTT | 186.35 | 7.03 | 0.33 | 6.8 |
| 450 °C – DTT | 205.26 | 9.19 | 0.47 | 8.7 |
| 550 °C – DTT | 157.19 | 7.37 | 0.29 | 9.6 |
| 650 °C – DTT | 139.36 | 9.08 | 0.32 | 14.1 |
| 850 °C – DTT | 109.71 | 7.87 | 0.20 | 17.2 |
The TEM pattern confirmed that the DTT had a high degree of crystallization and a porous structure. As shown in Fig. 3A, small TiO2 grains aggregated to form a mesoporous structure. The diameters of the mesoporous DTT were less than 10 nm. According to Fig. 3B, the grain size of the TiO2 approached 9 nm, which was consistent with the results calculated by the Scherrer equation. Fig. 3B and C show a well crystallized structure, which indicates that 450 °C was sufficient for obtaining porous TiO2 with ideal crystallinity. The interplanar spacing of the (101) crystal planes was 0.45 nm, which corresponded to the anatase titania.
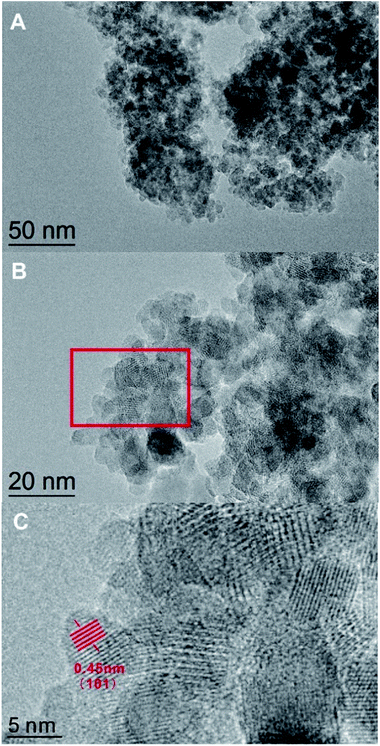 | ||
| Fig. 3 The TEM images of the DTT calcined at 450 °C. Section C is an enlargement of the red rectangle in section B. | ||
Comparison of different templates
Control experiments were performed to explore the effects of the templates. The TiO2 showed different pore structures and crystallization processes. As shown in Table 2, the specific surface areas greatly decreased with the absence of a soft template. When calcined at 450 °C, the obtained NTT (which was prepared without soft or hard templates) had a specific surface area of only 57.87 m2 g−1. When only F127 was present (STT), the specific surface area of the STT was 104.97 m2 g−1. The surface areas of both NTT and STT were smaller than those of materials that were synthesized in the dual-template condition.| Sample | SBET (m2 g−1) | Dp (nm) | Vp (cm3 g−1) | Grain size (nm) | Phase |
|---|---|---|---|---|---|
| 450 °C – DTT | 205.26 | 9.19 | 0.47 | 8.7 | Anatase |
| 450 °C – STT | 104.97 | 17.21 | 0.45 | 15.1 | Anatase |
| 450 °C – NTT | 57.87 | 9.49 | 0.14 | 20.7 | Anatase |
| 600 °C – NTT | 12.43 | 14.90 | 0.05 | 26.6 | Anatase |
| 800 °C – NTT | 3.95 | 12.95 | 0.01 | 64.2 | Rutile |
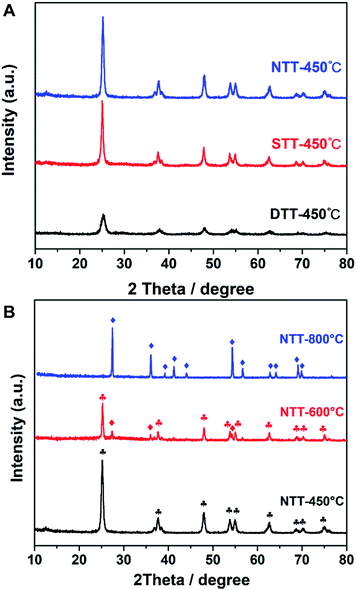
These results indicated that a hard confined space existed, which was provided by the porous silica template, and this was the necessary factor for producing large surface areas. This result appeared in the XRD pattern (Fig. 4). Both STT and NTT cannot efficiently prevent the grain growth of TiO2 (see Fig. 4A). Calculated according to the Scherrer equation, the grain sizes of the above-mentioned materials were 20.7 nm for the NTT and 17.2 nm for the STT. These grain sizes were both larger than those of the DTT.
For the NTT that was synthesized in free space, the crystal polymorphic transformation occurred when calcined at temperatures of 600 °C or 800 °C. The phase style transferred from anatase to rutile (JCPDS 21-1276), either partially or completely (see Fig. 4B). These evolutions indicated that the thermostability of TiO2 decreased when calcined in free space. The confined space of porous silica was therefore beneficial for preventing the phase transformation of TiO2 at high temperature.
Dye adsorption properties of DTT
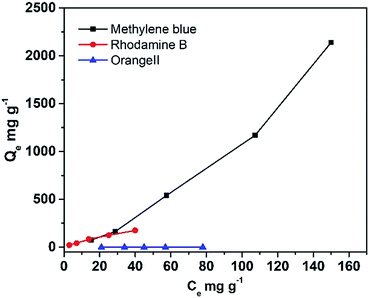
As the DTT showed great specific surface area, its capacity to adsorb different organic contaminants was explored. Fig. 5 displays the equilibrium adsorption isotherms for rhodamine B and methylene blue onto DTT at room temperature. As shown in Table 3, the capacity of porous DTT to adsorb basic or acidic dyes was significantly different. The maximum adsorption was calculated according to the Langmuir adsorption isotherm. For basic dyes (methylene blue (MB) and rhodamine B (RhB)) that form cations in aqueous solution, the adsorption capacities were 1250 mg g−1 and 250 mg g−1, respectively. These capacities indicated that the pollutant was easily adsorbed on the surface of the DTT and enriched in its channels. Acidic dyes such as orange II were not adsorbed.| Langmuir isotherm | |||
|---|---|---|---|
| Q/mg g−1 | b/L mg−1 | R | |
| Methylene blue | 1250 | 0.0045 | 0.998 |
| Rhodamine B | 250 | 0.029 | 0.992 |
| Orange II | 0 | — | — |
These differences in adsorption capacity resulted from the surface potential of TiO2 in water. The zeta potential of DTT in pure aqueous solution is −36 mV. The pH of the solution was 7. The weight percent of silicon for DTT was 0.82%, which was measured by energy dispersive X-ray spectroscopy (EDX). It was implied that little SiO2 remained in the DTT. However, this negative surface charge may be caused by the NaOH etching that occurred during the process of removing SiO2 templates rather than the remaining silica.
Examination of the characteristics of iron load
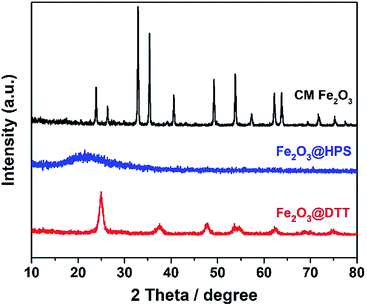
The negative zeta potential of DTT is beneficial to the adsorption of metal cations, such as iron ions. Elemental iron is one of the most important catalysts in wastewater treatment, and it plays a very important role in various Fenton reactions. The dispersibility of iron oxides directly affects its catalytic activity. The large surface area and negative surface charge (−36.5 mV) of DTT should be favorable for Fe3+ ions to disperse on the surface. Here, the composite catalyst of Fe2O3@DTT was prepared. For comparison, Fe2O3@HPS was also prepared, since we have previously reported that HPS is a good catalytic carrier for Fe2O3. Fig. 6 shows the XRD patterns for these three samples, and no peak of any type of iron oxides was found in the XRD patterns of Fe2O3@DTT and Fe2O3@HPS. SiO2 and anatase TiO2 only showed their own characteristic diffraction peaks. The XRD spectrum indicated that there was no large crystalline iron oxide in DTT and HPS. The commercial iron oxide (CM Fe2O3) had a crystal form of hematite Fe2O3 (JCPDS 33-0664), and was high crystalline with large grains. The grain size can reach 33.2 nm according to the Scherrer equation.TEM and energy-dispersive X-ray spectroscopy (EDS) elemental mapping show the distribution of elemental iron in different composite catalysts. As shown in Fig. 7, elemental iron was highly dispersed in both porous DTT and HPS. However, in Fe2O3@DTT, there was a larger amount of iron oxide with a more uniform dispersion. The elemental content could be measured by EDS. The Fe content in DTT and HPS was 2.60%, and 1.17%, respectively. The different results were perhaps caused by the various negative surface charges of the two carriers (the large specific surface area of HPS is 380 m2 g−1). This speculation was further proved by the zeta potential results. The zeta potentials of DTT and HPS in pure aqueous solution were −36.5 mV and −16 mV, respectively. The more negative charge of DTT may lead to larger adsorption of Fe3+ and better dispersion of iron oxides after being calcined.
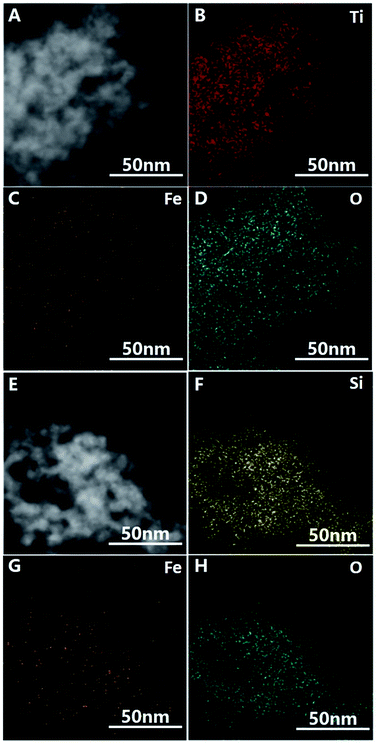 | ||
| Fig. 7 TEM images of (A) Fe2O3@DTT and (E) Fe2O3@HPS. EDS elemental mapping images of (B–D) Fe2O3@DTT, and (F–H) Fe2O3@HPS. | ||
The UV-Vis DRS spectra for DTT and Fe2O3@DTT are shown in Fig. 8. The sharp basal adsorption edge for DTT was approximately 390 nm, whereas the main absorption edge of Fe2O3@DTT did not significantly change but noticeably absorbed light at 400–600 nm. After calculations, the band gap energy of DTT was 3.3 eV, while that of Fe2O3@DTT was 3.16 eV. The Fe2O3@DTT absorption intensity towards long wavenumber light was enhanced, which perhaps benefited the photo reaction.
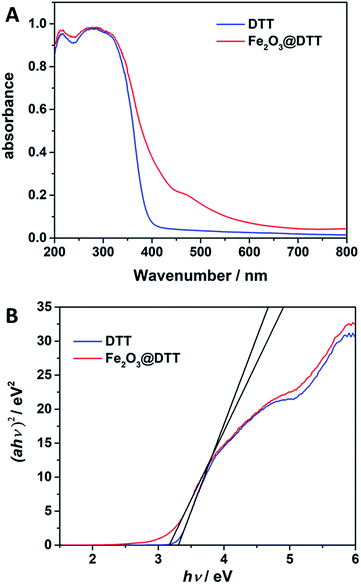 | ||
| Fig. 8 (A) The UV-Vis DRS spectra for DTT and Fe2O3@DTT. (B) Plots of (αhν)2 vs. photo energy (hν) of DTT and Fe2O3@DTT. | ||
Examination of the catalytic performance of the Fenton reaction
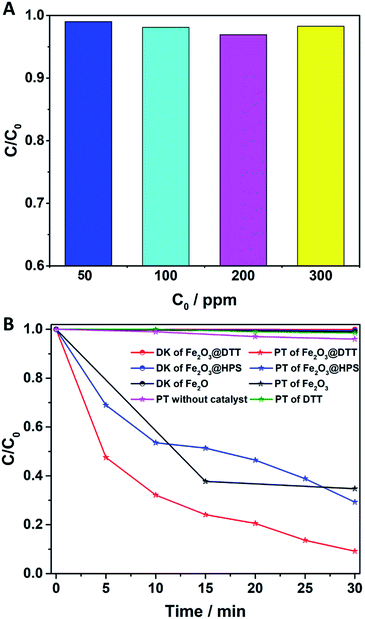
The catalytic activity of Fe2O3@DTT in the photo-Fenton reaction was subsequently explored. As shown in Fig. 9A, the degradation rate of the 50 ppm orange II solution reached 99% under visible light irradiation. At the same time, the 100 ppm, 200 ppm, and 300 ppm orange II solutions were degraded over 98%.The photocatalytic treatment of solutions containing high dye concentrates and high chemical oxygen demand (COD) content has recently attracted attention.50–54 We explored the photocatalytic performance to degrade 400 ppm dye solution. As shown in Fig. 9B, orange II dye was slightly degraded under visible light without catalyst, and at the same time, only 2% of dyes were degraded under the catalyst of DTT. Surprisingly, 95% of orange II was also degraded in 30 min, even when the concentration of the solution was as high as 400 ppm. In comparison, when Fe2O3@HPS and commodity Fe2O3 were used as catalysts, only 70% and 60% dyes were degraded, respectively, under the same reaction conditions. The results of the dark reaction showed that less than 1% dye was adsorbed. Orange II was slightly adsorbed by these catalysts, indicating that the decrease of dye concentration was the result of degradation rather than adsorption. The above results implied that Fe2O3@DTT had strong catalytic activity for effectively purifying ultra-high concentrated wastewater, whereas the DTT had no catalytic efficiency in the degradation reaction. The difference in degradation efficiency resulted from the dispersibility and load amount of iron oxides. The iron oxide in Fe2O3@HPS and Fe2O3@DTT was both homogeneous and small, but the Fe2O3@DTT loaded more iron oxide. Due to the large crystals, the commercial Fe2O3 had the highest iron content of the three catalysts, but showed the lowest catalytic activity in the photo-Fenton reaction. More importantly, the initial dye concentration was as high as 400 ppm, which is much higher than many other reported values (Table 4). In comparison with the traditional photocatalysts (Table 4, ref. 33–37), the Fe2O3@DTT displayed excellent catalytic activities, which were perhaps due to the presence of the H2O2 in the Fenton reaction. The Fe2O3@DTT also showed a stronger ability to purify the wastewater in contrast with other reported Fenton catalysts (Table 4, ref. 38–49). This encouraging result can be explained by the high dispersion of iron oxide.
| Catalyst | UV/Vis | Catalyst load (g L−1) | Initial concentration of dye (ppm) | Degradation time (min) | Removal rate (%) | Reference |
|---|---|---|---|---|---|---|
| Fe2O3@DTT | Vis | 0.5 | 50 | 5 | 99 | This work |
| Fe2O3@DTT | Vis | 0.5 | 400 | 30 | 95 | This work |
| Pt(P.D.)/MnOx(P.D.)/BiVO4 | Vis | 0.5 | 10 | 90 | 99 | 33 |
| g-C3N4/TiO2-3 | Vis | 1 | 10 | 300 | 84 | 34 |
| ZnO/rGO | Vis | 1.2 | 10 | 210 | 99 | 35 |
| SnS2/g-C3N4 | Vis | 0.1 | 10 | 20 | 99.8 | 36 |
| B-doped g-C3N4 | Vis | 2 | 4 | 40 | 100 | 37 |
| HSg–C3N4–O | Vis | 0.6 | 9.6 | 50 | 100 | 38 |
| CuFe2O4@C3N4 | Vis | 0.1 | 10 | 210 | 98 | 39 |
| MIL-53(Fe) | Vis | 0.4 | 10 | 50 | 98 | 40 |
| Fe2O3–Kaolin | Vis | 1 | 15 | 120 | 98 | 41 |
| Fe–TiO2 | UV | — | 30 | 120 | 100 | 42 |
| g-C3N4/NH2-MIL-88B(Fe) | Vis | 1 | 30 | 120 | 100 | 43 |
| α-Fe2O3/S | Vis | 0.1 | 35 | 14 | 95 | 44 |
| Fe2O3@SiO2 | UV | 0.5 | 35 | 300 | 98 | 45 |
| α-Fe2O3@GO | UV | 0.25 | 40 | 80 | 94.7 | 46 |
| Al-pillared Fe-Sme | UV | 0.5 | 80 | 150 | 99 | 47 |
| ZnFe2O4 | Vis | 0.5 | 100 | 60 | 94.9 | 48 |
| GO–Fe2O3 | Vis | 1 | 100 | 80 | 99 | 49 |
To further investigate the degradation efficiency of the catalysts, the total organic carbon was measured. The results are shown in Fig. 10A. The mineralization rate of 100 ppm orange II reached 85% in 30 min, which confirmed that the Fe2O3@DTT has excellent catalytic activity in the Fenton reaction.
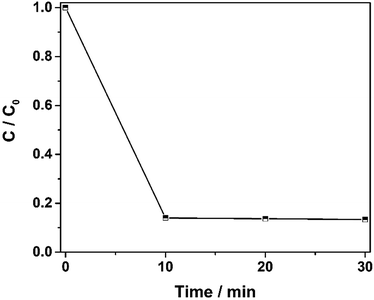 | ||
| Fig. 10 The degradation curve of TOC under the catalyst of Fe2O3@DTT (15 mg catalyst, 12 mM H2O2, 6 mM NH2OH–HCl, and 100 ppm orange II). | ||
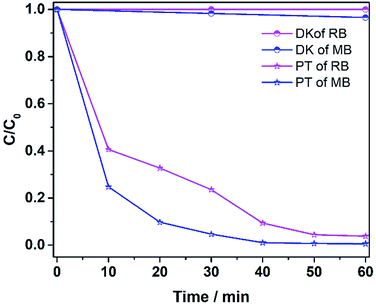
The ability to degrade other pollutants (MB and RhB) was also explored, and the results are shown in Fig. 11. Methylene blue at 400 ppm was degraded 95% in 30 min, while RhB at 400 ppm was degraded more than 95% in 50 min. The results verify that the catalyst was effective in degrading various dye pollutants.
Recycling tests were carried out to investigate the reusability of the catalysts. As shown in Fig. 12, the degradation rate was still above 99% after five cycles. The degradation time slightly increased, perhaps because of the catalyst loss during the recycling process.
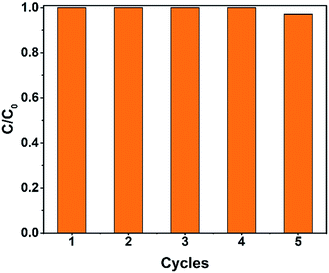 | ||
| Fig. 12 The recycling test of the Fe2O3@DTT to degrade orange II (15 mg catalyst, 30 ml orange II, 12 mM H2O2, 6 mM NH2OH–HCl, irradiation times 1 h and at room temperature). | ||
Conclusions
In summary, we have presented a new Fe carrier of porous TiO2 that possesses a large specific surface area, high crystallinity, and strong negative charge. The carrier was fabricated by DTT, and the key to obtaining the ideal structure was to control the crystallization in a confined space of the hierarchically porous silica with the assistance of a polymer pore-forming agent. The confined space prevented breakage of the crystal structure and atomic rearrangement, which would lead to grain growth and phase transfer. The obtained TiO2 had a negative surface charge and showed satisfactory adsorption of acidic dyes and metal cations. Because of the great adsorption capacity, the elemental iron can be uniformly dispersed in the DTT. The uniform dispersion enabled excellent catalytic efficiency in the Fenton reaction so that the prepared iron oxide loaded on the pore channels of the crystal could thoroughly degrade various dyes in water under visible light irradiation. The ultrahigh dye concentration (400 ppm) in water waste was successfully degraded by the Fe2O3@DTT. In addition, the catalyst was stable and still removed 99% of the pollution after five cycles. The remarkable advantages of synthesizing metal oxide materials with specific surface and structural properties in confined spaces can be applied to the construction of other functional porous materials such as high-performance catalysts, sensors, and adsorbents.Conflicts of interest
There are no conflicts to declare.Acknowledgements
This work was supported by the National Natural Science Foundation of China (21473019 and 51703017), a Financial Grant from the China Postdoctoral Science Foundation (No. 2016M601302), and the Fundamental Research Funds for the Central Universities (DUT17LK36, DUT17LAB18, DUT16RC(3)069).Notes and references
- H. Wang, C. Wang, S. Tao, J. Qiu, Y. Yu and M. Gu, ACS Sustainable Chem. Eng., 2016, 4, 992–998 CrossRef CAS.
- Q. Yuan, N. Li, Y. Chi, W. Geng, W. Yan, Y. Zhao, X. Li and B. Dong, J. Hazard. Mater., 2013, 254, 157–165 CrossRef PubMed.
- P. Cañizares, F. Martínez, C. Jiménez, J. Lobato and M. A. Rodrigo, Environ. Sci. Technol., 2006, 40, 6418–6424 CrossRef.
- T.-H. Kim, C. Park, J. Yang and S. Kim, J. Hazard. Mater., 2004, 112, 95–103 CrossRef CAS PubMed.
- N. M. Mahmoodi, M. Arami, H. Bahrami and S. Khorramfar, J. Appl. Polym. Sci., 2011, 120, 2996–3003 CrossRef CAS.
- M. Kornaros and G. Lyberatos, J. Hazard. Mater., 2006, 136, 95–102 CrossRef CAS PubMed.
- S. Li, K. Xu, S. Hu, W. Jiang, J. Zhang, J. Liu and L. Zhang, Appl. Surf. Sci., 2017, 397, 95–103 CrossRef CAS.
- M. Pirhashemi and A. Habibi-Yangjeh, J. Colloid Interface Sci., 2017, 491, 216–229 CrossRef CAS PubMed.
- Z. Miao, S. Tao, Y. Wang, Y. Yu, C. Meng and Y. An, Microporous Mesoporous Mater., 2013, 176, 178–185 CrossRef CAS.
- K. Turhan, I. Durukan, S. A. Ozturkcan and Z. Turgut, Dyes Pigm., 2012, 92, 897–901 CrossRef CAS.
- S. Sabhi and J. Kiwi, Water Res., 2001, 35, 1994–2002 CrossRef CAS PubMed.
- A. Rodriguez, G. Ovejero, J. L. Sotelo, M. Mestanza and J. Garcia, Ind. Eng. Chem. Res., 2010, 49, 498–505 CrossRef CAS.
- H. Ji, W. Song, C. Chen, H. Yuan, W. Ma and J. Zhao, Environ. Sci. Technol., 2007, 41, 5103–5107 CrossRef CAS PubMed.
- G. Zhang, Y. Gao, Y. Zhang and Y. Guo, Environ. Sci. Technol., 2010, 44, 6384–6389 CrossRef CAS PubMed.
- H. Lim, J. Lee, S. Jin, J. Kim, J. Yoon and T. Hyeon, Chem. Commun., 2006, 463–465 RSC.
- M. M. Khan, S. A. Ansari, D. Pradhan, M. O. Ansari, D. H. Han, J. Lee and M. H. Cho, J. Mater. Chem. A, 2014, 2, 637–644 CAS.
- M. A. Sk, S. M. Kozlov, K. H. Lim, A. Migani and K. M. Neyman, J. Mater. Chem. A, 2014, 2, 18329–18338 CAS.
- D. R. Mullins, Surf. Sci. Rep., 2015, 70, 42–85 CrossRef CAS.
- C. M. A. Parlett, K. Wilson and A. F. Lee, Chem. Soc. Rev., 2013, 42, 3876–3893 RSC.
- S. G. Rudisill, Z. Wang and A. Stein, Langmuir, 2012, 28, 7310–7324 CrossRef CAS PubMed.
- M. K. Hossain, A. R. Koirala, U. S. Akhtar, M. K. Song and K. B. Yoon, Chem. Mater., 2015, 27, 6550–6557 CrossRef CAS.
- J. Zhou, J. Qin, X. Zhang, C. Shi, E. Liu, J. Li, N. Zhao and C. He, ACS Nano, 2015, 9, 3837–3848 CrossRef CAS PubMed.
- W. Fu, L. Zhang, T. Tang, Q. Ke, S. Wang, J. Hu, G. Fang, J. Li and F.-S. Xiao, J. Am. Chem. Soc., 2011, 133, 15346–15349 CrossRef CAS PubMed.
- L. Han, K. Miyasaka, O. Terasaki and S. Che, J. Am. Chem. Soc., 2011, 133, 11524–11533 CrossRef CAS PubMed.
- F. Dufour, S. Pigeot-Remy, O. Durupthy, S. Cassaignon, V. Ruaux, S. Torelli, L. Mariey, F. Mauge and C. Chaneac, Appl. Catal., B, 2015, 174, 350–360 CrossRef.
- M. Wang, Z. Sun, Q. Yue, J. Yang, X. Wang, Y. Deng, C. Yu and D. Zhao, J. Am. Chem. Soc., 2014, 136, 1884–1892 CrossRef CAS PubMed.
- C. Li and L. Qi, Angew. Chem., Int. Ed., 2008, 47, 2388–2393 CrossRef CAS PubMed.
- J. B. Joo, Q. Zhang, I. Lee, M. Dahl, F. Zaera and Y. Yin, Adv. Funct. Mater., 2012, 22, 166–174 CrossRef CAS.
- Y. C. Wang, L. Y. Zhang, S. Y. Tao, Y. L. An, C. G. Meng and T. Hu, Microporous Mesoporous Mater., 2014, 193, 69–76 CrossRef CAS.
- J. Li, Y. Liu, H. Li and C. Chen, J. Photochem. Photobiol., A, 2016, 317, 151–160 CrossRef CAS.
- S. C. Zhu, S. H. Xie and Z. P. Liu, J. Am. Chem. Soc., 2015, 137, 11532–11539 CrossRef CAS PubMed.
- J. Zhong, F. Chen and J. Zhang, J. Phys. Chem. C, 2010, 114, 933–939 CAS.
- R. G. Li, H. X. Han, F. X. Zhang, D. G. Wang and C. Li, Energy Environ. Sci., 2014, 7, 1369–1376 CAS.
- Z. Tong, D. Yang, T. Xiao, Y. Tian and Z. Jiang, Chem. Eng. J., 2015, 260, 117–125 CrossRef CAS.
- H. Moussa, E. Girot, K. Mozet, H. Alem, G. Medjahdi and R. Schneider, Appl. Catal., B, 2016, 185, 11–21 CrossRef CAS.
- Z. Zhang, J. Huang, M. Zhang, Q. Yuan and B. Dong, Appl. Catal., B, 2015, 163, 298–305 CrossRef CAS.
- S. C. Yan, Z. S. Li and Z. G. Zou, Langmuir, 2010, 26, 3894–3901 CrossRef CAS PubMed.
- S. Guo, Y. Zhu, Y. Yan, Y. Min, J. Fan and Q. Xu, Appl. Catal., B, 2016, 185, 315–321 CrossRef CAS.
- Y. Yao, F. Lu, Y. Zhu, F. Wei, X. Liu, C. Lian and S. Wang, J. Hazard. Mater., 2015, 297, 224–233 CrossRef CAS PubMed.
- L. Ai, C. Zhang, L. Li and J. Jiang, Appl. Catal., B, 2014, 148, 191–200 CrossRef.
- S. Guo, G. Zhang and J. Wang, J. Colloid Interface Sci., 2014, 433, 1–8 CrossRef CAS PubMed.
- Y. Su, Z. Wu, Y. Wu, J. Yu, L. Sun and C. Lin, J. Mater. Chem. A, 2015, 3, 8537–8544 CAS.
- X. Li, Y. Pi, L. Wu, Q. Xia, J. Wu, Z. Li and J. Xiao, Appl. Catal., B, 2017, 202, 653–663 CrossRef CAS.
- L. Guo, F. Chen, X. Fan, W. Cai and J. Zhang, Appl. Catal., B, 2010, 96, 162–168 CrossRef CAS.
- S. I. R. Castillo, C. E. Pompe, J. van Mourik, D. M. A. Verbart, D. M. E. Thies-Weesie, P. E. de Jongh and A. P. Philipse, J. Mater. Chem. A, 2014, 2, 10193–10201 CAS.
- Y. Liu, W. Jin, Y. Zhao, G. Zhang and W. Zhang, Appl. Catal., B, 2017, 206, 642–652 CrossRef CAS.
- H. Li, Y. Li, L. Xiang, Q. Huang, J. Qiu, H. Zhang, M. V. Sivaiah, F. Baron, J. Barrault, S. Petit and S. Valange, J. Hazard. Mater., 2015, 287, 32–41 CrossRef CAS PubMed.
- C. Cai, Z. Zhang, J. Liu, N. Shan, H. Zhang and D. D. Dionysiou, Appl. Catal., B, 2016, 182, 456–468 CrossRef CAS.
- S. Guo, G. Zhang, Y. Guo and J. C. Yu, Carbon, 2013, 60, 437–444 CrossRef CAS.
- S. Xue, H. He, Q. Fan, C. Yu, K. Yang, W. Huang, Y. Zhou and Y. Xie, Environ. Sci. Technol., 2017, 60, 70–77 Search PubMed.
- V. Vaiano, M. Matarangolo, O. Sacco and D. Sannino, Appl. Catal., B, 2017, 209, 621–630 CrossRef CAS.
- M. N. Chong and B. Jin, J. Hazard. Mater., 2012, 199–200, 135–142 CrossRef CAS PubMed.
- V. Vaiano, O. Sacco, M. Stoller, A. Chianese, P. Ciambelli and D. Sannino, Int. J. Chem. React. Eng., 2014, 12, 63–75 Search PubMed.
- Y. Çalışkan, H. C. Yatmaz and N. Bektaş, Process Saf. Environ. Prot., 2017, 111, 428–438 CrossRef.
| This journal is © The Royal Society of Chemistry 2018 |

