DOI:
10.1039/C7RA11967D
(Paper)
RSC Adv., 2018,
8, 1469-1476
Strongly enhanced luminescence of Sr4Al14O25:Mn4+ phosphor by co-doping B3+ and Na+ ions with red emission for plant growth LEDs
Received
31st October 2017
, Accepted 20th December 2017
First published on 4th January 2018
Abstract
Development of a more cost-effective radiation source for use in plant-growing facilities would be of significant benefit for commercial crop production applications. A series of co-doped B3+ and Na+ ions Sr4Al14O25:Mn4+ inorganic luminescence materials which can be used for plant growth were successfully synthesized through a conventional high-temperature solid-state reaction. Powder X-ray diffraction was used to confirm the crystal structure and phase purity of the obtained samples. Then scanning electron microscopy elemental mapping was undertaken to characterize the distribution of the doped ions. Detail investigations on the photoluminescence emission and excitation spectra revealed that emission intensity of tetravalent manganese ions can be well enhanced by monovalent sodium ions and trivalent boron ions under near-ultraviolet and blue excitation. Additionally, crystal field parameters and energies of states are calculated and discussed in detail. Particularly we achieve a photoluminescence internal quantum yield as high as 60.8% under 450 nm blue light excitation for Sr4Al14O25:Mn4+, Na+, B3+. Therefore, satisfactory luminescence properties make these phosphors available to LEDs for plant growth.
Introduction
It is known that green plants can be grown only using red and blue monochromatic light, because chlorophyll has its second distinct absorption peak in the vicinity of 450 nm (the blue light region) and its first peak in the vicinity of 660 nm (red light region). The blue light is indispensable to the morphologically healthy plant growth, and the red light contributes to the plant leaf photosynthesis.1,2 The first successful plant growth experiment using only blue and red LEDs were achieved in June 1994 by Okamoto and Yanagi.3
With LEDs price reduced, LEDs are gradually used as plant lighting source, because of its high light efficiency, energy saving and other characteristics. As the driving currents of the blue chip and the red chip are inconsistent, the design of the driver circuit of LEDs for planet growth would be very complex, resulting in increased cost. Therefore, the plant-grown red lamp that is currently in widespread use in the marketplace is composed of a red phosphor rather than a red chip. The most commonly used red phosphors are nitride phosphor (e.g., Sr2Si5N8:Eu2+, CaAlSiN3:Eu2+) because of high luminous efficiency. But their high temperature (∼1600 °C), high pressure (1–10 MPa) preparation conditions and expensive raw materials containing rare earth elements lead to high cost.4
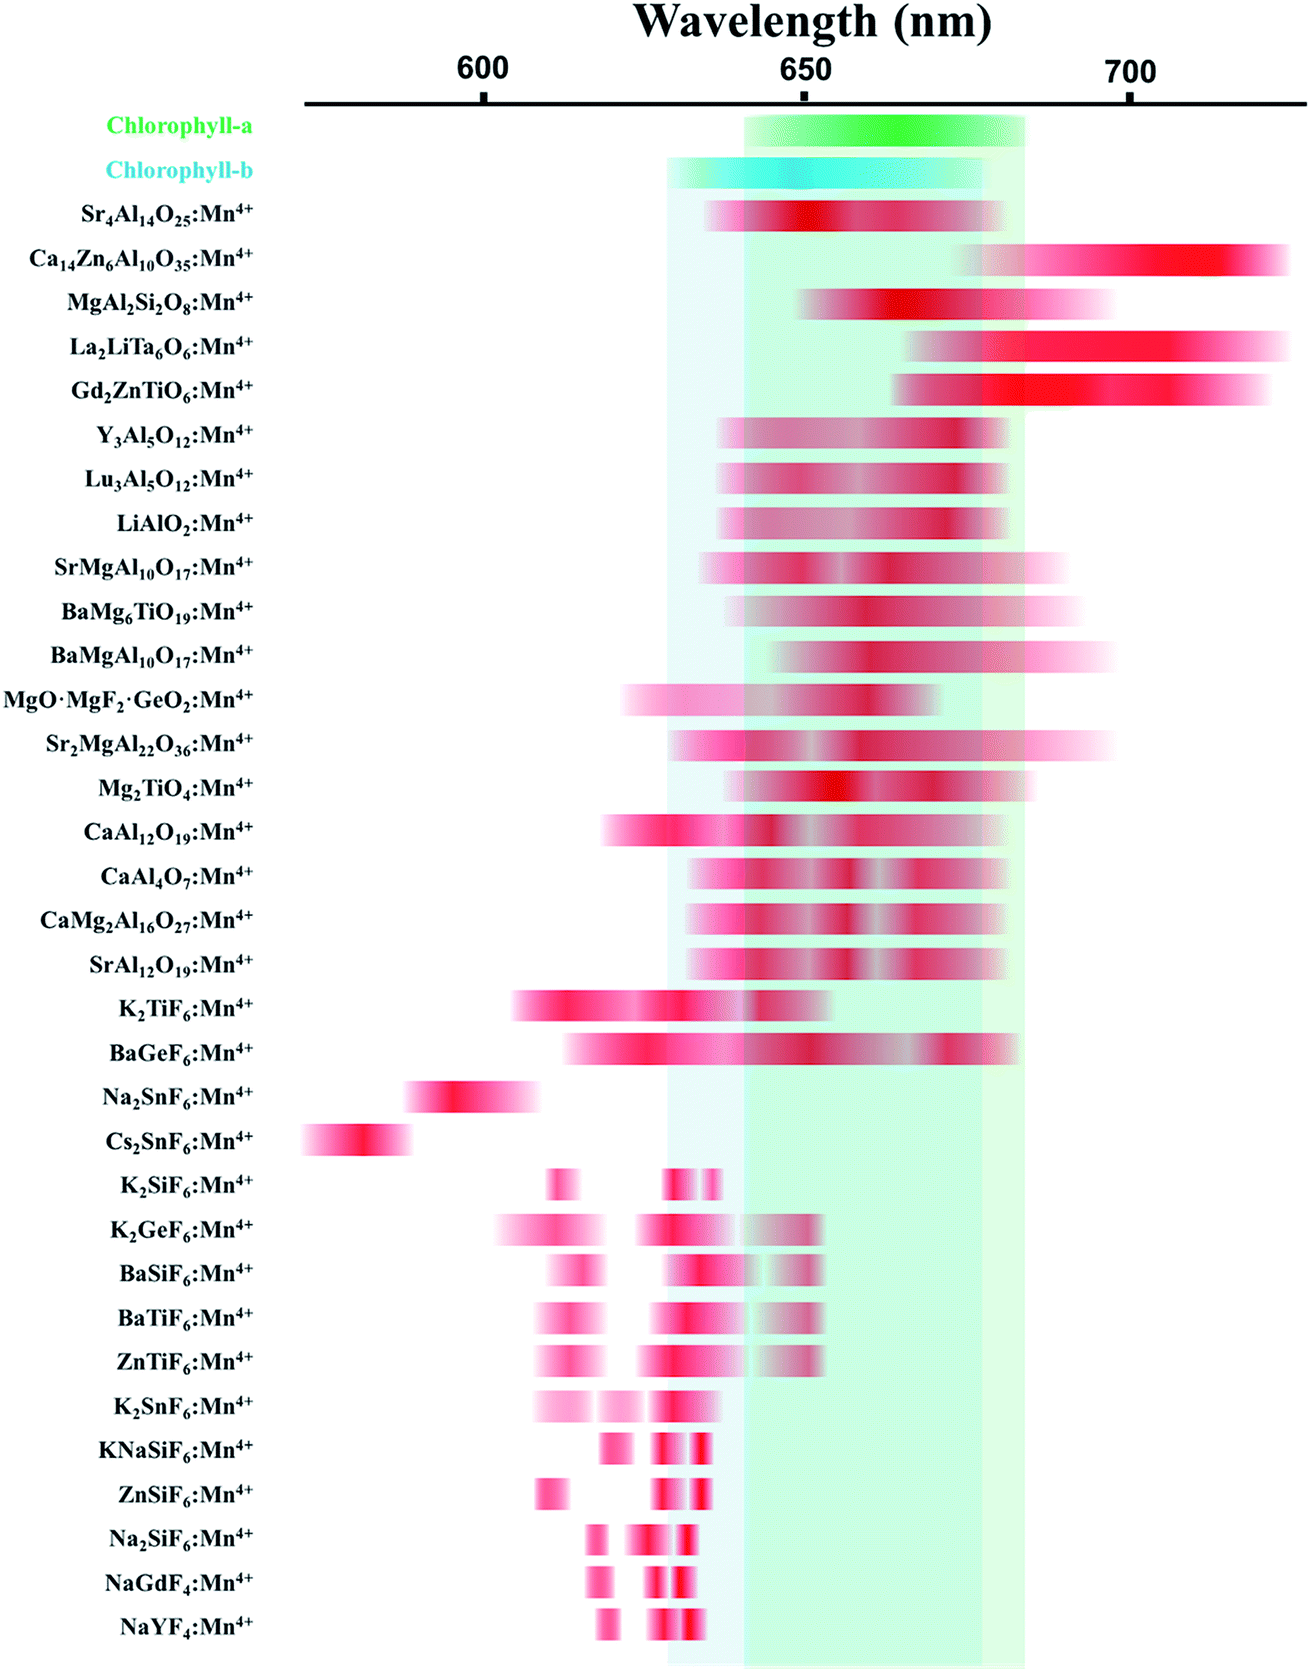
In recent years, Mn4+-activated fluoride compounds, as an alternative to commercial (oxy)nitride phosphors, are emerging as a new class of non-rare-earth red phosphors for high-efficacy warm white LEDs5 compared to Mn4+-activated fluoride phosphor, the emission wavelength of Mn4+-activated oxide phosphors, such as Sr4Al14O25:Mn4+, Y3Al5O12:Mn4+, etc., is much longer which is very suitable for plant lighting, because the absorption peak of plant chlorophyll is near 660 nm. The following diagram shows spectroscopic range of Mn4+ ions in various crystals.6 We can see from Fig. 1 that the emission peak of the Mn4+-activated fluoride phosphor and the absorption peak of chlorophyll rarely overlap, while the emission peak of the Mn4+-activated oxide phosphors, such as Sr4Al14O25:Mn4+, overlap with the absorption peaks of chlorophyll-a and chlorophyll-b.
 |
| | Fig. 1 Spectroscopic range of Mn4+ ions in various crystals. Green and blue color indicate the absorption spectrum region of chlorophyll-a and chlorophyll-b, respectively. Red color indicates the emission spectrum region of various phosphors with Mn4+ ions doped. | |
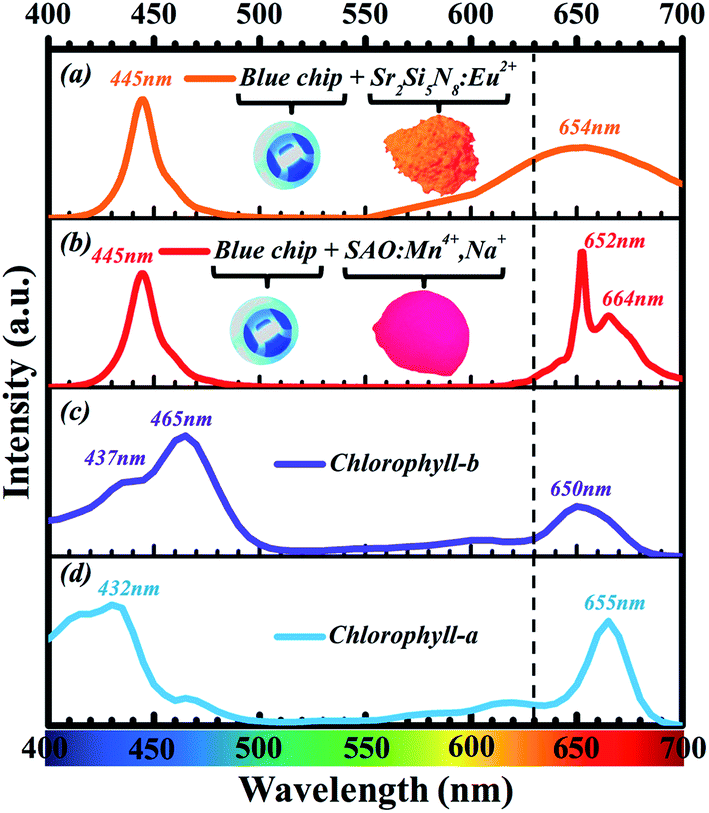
As shown in Fig. 2, the emission spectrum of Sr4Al14O25:Mn4+ red phosphor has overlap more efficiently with the absorption spectrum of chlorophyll compared with Sr2Si5N8:Eu2+ red commercial phosphors. However, most Mn4+-activated oxide phosphors cannot be excited effectively by blue light, which limited its application on blue chip-based LEDs. There are some methods to improve the luminous efficiency and luminous intensity of Mn4+-activated oxide phosphors, such as impurity doping with Mg2+ ions,8,9 impurity doping with Bi3+ ions, and impurity doping with Na+ ions.10–12 The objective of this work is to develop a red emitting phosphor which can match with blue chip for possible application in plant growth. In this article, the red phosphors Sr4Al14O25:Mn4+, Na+, B3+ with strong absorption at blue region were synthesized. The difference with Sr4Al14O25:Mn4+, Na+ phosphors reported by Lili Meng12 was that the excitation intensity of the phosphor we prepared was significantly improved, especially in the blue light region. We also found that the doping amount of B3+ ions was very crucial. Specific doping ratio of B3+ ions and Na+ ions make the luminous performance of the phosphor significantly improved. The advancements of current work include significant improvement of luminescent efficiency of Sr4Al14O25:Mn4+ by doping B3+ and Na+ ions. Notably, doping of B3+ and Na+ ions can improve its visible light excitation efficiency in the spectral range of 400–500 nm so that it can be incorporated as a red component into blue chip-based LED applications for plant growth.
 |
| | Fig. 2 (a) Emission spectrum of LEDs fabricated with 445 nm blue chip and Sr2Si5N8:Eu2+ red phosphor. (b) Emission spectrum of LEDs fabricated with 445 nm blue chip and Sr4Al14O25:Mn4+, red phosphor. (c) Absorption spectrum of chlorophyll-b. (d) Absorption spectrum of chlorophyll-a (redrawn from Zscheile and Comar's (1941) original data7). | |
Experimental section
Materials and synthesis
Polycrystalline phosphors with composition of Sr4Al14O25:Mn4+, Na+, B3+ were prepared with a high-temperature solid-state reaction. Briefly, the constituent raw materials SrCO3 (A. R., 99.9%), Al2O3 (A. R., 99.99%), Na2CO3 (A. R., 99%), H3BO3 (A. R., 99%) and MnO2 (A. R., 99.99%) were weighed according to the stoichiometric ratio. Individual batches of 10 g were weighted according to the designed stoichiometry and mixed homogeneously with the same mass of absolute ethyl alcohol as the dispersant. After planetary ball-milling process, the obtained homogeneous slurry was placed in a Petri dish and dried in an oven. Then, the dried mixtures were put into a crucible with a lid and heated in a tubular furnace at 1400 °C for 6 hours in the air. When cooled down to room temperature, the prepared phosphors were crushed and ground for subsequent measurements.
Characterization
All crystal structure compositions were checked for phase formation by using powder X-ray diffraction (XRD) analysis with a Rigaku X-ray diffractometer (Tokyo, Japan) with a graphite monochromator using Cu Kα radiation (λ = 1.54056 Å), over the angular range 10° < 2θ < 80°, operating at 40 kV and 40 mA. The schematic crystal structure of Sr4Al14O25 was drawn in VESTA.13 The photoluminescence (PL) and photoluminescence excitation (PLE) spectra of the samples were analyzed by using a Hitachi F-7000 spectrophotometer (Tokyo, Japan) with a 150 W Xe lamp.
Results and discussion
Microstructure
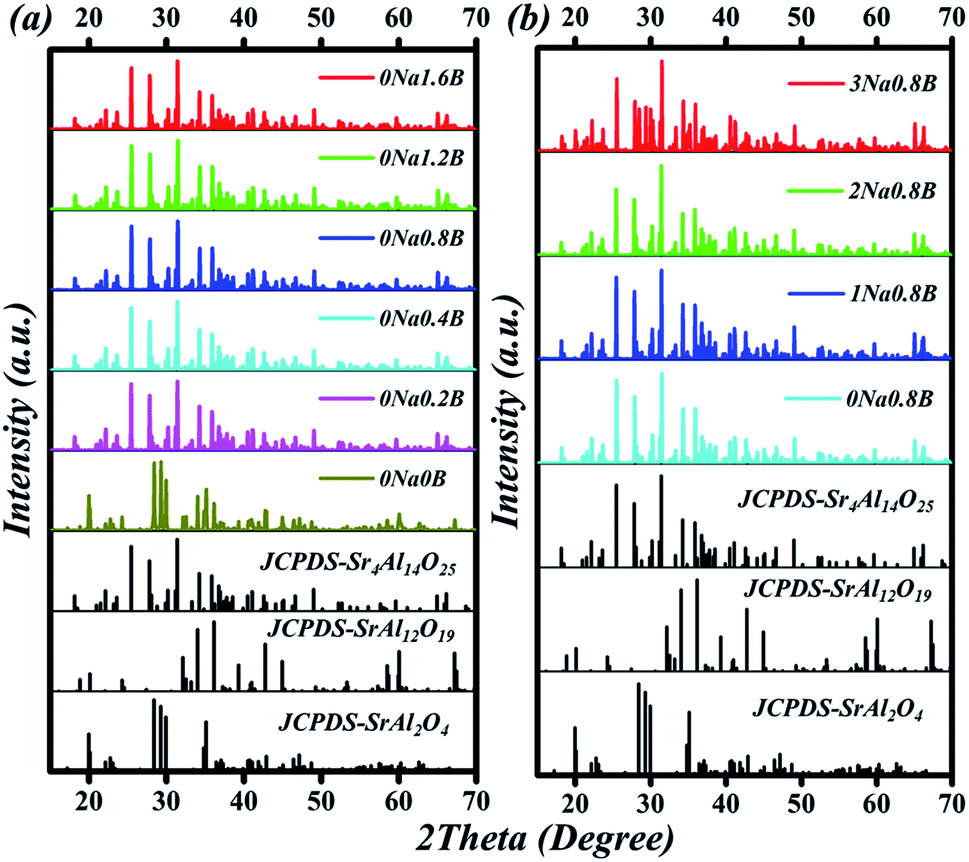
The compositions of the typical Sr4Al14O25:0.014Mn4+, xB3+, 0Na+, (0 ≤ x ≤ 1.6) samples were displayed in Fig. 3a. When no flux is added, the compound Sr4Al14O25 is not formed, and instead, the two phases SrAl2O4 (JCPDS-No. 34-0379) and SrAl12O19 (JCPDS-No. 80-1195) appear. When boric acid is added, for instance at x = 0.2, the sample turns into a single phase of Sr4Al14O25. With increase of x from 0.2 to 1.2, XRD patterns of phosphors agree well with that of standard Sr4Al14O25 (JCPDS-No. 52-1876). Further increment of boric acid content will induce an extra impurity phase of SrAl2O4. Because boric acid has lower melting temperature, it (after being homogeneously dispersed throughout the sample) will be the first component in the mixture to melt at high temperature. This can promote the immigration of Sr and Al ions, for instance by diffusion, and increase the possibility that the ions encounter, and thus accelerate the crystallization process. Excess boron will dilute the content of Sr and Al ions in the sample and it is therefore not beneficial for the formation of the phase Sr4Al14O25. According to the emission spectrum (Fig. 7b), it is concluded that the optimum x of B3+ is 0.8. Comparison of B3+ dopant content in Sr4Al14O25:Mn4+, xB3+ is shown in Table 1. The compositions of the typical Sr4Al14O25:0.014Mn4+, 0.8B3+, yNa+, (0 ≤ y ≤ 3) samples were displayed in Fig. 3b. With increase of y from 0 to 2, XRD patterns of phosphors agree well with that of standard Sr4Al14O25 (JCPDS-No. 52-1876). Further increment of Na+ content will induce an extra impurity phase of SrAl2O4.
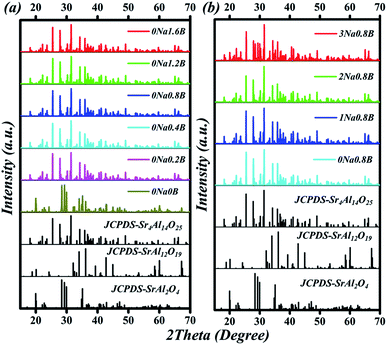 |
| | Fig. 3 (a) XRD patterns of Sr4Al14O25:0.014Mn4+, xB3+, 0Na+ (0 ≤ x ≤ 1.6) phosphors. (b) XRD patterns of Sr4Al14O25:0.014Mn4+, 0.8B3+, yNa+ (0 ≤ y ≤ 3). The reference spectra of Sr4Al14O25 (JCPDS-No. 52-1876), SrAl12O19 (JCPDS-No. 80-1195), SrAl2O4 (JCPDS-No. 34-0379) standard patterns were shown at the bottom. | |
Table 1 Comparison of B3+ dopant content in Sr4Al14O25:Mn4+, xB3+
| Range of x |
Optimum value of x |
Ref. |
| — |
0.4 |
12 |
| — |
0.54 |
14 |
| 0–3.5 |
0.7 |
15 |
| 0–1.6 |
0.8 |
This work |
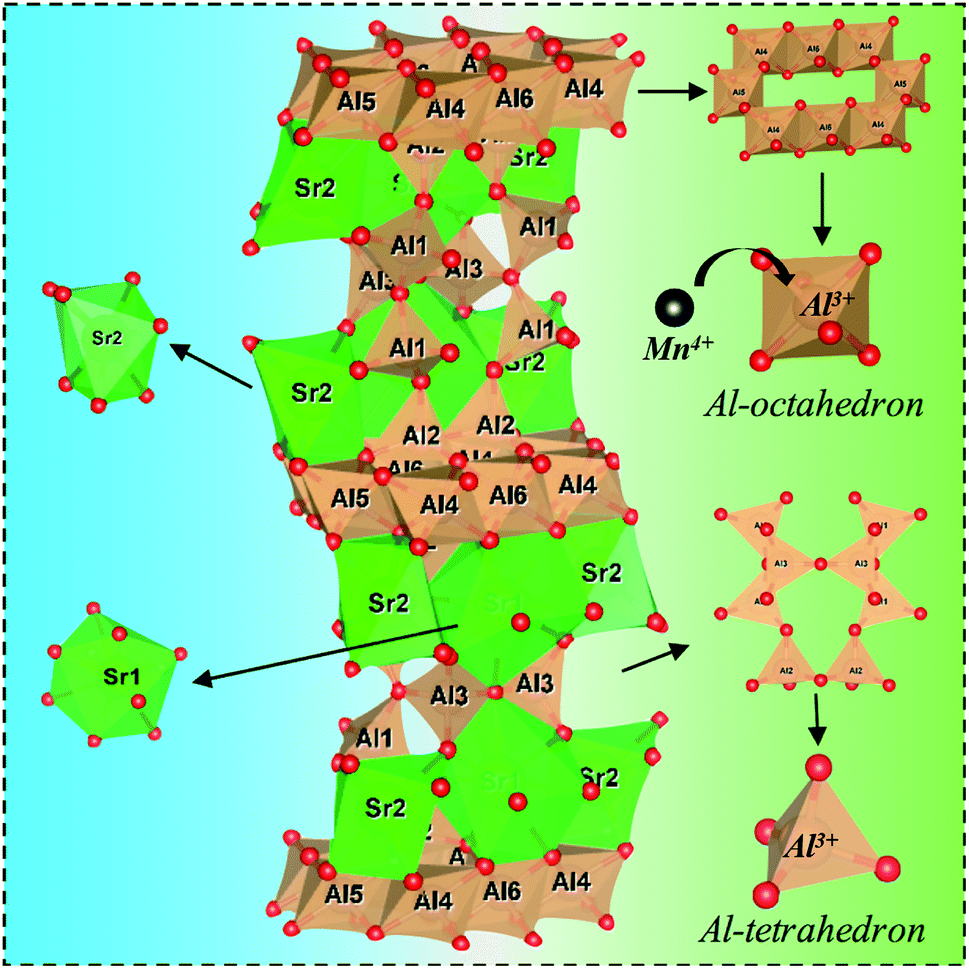
Fig. 4 shows a schematic of the Sr4Al14O25 crystal structure. The space group of Sr4Al14O25 is Pmma and orthorhombic. The networks of orthorhombic Sr4Al14O25 are built by one layer of the octahedral anion groups (AlO6) and several layers of tetrahedral anion groups (AlO4) alternatively. There are three types of AlO6 octahedrons (Al(4)O6, Al(5)O6 and Al(6)O6) and three types of AlO4 tetrahedron (Al(1)O6, Al(2)O6 and Al(3)O6). Compared with the strong covalence effect of the AlO4 tetrahedron, a little weak polarization field of the AlO6 octahedron is more suitable for Mn4+ incorporating. In addition, the Mn4+ ion always experiences a strong CF due to its high effective positive charge with the result that the emission spectrum is always dominated by the sharp emission line corresponding with the spin-forbidden 2Eg → 4A2g transition.16
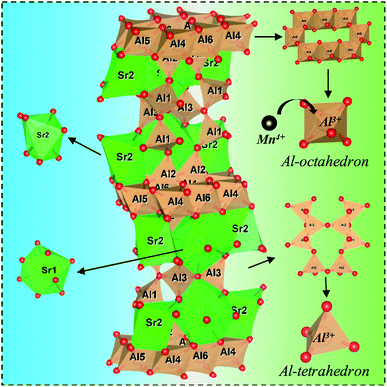 |
| | Fig. 4 Schematic illustration of crystal structure of Sr4Al14O25. Black ball: Mn; Green ball: Sr; red ball: O; and brown ball: Al. Brown polyhedron: AlO6-octahedron/AlO4-tetrahedron; green polyhedron: SrO7/SrO8. | |
Luminescence property
Fig. 5a show the PLE spectrum of Sr4Al14O25:0.8B3+, 2Na+, zMn4+ (0.05% ≤ z ≤ 0.5%) phosphor monitored at 652 nm. Fig. 5b show the PL spectrum of Sr4Al14O25:0.8B3+, 2Na+, zMn4+ (0.05% ≤ z ≤ 0.5%) phosphor excited at 450 nm. Fig. 5c and d visually show the excitation and emission intensity of Mn4+ on dopant concentration for Sr4Al14O25:0.8B3+, 2Na+, zMn4+ phosphor, respectively. As we can see, the optimum molar concentration of Mn4+ in Sr4Al14O25:0.8B3+, 2Na+, zMn4+ in this work was 0.1 mol%. The photoluminescence emission spectrum of the phosphor presented a double-peak structure between 600 and 700 nm with two strong bands at about 654 and 664 nm, which were attributed to the 2E → 4A2 transition of Mn4+ ions and a phonon sideband transition, respectively.13
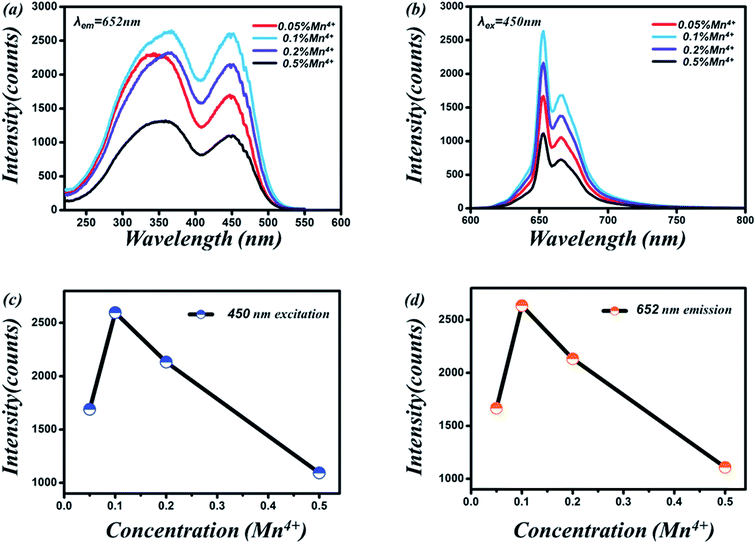 |
| | Fig. 5 (a) PLE spectrum of Sr4Al14O25:0.8B3+, 2Na+, zMn4+ (0.05% ≤ z ≤ 0.5%) phosphor monitored at 652 nm. (b) PL spectrum of Sr4Al14O25:0.8B3+, 2Na+, zMn4+ phosphor excited by 450 nm blue light. (c) Dependence of Mn4+ PLE intensity on dopant concentration for Sr4Al14O25:0.8B3+, 2Na+, zMn4+ phosphor. (d) Dependence of Mn4+ PL intensity on dopant concentration for Sr4Al14O25:0.8B3+, 2Na+, zMn4+ phosphor. | |
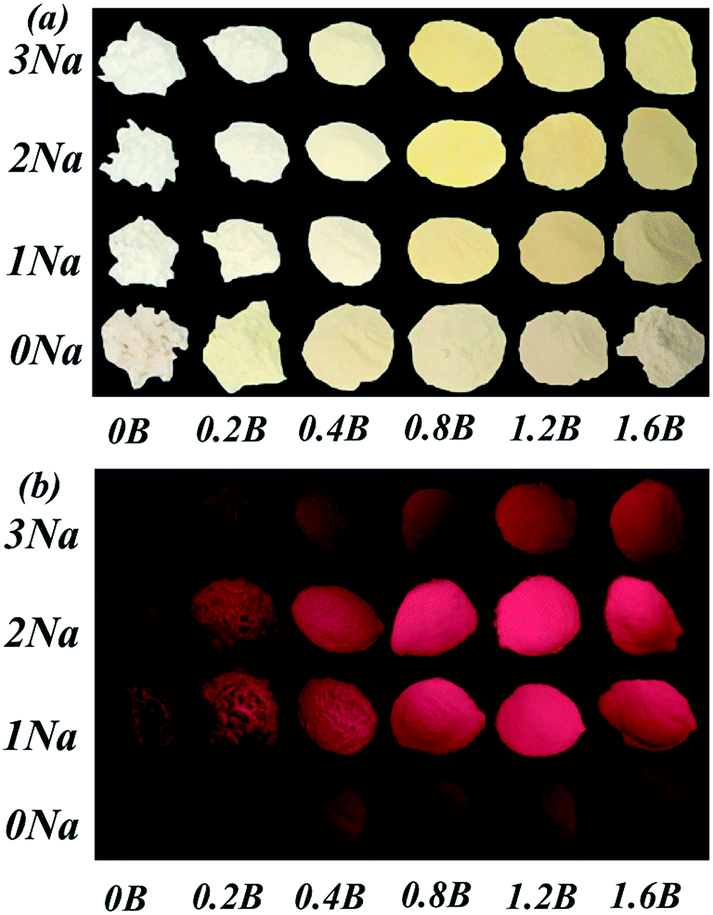
After obtained optimum Mn4+ doping concentration, we adjusted the amount of B3+ and Na+. Fig. 6a and b show the photographs of Sr4Al14O25:0.014Mn4+, xB3+, yNa+ (0 ≤ x ≤ 1.6, 0 ≤ y ≤ 3) under natural sunlight and 365 nm UV light, respectively. Along with Na+ ions and B3+ doping concentrations increasing, the color of Sr4Al14O25:0.014Mn4+, xB3+, yNa+ phosphors under natural sunlight change from light yellow to bright yellow. This might be ascribed to the Na+ and B3+ ions enhanced absorption band (220–500 nm), especially in the region of 400–500 nm, as illustrated in Fig. 7a.
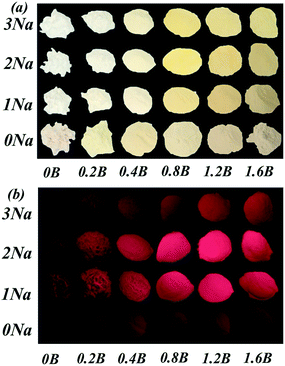 |
| | Fig. 6 (a) Photographs of Sr4Al14O25:0.014Mn4+, xB3+, yNa+ (0 ≤ x ≤ 1.6, 0 ≤ y ≤ 3) under natural sunlight. (b) Photographs of Sr4Al14O25:0.014Mn4+, xB3+, yNa+ under 365 nm UV light. | |
 |
| | Fig. 7 (a) PLE spectrum of Sr4Al14O25:0.014Mn4+, xB3+, yNa+ phosphor monitored at 652 nm. (b) PL spectrum of Sr4Al14O25:0.014Mn4+, xB3+, yNa+ phosphor excited by 450 nm blue light. | |
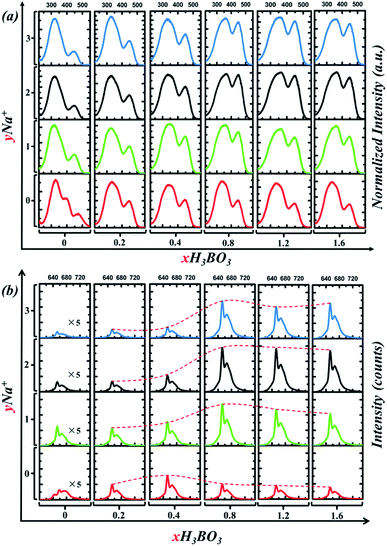
In detail, Fig. 7a shows PLE spectrum of Sr4Al14O25:0.014Mn4+, xB3+, yNa+ phosphor monitored at 652 nm. In order to compare the relative changes of the excitation bands, the PLE intensity is normalized. When no Na+ is added, with x of B3+ increases from 0.2 to 1.6, the relative magnitude of excitation bands varies little. Furthermore, the optimum x of B3+ is 0.4, not 0.8, according to Fig. 7b. When Na+ is added, for instance at y = 1, the intensity of the blue excitation band (400–500 nm) has been dramatically increased, as shown in Fig. 7a. In Fig. 7b, we can see that the optimum x of B3+ turns to 0.8 from 0.4. When x of B3+ is fixed at 0.8, the emission intensity increased first, reached the maximum (y = 2), and then decreased with the increase of Na+ content. Cross experiment can clearly found that the optimal combination is x = 0.8, y = 2. To illustrate the difference between our experimental results and Meng's,12 the detail differences are listed in Table 2. As we can see the amount of doping Na+ and B3+ is observably different. As Fig. 7a shown, when x = 0.4, the addition of Na+ does not significantly affect the relative intensity between the two excitation bands. This is why Meng didn't report the asynchronous increase of excitation bands. This asynchronous increase of excitation bands, however, allows the phosphor to be more easily excited by blue light. As Fig. 7b shows, the PL emission intensity excited by 450 nm blue light sharply increased 3 times when x of B3+ turns to 0.8 from 0.4 (when y = 2). Therefore, addition of B3+ and Na+ ions in Sr4Al14O25:0.014Mn4+, xB3+, yNa+ can significantly improve its visible light excitation efficiency in the spectral range of 400–500 nm so that it can be incorporated as a red component into blue chip-based LED applications for plant growth.
Table 2 Comparison of dopant content in Sr4Al14O25:xB3+, yNa+, zMn4+
| Range of x |
Optimum value of x |
Range of y |
Optimum value of y |
Optimum value of z |
Excitation bands |
Ref. |
| 0.4 |
— |
0.05 |
0–0.09 |
0.01 |
Synchronous increase |
11 |
| 0.8 |
0–1.6 |
2 |
0–3 |
0.014 |
Asynchronous increase |
This work |
Fig. 8a and b show the photoluminescent excitation and emission spectra of the Sr4Al14O25:0.014Mn4+, 0.8B3+ based phosphors with or without co-incorporating Na+. The fluorescent intensities of the phosphors excited at 450 nm reached a maximum at x = 0.8, y = 2 and z = 0.014, and the strongest emission intensity of Sr4Al14O25:0.8B3+, 2Na+, 0.014Mn4+ sample were increased by 700% compared with Sr4Al14O25:0.8B3+, 0.014Mn4+ without Na+ co-doping. The photographs of the Sr4Al14O25:0.014Mn4+, 0.8B3+, 2Na+ sample and Sr4Al14O25:0.014Mn4+, 0.8B3+ sample exposed to 450 nm blue light and 365 nm UV light are shown in the insert of the Fig. 8a and b. After the incorporating of sodium ions, the brightness of phosphor becomes larger. We can find that the excitation spectra are consists of three conjoint bands by multi-peaks fitting, which located from near UV region to visible blue region. These three bands are corresponding to 4A2 → 4T2, 4A2 → 2T2 and 4A2 → 4T1 transition, respectively. Though according to the spin selection rule of ΔS = 0, the transitions between 4T2, 4T1 and ground 4A2 levels are spin-allowed, the spin-forbidden transition 4A2 → 2T2 is still be found in our result and other Mn-incorporated phosphors, such as CaAl12O19:Mn4+,17 SrMgAl10O17:Mn4+,18 Mg2TiO4:Mn4+,10 Li2Mg3SnO6:Mn4+,19 Ba2TiGe2O8:Mn4+,20 and Na2MgAl10O17:Mn4+.21 By fitting the peaks of the excitation spectra, we found that all the excitation peaks have a red shift as the sodium incorporated.
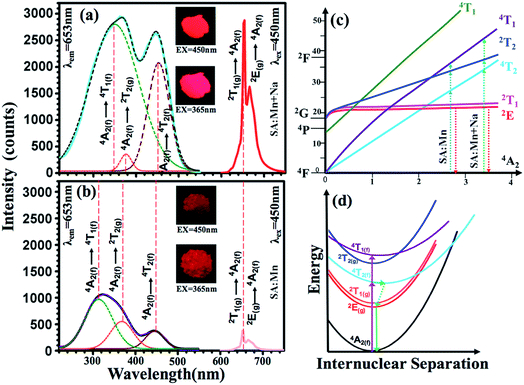 |
| | Fig. 8 (a) PL (EX = 450 nm) and PLE (EM = 652 nm) spectra of Sr4Al14O25:0.014Mn4+, 2Na+, 0.8B3+ and (b) Sr4Al14O25:0.014Mn4+, 0.8B3+ respectively; (c) Tanabe–Sugano energy diagram of a 3d3 system in an octahedral crystal field; (d) configurational coordinate diagram for Mn4+ ions in Sr4Al14O25 hosts. | |
Crystal filed strength calculation
The values of Dq, B and C can be calculated based on experimentally determined energy levels using the following equations:5| | |
Dq = E(4T2g − 4A2g)/10
| (1) |
| |
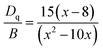 | (2) |
where Dq represents the crystal field strength and the parameter x is defined as| |
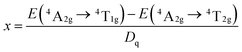 | (3) |
| | |
E(2Eg − 4A2g)/B = 3C/B + 9 − 9B/Dq
| (4) |
From Fig. 8a, the energy levels of 4T2, 4T1 and 2Eg in the Sr4Al14O25:0.014Mn4+, 0.8B3+, 2Na+ host were determined at 22![[thin space (1/6-em)]](https://www.rsc.org/images/entities/char_2009.gif) 124, 28986 and 15314 cm−1, respectively. From Fig. 8b, the energy levels of 4T2, 4T1 and 2Eg in the Sr4Al14O25:0.014Mn4+, 0.8B3+ host were determined at 22321, 30769 and 26667 cm−1, respectively. From eqn (1)–(4), the crystal field parameters of Dq, B, C in the Sr4Al14O25:0.014Mn4+, 0.8B3+, 2Na+ were calculated to be 2212, 644 and 3735 cm−1, respectively. The crystal field parameters of Dq, B, C in the Sr4Al14O25:0.014Mn4+, 0.8B3+ were calculated to be 2232, 830 and 3540 cm−1, respectively. Once these parameters have been determined, the energies of all other states such as 2T1, 2A1 and 4T1 can be theoretically predicted by:
124, 28986 and 15314 cm−1, respectively. From Fig. 8b, the energy levels of 4T2, 4T1 and 2Eg in the Sr4Al14O25:0.014Mn4+, 0.8B3+ host were determined at 22321, 30769 and 26667 cm−1, respectively. From eqn (1)–(4), the crystal field parameters of Dq, B, C in the Sr4Al14O25:0.014Mn4+, 0.8B3+, 2Na+ were calculated to be 2212, 644 and 3735 cm−1, respectively. The crystal field parameters of Dq, B, C in the Sr4Al14O25:0.014Mn4+, 0.8B3+ were calculated to be 2232, 830 and 3540 cm−1, respectively. Once these parameters have been determined, the energies of all other states such as 2T1, 2A1 and 4T1 can be theoretically predicted by:
| | |
E(2T1 − 2Eg) = 66B2/(10Dq)
| (5) |
| | |
E(2A1 − 4A2) = 10Dq + 4B + 3C
| (6) |
| | |
E(4T1(P) − 4A2) = 15Dq + 7.5B − 0.5[100Dq2 − 180DqB + 225B2]1/2
| (7) |
The crystal field parameters and the energies of states in Sr4Al14O25:0.014Mn4+, 0.8B3+, 2Na+ and Sr4Al14O25:0.014Mn4+, 0.8B3+ crystal lattices are summarized in the Table 3. As shown in Fig. 8c, the dependence of energy levels of Mn4+ on crystal field strength can be illustrated by Tanabe–Sugano energy diagram. The 2Eg levels are almost parallel to the ground state 4A2, which results that the location of the emission peak is difficult to be influenced by crystal field strength. While, the energy gap between 4T1 (or 4T2) levels and ground state 4A2 can be changed by variation of the crystal field strength. The electron transition schematic diagrams are shown in the Fig. 8c with blue and green dot lines. The value of Dq/B increased to 3.43 from 2.69 as the Na+ ions addition. There is a difference in the asynchronous increases of the near UV and visible absorption bands. The increase of the excitation intensity at visible blue region is much larger than at near UV region, even both excitation intensity at these two regions are almost equal. Na+ compounds are well known fluxes in solid state synthesis. However, the shapes of the excitation bands cannot be changed by fluxes and meanwhile the redshift of the excitation is a change on the luminous mechanism instead of fluxes effect.
Table 3 Crystal field parameters and energies of states in Sr4Al14O25:0.014Mn4+, 0.8B3+, 2Na+ and Sr4Al14O25:0.014Mn4+, 0.8B3+ crystal lattices
| |
Sr4Al14O25:0.014Mn4+, 0.8B3+, 2Na+ (cm−1) |
Sr4Al14O25:0.014Mn4+, 0.8B3+ (cm−1) |
| Dq |
2212 |
2232 |
| B |
644 |
830 |
| C |
3735 |
3540 |
| Dq/B |
3.43 |
2.69 |
| 4A2 → 4T2 |
22124 |
22321 |
| 4A2 → 2T2 |
26455 |
26667 |
| 4A2 → 4T1 |
28985 |
30769 |
| 2Eg → 4A2 |
15314 |
15314 |
| 2Eg → 2T1 |
1238 |
2039 |
| 4A2 → 2A1 |
35905 |
36264 |
| 4A2 → 4T1 |
28986 |
30769 |
Fig. 8d shows a schematic diagram of a process of photoluminescence. The 2Eg, 2T1, 2T2 and 4A2 levels are derived from the t32 electronic orbital, whereas the 4T1 and 4T2 levels are formed from another t22e orbital, resulting a displacement between the parabolas of ground state 4A2 and 4T1 (or 4T2). The electronics are excited from to ground state 4A2 to 4T1, 4T2 or 2T2 levels by radiation. Then, the excited electronics usually relax non-radiatively to 2Eg followed by the spin-forbidden 2Eg → 4A2 transition characterized by wide emission bands.
Conclusions
A series of Sr4Al14O25:xB3+, yNa+, zMn4+ red phosphors were synthesized by a high-temperature solid-state reaction method at 1400 °C for 6 hours in the air. The fluorescent intensities of the phosphors excited at 450 nm reached a maximum at x = 0.8, y = 2 and z = 0.014, and the strongest emission intensity of Sr4Al14O25:0.8B3+, 2Na+, 0.014Mn4+ sample were increased by 700% compared with Sr4Al14O25:0.8B3+, 0.014Mn4+ without Na+ co-doping. In comparison with Mn4+ single incorporated phosphor, Sr4Al14O25:0.014Mn4+, 0.8B3+, 2Na+ shows greater advantage of promising application incorporated as a red component into blue chip-based LED for plant growth because of much stronger absorption at blue light region and enhanced red emission. The prepared phosphors could be efficiently excited by both near-UV light and the commercially available blue light of LED chips at 450 nm.
Conflicts of interest
There are no conflicts to declare.
Acknowledgements
This work was financially supported by the programs of the National Key Research and Development Program of China (2017YFB0403200).
References
- K. Okamoto, T. Yanagi, S. Takita, M. Tanaka, T. Higuchi, Y. Ushida and H. Watanabe, Development of plant growth apparatus using blue and red LED as artificial light source, Acta Hortic., 1996, 440, 111 CrossRef CAS PubMed.
- E. C. Wassink and J. A. J. Stol Wijk, Effects of Light Quality on Plant Growth, Annu. Rev. Plant Physiol., 1956, 7, 373–400 CrossRef CAS.
- K. Okamoto and T. Yanagi, Development of light source for plant growth using blue and red super-bright LEDs, Shikoku-Section Joint Convention Record of the Institute of Electrical and Related Engineers, 1994, p. 109 Search PubMed.
- R.-J. Xie, N. Hirosaki, T. Suehiro, F.-F. Xu and M. Mitomo, A Simple, Efficient Synthetic Route to Sr2Si5N8:Eu2+-Based Red Phosphors for White Light-Emitting Diodes, Chem. Mater., 2006, 18, 5578–5583 CrossRef CAS.
- H. Zhu, C. Che Lin, W. Luo, S. Shu, Z. Liu, Y. Liu, J. Kong, E. Ma, Y. Cao, R.-S. Liu and X. Chen, Highly efficient non-rare-earth red emitting phosphor for warm white light-emitting diodes, Nat. Commun., 2014, 5, 4312 CAS.
- D. Chen, Y. Zhou and J. Zhong, A review on Mn4+ activators in solids for warm white light-emitting diodes, RSC Adv., 2016, 6, 86285–86296 RSC.
- C. L. Comar and F. P. Zscheile, Analysis Of Plant Extracts For Chlorophylls A And B By A Photoelectric Spectrophotometric Method, Plant Physiol., 1942, 17, 198–209 CrossRef CAS PubMed.
- D. Chen, Y. Zhou, W. Xu, J. Zhong, Z. Ji and W. Xiang, Enhanced Luminescence of Mn4+:Y3Al5O12 via Impurity Doping, J. Mater. Chem. C, 2016, 4, 1704–1712 RSC.
- M. Peng, X. Yin, P. A. Tanner, M. G. Brik and P. Li, Site Occupancy Preference, Enhancement Mechanism, and Thermal Resistance of Mn4+ Red Luminescence in Sr4Al14O25:Mn4+ for Warm WLEDs, Chem. Mater., 2015, 27, 2938–2945 CrossRef CAS.
- Z. Qiu, T. Luo, J. Zhang, W. Zhou, L. Yu and S. Lian, Effectively enhancing blue excitation of red phosphor Mg2TiO4:Mn4+ by Bi3+ sensitization, J. Lumin., 2015, 158, 130–135 CrossRef CAS.
- L. Wang, Y. Xu, D. Wang, R. Zhou, N. Ding and M. Shi, Deep red phosphors SrAl12O19:Mn4+, M (M = Li+, Na+, K+, Mg2+) for high colour rendering white LEDs, Phys. Status Solidi, 2013, 210(7), 1433–1437 CrossRef CAS.
- L. Meng, L. Liang and Y. Wen, A novel red phosphor Na+, Mn4+ co-doped Sr4Al14O25 for warm white light emitting diodes, Mater. Chem. Phys., 2015, 153, 0254–0584 CrossRef.
- K. Momma and F. Izumi, VESTA 3 for three-dimensional visualization of crystal, volumetric and morphology data, J. Appl. Crystallogr., 2011, 44, 1272 CrossRef CAS.
- Y. D. Xu, D. Wang, L. Wang, N. Ding, M. Shi and J. G. Zhong, Preparation and luminescent properties of a new red phosphor (Sr4Al14O25:Mn4+) for white leds, J. Alloys Compd., 2013, 550, 226–230 CrossRef CAS.
- M. Peng, X. Yin, P. A. Tanner, C. Liang, P. Li and Q. Zhang, Orderly-layered tetravalent manganese-doped strontium aluminate Sr4Al14O25:Mn4+: an efficient red phosphor for warm white light emitting diodes, J. Am. Ceram. Soc., 2013, 96, 2870–2876 CrossRef CAS.
- M. G. Brik, S. J. Camardello and A. M. Srivastava, Influence of covalency on the Mn4+ 2Eg → 4A2g emission energy in crystals, ECS J. Solid State Sci. Technol., 2015, 4, R39–R43 CrossRef CAS.
- T. Murata, T. Tanoue, M. Iwasaki, K. Morinaga and T. Hase, Fluorescence properties of Mn4+, in CaAl12O19 compounds as red-emitting phosphor for white LED, J. Lumin., 2005, 114, 207–212 CrossRef CAS.
- L. Meng, L. Liang and Y. Wen, Deep red phosphors SrMgAl10O17:Mn4+, M (M = Li+, Na+, K+, Cl−) for warm white light emitting diodes, J. Mater. Sci.: Mater. Electron., 2014, 25, 2676–2681 CrossRef CAS.
- R. Cao, J. Zhang, W. Wang, Z. Hu, T. Chen, Y. Ye and X. Yu, Preparation and photoluminescence characteristics of Li2Mg3SnO6:Mn4+, deep red phosphor, Mater. Res. Bull., 2017, 87, 109–113 CrossRef CAS.
- R. Cao, Y. Ye, Q. Peng, G. Zheng, H. Ao, J. Fu, Y. Guo and B. Guo, Synthesis and luminescence characteristics of novel red-emitting Ba2TiGe2O8:Mn4+ phosphor, Dyes Pigm., 2017, 146, 14–19 CrossRef CAS.
- Q. Peng, R. Cao, Y. Ye, S. Guo, Z. Hu, T. Chen and G. Zheng, Photoluminescence properties of broadband deep-red-emitting Na2MgAl10O17:Mn4+ phosphor, J. Alloys Compd., 2017, 725, 139–144 CrossRef CAS.
|
| This journal is © The Royal Society of Chemistry 2018 |
Click here to see how this site uses Cookies. View our privacy policy here. 
 Open Access Article
 This Open Access Article is licensed under a
  *
*