 Open Access Article
The hydrothermal synthesis of ultra-high aspect ratio Ag nanoflakes and their performance as conductive fillers in heaters and pastes†
Hua Wangab,
Wenjuan Yangab,
Kaibin Liab and
Guanghai Li *a
*a
aKey Laboratory of Materials Physics, Anhui Key Laboratory of Nanomaterials and Nanostructures, Institute of Solid State Physics, Chinese Academy of Sciences, Hefei 230031, PR China. E-mail: ghli@issp.ac.cn
bUniversity of Science and Technology of China, Hefei, 230026, PR China
First published on 28th February 2018
Abstract
Ag nanoflakes with a size ranging from 5 to 60 μm, a thickness of several tens of nanometers and an aspect ratio of up to 800 have been synthesized via a hydrothermal method. PVP was used as both a surfactant, inducing anisotropic growth of the Ag nanoflakes, and as a reductant, reducing Ag+ to Ag. An Ag–oxalate complex was used as a precursor, allowing effective control of the kinetic growth of the Ag nanoflakes. Influences on the size and morphology of the Ag nanoflakes, such as H+ concentration and reaction time, were discussed and analyzed. Our method can be easily scaled up for mass production. A large interfacial contact area between the Ag nanoflakes with more electrical channels makes the Ag nanoflakes excellent conductive fillers.
Introduction
Due to their unique physical and chemical properties, silver nanomaterials have attracted extensive attention in fields such as optoelectronics,1–4 optics,5,6 SERS,7–11 conductive pastes,12–16 and heaters.17,18 It was found that morphology, size, and crystallinity strongly affect the performance of Ag nanomaterials, and great efforts have been made towards obtaining Ag nanostructures with specific morphologies such as dendrites,19 nanowires,20 nanorods,21 nanocubes,22 and nanoflakes.23 Ag nanoflakes with a high aspect ratio have been widely studied because of their potential applications as SERS-active substrates and as high conductivity fillers in Ag conductive pastes.Ag nanoflakes can be prepared via either physical or chemical methods. Physical methods, like the ball-milling method,24 can be used to prepare Ag nanoflakes, but the nanoflakes have poor crystallinity and a rough surface. Chemical methods, such as electrochemical methods,25 ultrasonic radiation,26 solvothermal methods,27 direct chemical reduction,28 and photo-induced chemical methods,29 have been widely used to synthesize Ag nanoflakes. A solvothermal method has been used to fabricate Ag nanoplates by reducing AgNO3 with N,N-dimethylformamide in the presence of PVP at a high temperature of 160 °C,27 but the Ag nanoplates usually have a low aspect ratio. A chemical reduction method has been developed to synthesize Ag nanosheets using hydrogen peroxide as a reducing agent at room temperature,30 and the Ag nanosheets have a lateral edge length of up to 15 μm and a thickness of 28 nm. Plate-like Ag with an edge length of tens of micrometers has been prepared using chloroplatinic acid as a catalytic agent, in a solution of ethylene glycol and ammonia, in the presence of Pt seeds.31 Micrometer sized ultra-thin Ag nanosheets have also been synthesized using Cu+ as a reducing agent in an organic solvent containing oleylamine.32
The growth of Ag nanoflakes is a kinetically controlled process, and maintaining a low Ag concentration in the reaction system is essential to suppress the self-nucleation of Ag.23,33 The crystal morphology and size of the Ag nanomaterials can be well controlled by adjusting the crystal nucleation and growth in either a thermodynamically or kinetically controlled process. The growth of Ag nanoflakes is mainly a kinetically controlled process, and the morphology of the Ag crystal nucleus is determined by its surface energy. The surface energy has the relationship: γ{111} < γ{100} < γ{110} for FCC Ag, and thus the {111} facet is generally the crystal facet found in nucleation and growth under kinetic conditions, in which the most stable structure is a stacking fault with {111} facets. It was found that the stacking fault is essential in inducing the growth of the Ag nanoflakes,34,35 while a slow reduction speed of Ag+ to Ag is beneficial for obtaining the stacking faults. The stacking faults in the {111} crystal surface can form reentrant groove structures on the six sides of the Ag crystal, which will provide nucleation sites in the initial growth stage, and allow the region to grow rapidly to a certain thickness which energetically facilitates subsequent lateral crystal growth. PVP can be used as both a surfactant and a reductant because of its special molecular structure with a lactam group.36–38 Ag twin seeds with stacking faults formed at an initial stage can anisotropically grow into Ag nanoflakes in an aqueous colloidal system of PVP,39 and under well-controlled conditions, regular hexagonal Ag nanoflakes have been obtained.40
In this work we report a hydrothermal synthesis of Ag nanoflakes using an Ag oxalate ligand as a precursor and PVP as both the capping and reducing agent. Ag nanoflakes with different morphologies such as triangular, truncated triangular, hexagonal and dodecagonal, and a high aspect ratio were obtained. Our method can effectively harness the kinetic growth process of the Ag nanoflakes and can be easily scaled up for mass production. The applications of the Ag nanoflakes as highly conductive fillers in film heaters and in commercial Ag paste were demonstrated.
Results and discussion
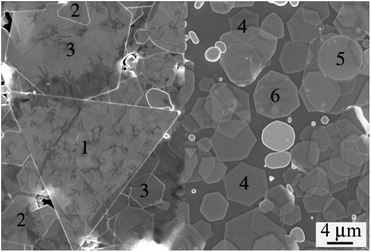
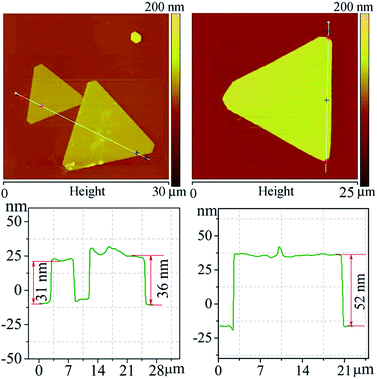
The growth process of Ag crystals is very complicated under kinetic conditions because of the influence of factors such as temperature disturbances and the surfactant, resulting in the formation of Ag nanoflakes with different shapes. Fig. 1 shows the FESEM images of the Ag nanoflakes in the same reaction system. One can clearly see the Ag nanoflakes with different shapes, such as triangular, hexagonal and dodecagonal. It is worth noting that, in spite of their different shapes and sizes, almost all the Ag nanoflakes have a good crystal symmetry. It was found that the dominating shape of the Ag nanoflakes depends strongly on the growth conditions and the components of the reaction system. Fig. S1a† shows a typical XRD pattern of the Ag nanoflakes, in which there exists a solo strong sharp peak situated at about 38.1°, demonstrating a high crystallinity and a preferred orientation of growth along the [111] direction of the Ag nanoflakes. The corresponding FESEM image shows that the Ag nanoflakes have a relatively uniform size with an average edge length of about 35.2 μm (see the inset of Fig. S1a†). Fig. S1b† shows a typical TEM image of a triangular Ag nanoflake and the corresponding SAED pattern. The presence of 1/3(−422) and 2/3(−422) diffraction spots, which are normally forbidden in a FCC structure, provides evidence of the presence of stacking faults in the Ag nanoflake. It was found the size of Ag nanoflakes depends strongly on the experiment parameters like the polymerization degree and concentration of PVP, H+ concentration, reaction temperature and time. To realize the controllable synthesis of Ag nanoflakes, the optimizing of these parameters is essential.Fig. 2 shows the AFM profiles of triangular Ag nanoflakes. One can see nanoflakes with edge lengths of 11, 16.2 and 18.7 μm, thicknesses of 31, 36 and 53 nm and aspect ratios of 355, 450 and 353, respectively. Clearly, the thickness increases with an increasing edge length of the Ag nanoflakes. The growth of the Ag nanoflakes is a time-dependent process, and although the deposition rate of Ag onto the side facets of the flakes is much faster than that onto the {111} facets because of the selective adsorption of the surfactant, PVP-K60, the thickness of the Ag nanoflakes will increase with increasing lateral growth. The nanoflakes depend strongly on the experimental parameters, such as the polymerization degree and concentration of PVP, the H+ concentration, the reaction temperature and time. To realize the controllable synthesis of Ag nanoflakes, optimization of these parameters is essential.
Polymerization degree and concentration of PVP
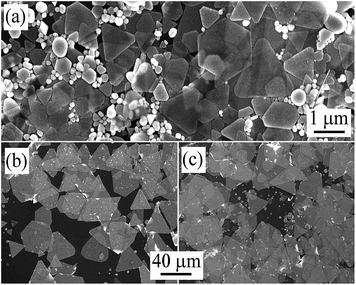
As a surfactant, PVP can preferentially adhere onto the {111} crystal planes because the carbonyl –C![[double bond, length as m-dash]](https://www.rsc.org/images/entities/char_e001.gif) O with a lone pair of electrons can easily coordinate with Ag and play a key role in determining the size and morphology of the Ag nanoflakes. PVP is also a weak reductant because of the relatively strong electronegativity of O and N atoms of the lactam group,39 in which the electron cloud will tend towards the O atom in carbonyl group and the carbonyl-linked N atom. This weak reducing power can maintain the free Ag atoms in the reaction system at a consistently low concentration, facilitating the growth of the Ag atoms in a hexagonal closely packing way, which is the reason for the formation of stacking faults in the Ag seed crystals. Fig. 3 shows the FESEM images of the Ag nanoflakes grown with different PVP polymerization degrees (with the same mass content in the reaction systems). One can see that the size of the Ag nanoflakes increases with an increase in the PVP polymerization degree, and that the average size of the Ag nanoflakes is about 1.21, 35.2 and 38.6 μm with PVP-K = 30, 60 and 90, respectively. As the chain length of PVP-K30 is shorter than PVP-K60 and -K90, the resultant Ag nanoflakes have a smaller lateral dimension, see Fig. 3a. Also, there are many spherical Ag particles with PVP-K = 30 and some irregular particles with PVP-K = 90, see Fig. 3a and c. The Ag nanoflakes grown with PVP-K = 60 mainly have triangular and hexagonal shapes, see Fig. 3b, while those grown with PVP-K = 90 have triangular, hexagonal and enneagonal shapes, see Fig. 3c. The formation of the spherical Ag particles is due to a complete coverage of the Ag seed planes with excess PVP-K = 30 molecules, while that of the irregular particles is caused by the self-nucleation of Ag with less PVP-K = 90 molecules; the causes of these phenomena will be discussed below. The above results indicate that the PVP polymerization degree affects both the size and the shape of the Ag nanoflakes.
O with a lone pair of electrons can easily coordinate with Ag and play a key role in determining the size and morphology of the Ag nanoflakes. PVP is also a weak reductant because of the relatively strong electronegativity of O and N atoms of the lactam group,39 in which the electron cloud will tend towards the O atom in carbonyl group and the carbonyl-linked N atom. This weak reducing power can maintain the free Ag atoms in the reaction system at a consistently low concentration, facilitating the growth of the Ag atoms in a hexagonal closely packing way, which is the reason for the formation of stacking faults in the Ag seed crystals. Fig. 3 shows the FESEM images of the Ag nanoflakes grown with different PVP polymerization degrees (with the same mass content in the reaction systems). One can see that the size of the Ag nanoflakes increases with an increase in the PVP polymerization degree, and that the average size of the Ag nanoflakes is about 1.21, 35.2 and 38.6 μm with PVP-K = 30, 60 and 90, respectively. As the chain length of PVP-K30 is shorter than PVP-K60 and -K90, the resultant Ag nanoflakes have a smaller lateral dimension, see Fig. 3a. Also, there are many spherical Ag particles with PVP-K = 30 and some irregular particles with PVP-K = 90, see Fig. 3a and c. The Ag nanoflakes grown with PVP-K = 60 mainly have triangular and hexagonal shapes, see Fig. 3b, while those grown with PVP-K = 90 have triangular, hexagonal and enneagonal shapes, see Fig. 3c. The formation of the spherical Ag particles is due to a complete coverage of the Ag seed planes with excess PVP-K = 30 molecules, while that of the irregular particles is caused by the self-nucleation of Ag with less PVP-K = 90 molecules; the causes of these phenomena will be discussed below. The above results indicate that the PVP polymerization degree affects both the size and the shape of the Ag nanoflakes.
The influence of the amount of PVP-K = 60 on the size of the Ag nanoflakes was further studied. Fig. S2† shows FESEM images of Ag nanoflakes with different PVP-K = 60 concentrations. One can see that the size of the Ag nanoflakes increases with increasing PVP-K = 60 concentration. There will be an excessive amount of Ag in the reaction system if the PVP concentration is too low (with the addition of 0.09 M), leading to the formation of irregular Ag nanoparticles due to the self-nucleation of free Ag, as shown in Fig. S2a.† However, if the PVP concentration is too high (with the addition of 0.63 M), all the Ag seed surfaces will be covered by the PVP, leading to the formation of spherical Ag nanoparticles due to isotropic growth, see Fig. S2g.† It was found that different sized Ag nanoflakes and small Ag nanoparticles can be obtained with a PVP-K60 concentration in the range of 0.18–0.36 M, see Fig. S2b–f.†
H+ concentration (CH+)
An Ag seed nucleus with a stacking fault structure is essential in the formation of Ag nanoflakes,35 and such seeds can be formed only under certain conditions, and if the reaction system contains an oxidation etchant, this will be unfavourable for the formation of Ag seeds with stacking faults. In this study, an Ag-oxalate complex was used as a precursor to effectively control the Ag ion concentration, which is beneficial for the kinetically controlled growth of the Ag nanoflakes. As a strong oxidant, HNO3 can be used to etch the high-energy planes of an Ag crystal nucleus with stacking faults, whose oxidability can be effectively adjusted by adding Na2C2O4. Since NO3− and H+ exist simultaneously in the reaction system, we can take H+ concentration as an indicator to describe the oxidation properties. Fig. 4 shows the FESEM images of the products with different H+ concentrations (different amounts of added Na2C2O4). Without Na2C2O4, the HNO3 concentration is high, and the CH+ is about 50 mM. In this case there will be a large number of Ag seeds with stacking faults, resulting in the formation of Ag nanoflakes with a very high content of irregular Ag nanoparticles, see Fig. 4a. With the addition of 0.25 mol Na2C2O4, the CH+ becomes 33.3 mM, and the quantity of Ag nanoflakes with regular shapes increases considerably because of the reduced etching ability of HNO3, see Fig. 4b. When the amount of Na2C2O4 added is 0.5 mol, the CH+ reduces to 16.7 mM, and the resultant Ag nanoflakes have regular shapes with very few Ag nanoparticulates, see Fig. 4c. When only Na2C2O4 is used without HNO3, the CH+ is zero, and the product consists of only Ag nanoparticles, see Fig. 4d. These results demonstrate that both too low and too high a H+ concentration will result in the formation of Ag nanoparticles, and the highest yield of Ag nanoflakes can be achieved with a H+ concentration of about 16.7 mM.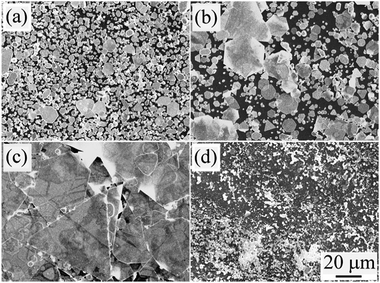 | ||
| Fig. 4 FESEM images of the Ag nanoflakes at a H+ concentration of (a) 50, (b) 33.3, (c) 16.7 and (d) 0 mM. | ||
Reaction temperature
At room temperature, Ag2C2O4 is very stable, and the Ag+ cannot be reduced because of the very weak reducing power of PVP. Applying a certain temperature to promote the decomposition of Ag2C2O4 and the reduction of Ag+ is indispensable. Fig. S3† shows the FESEM images of the products after reaction at different temperatures. One can see that the size of the product firstly increases, reaches a maximum value, and then decreases with an increasing temperature. The optimal temperature is 130 °C, at which the product consists almost completely of Ag nanoflakes with a nearly uniform size. No Ag2C2O4 decomposition occurs at a temperature of 100 °C, so the product is still Ag2C2O4, see Fig. S3a and g.† The thermal energy at a temperature of 110 °C is still not high enough to decompose Ag2C2O4 at a reasonable rate, and the product consists of a small amount of Ag nanoflakes and a large quantity of irregular Ag nanoparticles, see Fig. S3b and g.† The amount of irregular Ag nanoparticles decreases and the amount of Ag nanoflakes increases substantially with increasing temperature (Fig. S3c†), and at a temperature of 130 °C, the product almost completely consists of nanoflakes, see Fig. S3d and g.† But if the temperature is over 130 °C, spherical Ag nanoparticles will appear, and their amount increases with an increasing temperature, see Fig. S3e and f.†The formation of the Ag nanoflakes depends on the concentration of Ag+ in the system. At a low temperature the concentration of Ag+ is relatively low, and thus the content of Ag nanoflakes in the product is low. On the other hand, low temperatures will favour the formation of the Ag crystal nuclei with multilayer stacking faults, and the Ag nanoflakes will have a high thickness. At a low Ag+ concentration, some of the Ag crystal nuclei will be completely covered by PVP, leading to the formation of irregular Ag nanoparticles. At a temperature of 130 °C, the thermal decomposition rate of Ag2C2O4 is optimal, and thus the products are all Ag nanoflakes. At temperatures higher than 130 °C, the decomposition rate of Ag2C2O4 is very fast, and Ag+ will quickly transform to Ag, resulting in the formation of spherical Ag nanoparticles.
Reaction time
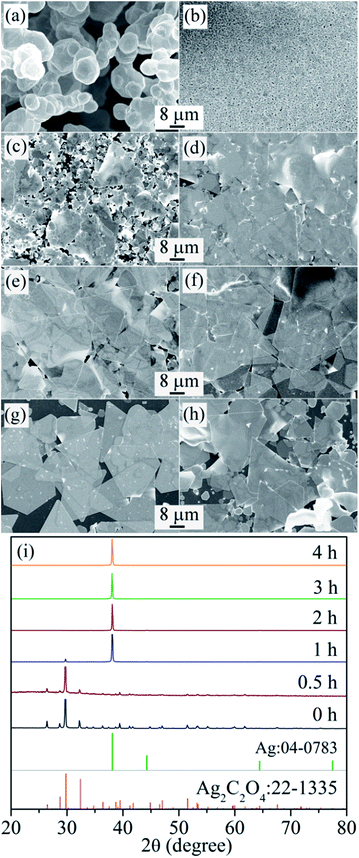
Fig. 5 shows the FESEM images of the products after reaction for different times. The initial white precipitation shown in Fig. 5a is Ag2C2O4, as proven by the corresponding XRD analysis shown in Fig. 5i, in which the diffraction peak can be indexed to monoclinic Ag2C2O4 (JCPDS card no. 22-1335) without the presence of other phases, indicating that the metallic silver exists in the form of Ag-oxalate. After reaction for 0.5 and 1 h, the Ag2C2O4 began to decompose slowly, the amount of Ag2C2O4 decreased, and there were some flake-like products, as shown in Fig. 5b and c, with the corresponding XRD patterns showing a reduced peak intensity from the Ag2C2O4 signal and an increased peak intensity from the FCC Ag signal. When the reaction time was increased to 2 h, the product mainly consisted of Ag nanoflakes without the presence of Ag2C2O4, as shown in Fig. 5d and i. With a further increase in reaction time to 3 h and above, the products are Ag nanoflakes, and their size increases with increasing reaction time, as shown in Fig. 5e–g. After further increases in reaction time to 8 h, there are no changes in either the size or thickness of the Ag nanoflakes, indicating that the entire Ag source has been consumed.Based on the above analysis, one can see that a large output of Ag nanoflakes can be realized under carefully controlled hydrothermal conditions. To verify this, the mass of PVP-K60, AgNO3, H2C2O4 and Na2C2O4 reactants were respectively increased to 12 g, 2.55 g, 409.5 mg and 569.5 mg, and the volume of deionized water was fixed at 390 mL. After hydrothermal reaction at 130 °C for 10 h, the total output of the Ag nanoflakes was about 1.5 g, as shown in Fig. S4,† which is about 10 times larger than that shown in Fig. 3b. From Fig. S4† one also can see that the Ag nanoflakes have a high aspect ratio, despite their different shapes. The maximum size of the Ag nanoflakes is about 60 μm with a thickness of about 75.5 nm and an aspect ratio of about 800. This result demonstrates that even a large-scale production of Ag nanoflakes can be implemented by further increasing the amount of the reactants.
Based on the above discussions, the growth mechanism of the Ag nanoflakes can be summarised as follows. Firstly, during the initial stage, Ag twin seeds with stacking faults were formed in an aqueous colloidal system of PVP under hydrothermal conditions, which is essential for the growth of the Ag nanoflakes. Following this, these twin seeds gradually grew into small Ag nanoflakes under the induction of PVP, and the Ag atoms continuously moved onto the nucleation sites with reentrant groove structures which facilitated subsequent lateral crystal growth. Meanwhile, the Ag flakes also grew along the longitudinal direction, but their growth rate in this direction was much slower than in the lateral direction. Finally, Ag nanoflakes with a lateral size of several tens of micrometers and aspect ratios of several hundred were formed. It is worth noting that Ag nanoflakes with a regular hexagonal shape are the main products in a uniform, closed and stable experimental environment, while Ag nanoflakes of different shapes will be formed under unstable hydrothermal conditions.
Due to its optimal electrical and thermal conductivity as well as its excellent chemical stability, metal Ag has been widely used as a conductive phase in conductive pastes. Currently the conductive fillers in commercial Ag conductive pastes are mostly granular Ag obtained mainly by a ball-milling method. The conductivity of a granular Ag conductive phase is generally low because of the point contact between Ag particles, and the electronic channels between Ag particles are narrow, thereby affecting electron transportation and the electrical conductivity. A poor crystallinity and the adherence of certain dispersants to the surface of Ag particles also have a great impact on the conductivity of the Ag conductive pastes. On the other hand, the two dimensional Ag single crystalline nanoflakes with a large surface area will have both linear and face-to-face contact, leading to a high conductivity if used as conductive fillers in commercial Ag pastes. Ag nanowires have been frequently used to build flexible film heaters,41–44 and it has been found that there is fusing of the wire-to-wire junctions; as a result, pre-treatment of the Ag nanowires is needed before use. Ag nanoflakes have a high conductivity and could also be excellent fillers in the construction of flexible film heaters. In the following paragraphs, we will study the thermal properties and conductivity of the Ag nanoflakes.
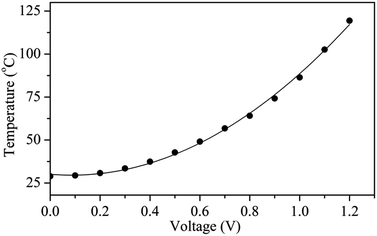
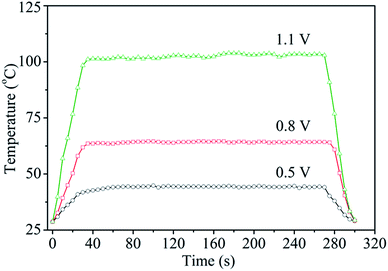
Fig. 6 shows the surface temperature of a Ag nanoflake film heater (Rs = 1.1 Ω sq−1) operated at different input voltages. The heater was fabricated by drop-casting a Ag nanoflake ethanol solution with a size of 25–40 μm onto a PET substrate without the addition of an adhesion agent. It was found that the nanoflakes have excellent bonding between themselves after annealing at 180 °C for 0.5 h in air. The input voltages were supplied to the heater through two electrodes on the edges of the Ag nanoflake film. From Fig. 6 one can clearly see that the heating temperature non-linearly increases with an increasing input voltage (with the fitting function of T = 30.1 − 12V + 70.6V2), which is in accordance with the previous reports.45,46 Fig. 7 shows the temperature profiles of the Ag nanoflake heater operated at different voltages. One can see that the temperature increases rapidly and reaches its saturation values within 30 s; the higher the input voltage the higher the temperature. The temperature at 1.1 V can reach as high as about 100 °C, which is much higher than that of the Ag nanowire heaters reported in the literature.41,42,44 Infrared photography of the film heater at a constant input voltage (Fig. S5†) clearly revealed that the temperature distribution on the film area was uniform, and that the temperature is about 43.1 and 62.8 °C at a voltage of 0.5 and 0.8 V, respectively. Cyclic temperature testing confirmed that the Ag nanoflake heater has a high thermal stability, and no fusing phenomenon was observed on the flake-to-flake junctions (Fig. S6†). The heat power is affected by the bias and the resistance of the heater, and due to the direct formation of a face-to-face contact conductive network between the Ag nanoflakes, the square resistance of the Ag nanoflake film heater is very low, only about 1.1 Ω sq−1, and thus the temperature of the Ag nanoflake film heater is higher than that of the Ag nanowire/PVP film heater at the same input voltage.41
Ag nanoflakes with a size of 5–10, 10–25 and 25–40 μm were mixed with a commercial Ag particle paste with a 1![[thin space (1/6-em)]](https://www.rsc.org/images/entities/char_2009.gif) :
:![[thin space (1/6-em)]](https://www.rsc.org/images/entities/char_2009.gif) 7 mass ratio of nanoflake/particle, forming a hybrid Ag paste. Fractions of Ag nanoflakes of different sizes were isolated using ethanol-induced precipitation with the aid of ultrasound. Fig. 8 shows the volume resistance of the hybrid Ag pastes together with the original Ag paste. One can see that the resistance decreases as the size of the Ag nanoflakes increases, and the larger the size of the Ag nanoflakes, the lower the resistance, which is in good agreement with a previous report.33 The conductivity of the hybrid Ag paste increased by more than an order of magnitude with the addition of Ag nanoflakes. Nevertheless, if there is a porous structure after combining the Ag nanoparticles with the Ag flakes, the conductivity of the hybrid Ag paste will decrease with an increase in silver flake content.47 We have not observed this phenomenon, which provides further evidence that the Ag silver flakes prepared in this work are of high quality. A larger contact area and more electronic channels between the Ag nanoflakes are responsible for the reduced resistance. The bridging role of the Ag nanoflakes in the original Ag particles also contributes to the enhanced conductivity of the hybrid pastes. These results indicate that highly conductive Ag pastes can be achieved by simply adding a small amount of Ag nanoflakes into a commercial Ag paste. The optimal size and amount to be added need further optimization.
7 mass ratio of nanoflake/particle, forming a hybrid Ag paste. Fractions of Ag nanoflakes of different sizes were isolated using ethanol-induced precipitation with the aid of ultrasound. Fig. 8 shows the volume resistance of the hybrid Ag pastes together with the original Ag paste. One can see that the resistance decreases as the size of the Ag nanoflakes increases, and the larger the size of the Ag nanoflakes, the lower the resistance, which is in good agreement with a previous report.33 The conductivity of the hybrid Ag paste increased by more than an order of magnitude with the addition of Ag nanoflakes. Nevertheless, if there is a porous structure after combining the Ag nanoparticles with the Ag flakes, the conductivity of the hybrid Ag paste will decrease with an increase in silver flake content.47 We have not observed this phenomenon, which provides further evidence that the Ag silver flakes prepared in this work are of high quality. A larger contact area and more electronic channels between the Ag nanoflakes are responsible for the reduced resistance. The bridging role of the Ag nanoflakes in the original Ag particles also contributes to the enhanced conductivity of the hybrid pastes. These results indicate that highly conductive Ag pastes can be achieved by simply adding a small amount of Ag nanoflakes into a commercial Ag paste. The optimal size and amount to be added need further optimization.
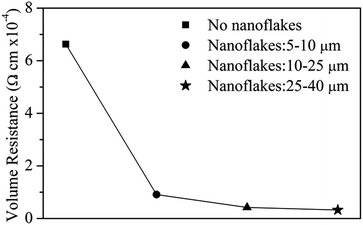 | ||
| Fig. 8 The volume resistivity of Ag conductive pastes without and with addition of Ag nanoflakes of different sizes. | ||
Conclusions
In conclusion, Ag nanoflakes with a size of 5–60 μm, thickness of 20–80 nm and aspect ratio of up to 800 have been synthesized via a simple hydrothermal method. The kinetic growth process of the Ag nanoflakes can be well controlled by introducing an oxalate compound in the form of Ag2C2O4, causing the slow release of Ag+ at a temperature of 130 °C. It was found that the polymerization degree and concentration of PVP, H+ concentration, reaction time and reaction temperature all affect the formation of the Ag nanoflakes, and that controlling the H+ concentration is essential in the formation of Ag crystal nuclei with a stacking fault. Our method takes advantage of PVP as both a capping agent to induce anisotropic growth of the Ag nanoflakes and as a reducing agent to reduce the Ag+ to Ag, and can be easily scaled up for mass production of the Ag nanoflakes. A large contact area with more electronic channels between the Ag nanoflakes means that the Ag nanoflakes are excellent conductive fillers for the fabrication of flexible film heaters and high conductivity pastes.Experimental section
Materials
Silver nitrate (AgNO3, 99%), sodium oxalate (Na2C2O4, 99.8%), oxalic acid (H2C2O4, 99.5%), polyvinylpyrrolidone (PVP, K30, K60, K90) and ethanol (99.7%) were purchased from Sinopharm Chemical Reagent Co. Ltd. All chemicals were of analytical grade and used as received without further purification. Silver conductive paste (70%) was purchased from PuQiang (Suzhou) Conductive Paints Co., Ltd. Triply distilled water (1.82 MΩ) was used in all experiments.Synthesis
In a typical synthesis process of the Ag nanoflakes, an aqueous solution of PVP-K60 (0.54 M, 20 mL), H2C2O4 (0.25 M, 1 mL), Na2C2O4 (0.25 M, 1 mL) and AgNO3 (0.5 M, 3 mL) was firstly mixed in a glass beaker and stirred for half an hour; the obtained suspended-precipitate solution was then poured into a 50 mL Teflon-lined autoclave container. The Teflon container was sealed and kept at 130 °C in an oven for 3 h. Finally, the products were obtained by centrifuging the final reaction solution, and washed with ethanol and/or water 4 times at a centrifugal speed of 1500 rpm for 5 min, and dried at 60 °C. The nanoflakes were dispersed in ethanol for storage.Characterization
The morphology and size of the products were characterized using field-emission scanning electron microscopy (FESEM, Sirion 200) and atomic force microscopy (AFM, Innova). The structure and the crystalline phases were analyzed using transmission electron microscopy (TEM, JEOL Model 2010) and X-ray diffraction with a Cu Kα line (XRD, Philips X’Pert). The resistance of conductive paste was measured with a 4 points method using a Keithley digital source meter (2612A). The surface temperature of the heater was monitored using an infrared radiation thermometer (TES-1310). Infrared photographs of the heater were taken at a constant input voltage with an IR-Fusion Thermal Imager (Ti200).Conflicts of interest
There are no conflicts to declare.Acknowledgements
This work was financially supported by the National Basic Research Program of China (Grant no. 2013CB934304) and in part by Yantai Shied Advanced Materials Co., LTD.Notes and references
- E. Borsella, E. Cattaruzza, G. De Marchi, F. Gonella, G. Mattei, P. Mazzoldi, A. Quaranta, G. Battaglin and R. Polloni, J. Non-Cryst. Solids, 1999, 245, 122–128 CrossRef CAS.
- S. H. Jeong, H. Choi, J. Y. Kim and T. W. Lee, Part. Part. Syst. Charact., 2015, 32, 164–175 CrossRef CAS.
- K. Kim, K. Hong, B. Koo, I. Lee and J. L. Lee, Appl. Phys. Lett., 2013, 102, 3511–3514 Search PubMed.
- B. Park, I. G. Bae and Y. H. Huh, Sci. Rep., 2016, 6, 19485 CrossRef CAS PubMed.
- J. A. Suarez, J. J. Plata, A. M. Marquez and J. F. Sanz, Theor. Chem. Acc., 2016, 135, 1–8 CrossRef CAS.
- F. Hajakbari and F. Shafieinejad, Jpn. J. Appl. Phys., 2016, 55, 035503 CrossRef.
- C. H. Zhu, G. W. Meng, P. Zheng, Q. Huang, Z. B. Li, X. Y. Hu, X. J. Wang, Z. L. Huang, F. D. Li and N. Q. Wu, Adv. Mater., 2016, 28, 4871–4876 CrossRef CAS PubMed.
- Y. Xie, M. Zhao, Q. Hu, Y. Cheng, Y. Guo, H. Qian and W. Yao, J. Raman Spectrosc., 2017, 48, 204–210 CrossRef CAS.
- H. B. Tang, P. Zheng, G. W. Meng, Z. B. Li, C. H. Zhu, F. M. Han, Y. Ke, Z. M. Wang, F. Zhou and N. Q. Wu, Nanotechnology, 2016, 27, 325303–325317 CrossRef PubMed.
- Z. B. Li, G. W. Meng, Q. Huang, C. H. Zhu, Z. Zhang and X. D. Li, Chem.–Eur. J., 2012, 18, 14948–14953 CrossRef CAS PubMed.
- E. L. Holthoff, D. N. Stratis-Cullum and M. E. Hankus, Sensors, 2011, 11, 2700–2714 CrossRef CAS PubMed.
- H. J. Jiang, K. S. Moon, Y. Li and C. P. Wong, Chem. Mater., 2006, 18, 2969–2973 CrossRef CAS.
- H. W. Cui, Q. Fan and D. S. Li, Int. J. Adhes. Adhes., 2014, 48, 177–182 CrossRef CAS.
- R. W. Zhang, W. Lin, K. Lawrence and C. P. Wong, Int. J. Adhes. Adhes., 2010, 30, 403–407 CrossRef CAS.
- Y. H. Ji, Y. Liu, G. W. Huang, X. J. Shen, H. M. Xiao and S. Y. Fu, ACS Appl. Mater. Interfaces, 2015, 7, 8041–8052 CAS.
- H. M. Ren, Y. Guo, S. Y. Huang, K. Zhang, M. M. F. Yuen, X. Z. Fu, S. H. Yu, R. Sun and C. P. Wong, ACS Appl. Mater. Interfaces, 2015, 7, 13685–13692 CAS.
- S. Kiruthika, R. Gupta and G. U. Kulkarni, RSC Adv., 2014, 4, 49745–49751 RSC.
- P. H. Wang, S. P. Chen, C. H. Su and Y. C. Liao, RSC Adv., 2015, 5, 98412–98418 RSC.
- K. D. Kim, K. Y. Choi and H. T. Kim, Scr. Mater., 2005, 53, 571–575 CrossRef CAS.
- Y. G. Sun, Y. D. Yin, B. T. Mayers, T. Herricks and Y. N. Xia, Chem. Mater., 2002, 14, 4736–4745 CrossRef CAS.
- M. Luo, H. W. Huang, S. I. Choi, C. Zhang, R. R. da Silva, H. C. Peng, Z. Y. Li, J. Y. Liu, Z. K. He and Y. N. Xia, ACS Nano, 2015, 9, 10523–10532 CrossRef CAS PubMed.
- Y. Wang, Y. Q. Zheng, C. Z. Huang and Y. N. Xia, J. Am. Chem. Soc., 2013, 135, 1941–1951 CrossRef CAS PubMed.
- X. X. Liu, L. L. Li, Y. D. Yang, Y. D. Yin and C. B. Gao, Nanoscale, 2014, 6, 4513–4516 RSC.
- Q. Y. Li, S. C. Liu, S. R. Li, W. H. Guo and C. F. Wu, J. Mater. Sci.: Mater. Electron., 2016, 27, 452–457 CrossRef CAS.
- H. Wang, H. Wu, L. Zhong, J. Zhao and G. Li, J. Electrochem. Soc., 2017, 164, D225–D229 CrossRef CAS.
- L. P. Jiang, S. Xu, J. M. Zhu, J. R. Zhang, J. J. Zhu and H. Y. Chen, Inorg. Chem., 2004, 43, 5877–5883 CrossRef CAS PubMed.
- D. P. Chen, X. G. Zhu, G. Zhu, X. L. Qiao and J. G. Chen, J. Mater. Sci.: Mater. Electron., 2012, 23, 625–630 CrossRef CAS.
- A. X. Zhai, X. H. Cai and B. Du, Trans. Nonferrous Met. Soc. China, 2014, 24, 1452–1457 CrossRef CAS.
- R. C. Jin, Y. W. Cao, C. A. Mirkin, K. L. Kelly, G. C. Schatz and J. G. Zheng, Science, 2001, 294, 1901–1903 CrossRef CAS PubMed.
- H. Chen, F. Simon and A. Eychmuller, J. Phys. Chem. C, 2010, 114, 4495–4501 CAS.
- H. Z. Liang, D. J. Kim, H. S. Chung, J. Zhang, K. N. Yu, S. H. Li and R. X. Li, Acta Phys.-Chim. Sin., 2003, 19, 150–153 CAS.
- Z. Deng, M. Mansuipur and A. J. Musca, J. Phys. Chem. C, 2009, 113, 867–873 CAS.
- Y. M. Park, B. G. Lee, J.-I. Weon and M. H. Kim, RSC Adv., 2016, 6, 95768–95773 RSC.
- D. Aherne, D. M. Ledwith, M. Gara and J. M. Kelly, Adv. Funct. Mater., 2008, 18, 2005–2016 CrossRef CAS.
- V. Germain, J. Li, D. Ingert, Z. L. Wang and M. P. Pileni, J. Phys. Chem. B, 2003, 107, 8717–8720 CrossRef CAS.
- J. L. Song, Y. Chu, Y. Liu, L. L. Li and W. D. Sun, Chem. Commun., 2008, 1223–1225 RSC.
- K. M. Koczkur, S. Mourdikoudis, L. Polavarapu and S. E. Skrabalak, Dalton Trans., 2015, 44, 17883–17905 RSC.
- M. H. Kim, D. K. Yoon and S. H. Im, RSC Adv., 2015, 5, 14266–14272 RSC.
- Y. J. Xiong, I. Washio, J. Y. Chen, H. G. Cai, Z. Y. Li and Y. N. Xia, Langmuir, 2006, 22, 8563–8570 CrossRef CAS PubMed.
- C. S. Wang, C. X. Kan, J. J. Zhu, X. L. Zeng, X. F. Wang, H. C. Li and D. N. Shi, J. Nanomater., 2010, 1, 139–143 Search PubMed.
- W. Lan, Y. X. Chen, Z. W. Yang, W. H. Han, J. Y. Zhou, Y. Zhang, J. Y. Wang, G. M. Tang, Y. P. Wei, W. Dou, Q. Su and E. Q. Xie, ACS Appl. Mater. Interfaces, 2017, 9, 6644–6651 CAS.
- K. H. Pyo and J. W. Kim, Compos. Sci. Technol., 2016, 133, 7–14 CrossRef CAS.
- M. Li, S. L. Ji, J. Pan, H. Wu, L. Zhong, Q. Wang, F. D. Li and G. H. Li, J. Mater. Chem. A, 2014, 2, 20470–20473 CAS.
- R. Gupta, K. D. M. Rao, S. Kiruthika and G. U. Kulkarni, ACS Appl. Mater. Interfaces, 2016, 8, 12559–12575 CAS.
- Q. J. Huang, W. F. Shen, X. Z. Fang, G. F. Chen, J. C. Guo, W. Xu, R. Q. Tan and W. J. Song, RSC Adv., 2015, 5, 45836–45842 RSC.
- J. P. Li, J. J. Liang, X. Jian, W. Hu, J. Li and Q. B. Pei, Macromol. Mater. Eng., 2014, 299, 1403–1409 CrossRef CAS.
- B. G. Park, K. H. Jung and S. B. Jung, J. Alloys Compd., 2017, 699, 1186–1191 CrossRef CAS.
Footnote |
| † Electronic supplementary information (ESI) available. See DOI: 10.1039/c7ra11937b |
| This journal is © The Royal Society of Chemistry 2018 |

