
 Open Access Article
 This Open Access Article is licensed under a Creative Commons Attribution-Non Commercial 3.0 Unported Licence
Metabolite identification of ursolic acid in mouse plasma and urine after oral administration by ultra-high performance liquid chromatography/quadrupole time-of-flight mass spectrometry†
Xueyan Hu,
Yunbing Shen,
Shengnan Yang,
Wei Lei,
Cheng Luo,
Yuanyuan Hou * and
Gang Bai*
* and
Gang Bai*
State Key Laboratory of Medicinal Chemical Biology, College of Pharmacy, Tianjin Key Laboratory of Molecular Drug Research, Nankai University, Tianjin 300350, China. E-mail: houyy@nankai.edu.cn; gangbai@nankai.edu.cn
First published on 8th February 2018
Abstract
Ursolic acid (UA), a pentacyclic terpenoid carboxylic acid widely existing in various medicinal plants, has been reported to have multifarious biological activities such as anti-inflammatory, anticancer and antioxidant activities. In this paper, we analyzed the metabolic profile of UA in mice (including plasma and urine) by using ultra-high performance liquid chromatography (UPLC) coupled with a quadrupole time-of-flight (Q/TOF) method. Principal component analysis (PCA) was applied to differentiate the control and experimental groups. Potential biomarkers were filtered by using loading plots followed by further analysis with UPLC-Q/TOF-MS data. The results showed that 3 metabolites in plasma were identified as markers, one of which was UA and the others were UA epoxides, which belonged to phase I metabolites. Additionally, 5 phase II metabolites were tentatively identified in urine through an accurate mass and characteristic fragment ions. These data suggested that the biotransformation of UA undergoes the major metabolic reactions of the phase I metabolic route of olefin oxidation and phase II metabolic routes of glycine conjugation, glutathione conjugation and glucuronidation. This is the first report of analysis and characterization of the metabolites after the oral administration of UA in mice. The proposed metabolic pathways of UA in mice is also raised for the first time. It might provide further understanding of the potential biological mechanism of UA.
1. Introduction
Ursolic acid (UA) is a naturally derived pentacyclic triterpene acid, which exists widely in various medicinal herbs such as Eriobotrya japonica, Rosmarinus officinalis and Eugenia jambolana as well as in apples, pears, prunes and other fruits.1,2 It is reported that UA has numerous biological activities, such as antioxidant, anti-inflammatory, anti-allergy, antibacterial, antiprotozoal, antiviral, antimutagenicity, hepatoprotective and anticancer activities.3–6 It is noteworthy that UA exhibits powerful anticancer properties against various kinds of cancer, such as breast cancer.7–9 Some studies have showed that UA could decrease tumor cell proliferation in a postmenopausal breast cancer mouse model by modulating glucocorticoid receptor (GR) and Akt/mTOR signaling along with inducing apoptosis.10,11Recently, liquid chromatography coupled with mass spectrometry (LC-MS) is an effective technique for qualitative and quantitative analysis of drug metabolites in various biological samples.12–14 Among the various LC-MS instruments, UPLC-Q/TOF-MS is a reliable and efficient technique for complex samples due to its high detection sensitivity and accuracy.15–18 MSE (where E represents the collision energy) is a tandem mass spectrometry method that obtains highly accurate parent ion and fragment ion information. The strategy of UPLC-Q/TOF-MSE provides a high resolution, high selectivity, and sensitive analysis of components in endogenous and exogenous metabolic compositions of different biological samples.19–21
Multivariate statistical analysis (MVA), such as principal component analysis (PCA) and partial least squares-discriminant analysis (PLS-DA) can be used for the classification of samples into predefined groups such as treated and untreated individuals. Recently, LC-MS method combined with MVA was performed for investigating the different marker components and their chemical structures to explain the subtle differences between samples, and the markers were identified accordingly.22–24 This method has been used to study the component differences among the urinary metabolites of adenine-induced CRF rats.25 It has also been used for the metabonomic study of animals and clinical diseases.19,22
Up until now, there were few studies focused on the metabolism of UA in mice. In our present research, a reliable and rapid method based on UPLC-Q/TOF-MS technique was established and applied to study the proposed metabolic profile of UA. This work may lay a foundation for the further development and utilization of UA and its metabolites.
2. Materials and method
2.1 Materials and reagents
Ursolic acid (>98% purity, Fig. 1) was purchased from Energy Chemical (Shanghai, China). Acetonitrile and methanol at UPLC-grade were purchased from Merck (Darmstadt, Germany). Deionized water was prepared by Milli-Q system (Millipore, Bedford, MA, USA). meta-Chloroperoxybenzoic acid (mCPBA) was purchased from Innochem (Beijing, China). Deuterated pyridine (pyridine-d5, 99.5 atom% D) was purchased from Armar Chemicals (Döttingen, Switzerland). All other reagents and chemicals were analytical purity and provided from Concord Technology (Tianjin, China).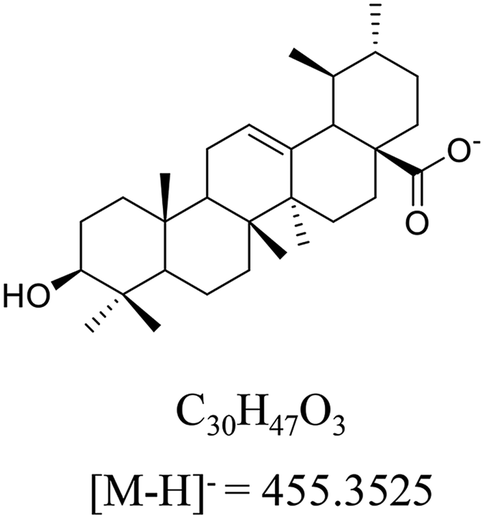 | ||
| Fig. 1 The structure, formula and monoisotopic mass of ursolic acid (UA) in negative ion mode. | ||
2.2 Animals, dosing, and sample collection
Twenty-four male Kunming mice (weighing 20–25 g) were supplied by the Laboratory Animal Center of the Academy of Military Medical Sciences (SCXK 2012-0004, Beijing, China) and housed under the laboratory conditions (20–22 °C, 50–60% relative humidity, and 12 h photoperiod) for 7 days. All mice were fasted 12 h before the experiment. The mice were randomly split into an experimental group (n = 12) and control group (n = 12). Experimental group was dosing with UA saline solution in a single dose of 30 mg kg−1 bodyweight. An equivalent amount of saline water without UA was given to the control group. Animal experiments were approved by the Animal Ethics Committee, Nankai University (Tianjin, China) and performed in accordance with the guidelines of China national legislation.2.3 Biological sample collection
The posterior orbital venous plexus approach was applied to collect blood samples (n = 6) after dosing with UA preparation and blank samples (n = 6) into 1.5 mL heparinized Eppendorf centrifuge tubes. After centrifugation at 3000 rpm for 10 min at 4 °C, the supernatant was separated and stored at −80 °C super cold refrigerator until analysis.For the collection of mouse urine samples, mice given the drugs (n = 6) or normal saline solution (n = 6) were housed in metabolic cages. After centrifugation at 3000 rpm for 10 min at 4 °C, the supernatant was separated and stored at −80 °C super cold refrigerator until analysis. During the collection, ice packs were used to keep the urine sample fresh. The urine collection experiment was repeated three times, with each time interval at least three days.
2.4 Sample pretreatment
Proteins were removed from the plasma samples by a precipitation method with methanol (1![[thin space (1/6-em)]](https://www.rsc.org/images/entities/char_2009.gif) :3, v/v). The liquid mixture was vortexed for 3 min and centrifugated at 12000 rpm for 10 min at 4 °C, followed by the supernatants transferred to another tube. Then the supernatants were concentrated to dry at 25 °C under nitrogen flow. The residue was reconstituted with methanol, followed by vortexing for 3 min at 4 °C and centrifuging for 10 min at a speed of 12000 rpm.
:3, v/v). The liquid mixture was vortexed for 3 min and centrifugated at 12000 rpm for 10 min at 4 °C, followed by the supernatants transferred to another tube. Then the supernatants were concentrated to dry at 25 °C under nitrogen flow. The residue was reconstituted with methanol, followed by vortexing for 3 min at 4 °C and centrifuging for 10 min at a speed of 12000 rpm.
A 1 mL aliquot of urine was vortexed for 1 min. Next, 8 mL of ethyl acetate was added, followed by vortexing for 3 min and centrifuging for 10 min at a speed of 3000 rpm at 4 °C. Then the supernatants were concentrated to dry at 25 °C under nitrogen flow and 200 μL of methanol was used to redissolve the dry residues.
2.5 Chromatography and mass spectrometry conditions
Separations were conducted on an Acquity BEH C18 column (2.1 × 100 mm, 1.7 μm; Waters, USA) of a UPLC System (Waters Corp., USA). The column was eluted with water 0.1% formic acid in water (A) and acetonitrile (B). A gradient program was set as follows: 0–13 min, linear from 2% to 30% B; 13–16 min, linear from 30% to 50% B; 16–25 min, linear from 50% to 80% B; and 25–30 min, linear from 80% to 100% B, with 2 min back to the initial concentration, and the column was equilibrated for 5 min. 5 μL sample was injected to the system and the flow rate was 0.4 mL min−1.Detection was carried out using a Xevo™ G2 QTOF (Waters Corp., Milford, MA, USA) incorporated with electrospray ionization (ESI) interface. The resolution of MS was 50000. The desolvation gas flow was set to 750 L h−1 at 350 °C, and the cone gas flow was 30 L h−1. The source temperature was maintained at 120 °C. Data were acquired from 100 Da to 1500 Da in a centroid mode. In MSE mode, the parameters were set as follows: 0 eV was set for the trap collision energy and 30–50 eV was set for the ramp trap collision energy. Waters MassLynx™ v4.1 software (Waters Corp., Milford, MA, USA) was used for data acquisition and analyses. MetaboLynx function module within MassLynx software was applied for post-acquisition data processing.
2.6 Multivariate statistical analysis
In order to identify the marker components among the various mouse plasma samples, LC-MS method combined with PCA has been utilized successfully. The data acquired were imported to MarkerLynx function module within MassLynx software, followed by the retention time, parent and fragment ions data were determined. The parameters were set as follows: the time was 0–30 min; the mass defect filter was ±40 mDa; and mass tolerance was 0.05 Da. The results data obtained were further analyzed by using SIMCA-P software (version 13.0, UmetricsAB, Sweden).2.7 Analytical strategy
MetaboLynx was used for metabolite identification by the collecting data through MSE acquisition. It adopts a broad list of underlying biotransformation reactions such as hydroxylation and methylation and combines with the elemental compositions of the substrate molecules. MSE could help determine the parent–child ion association by providing the parent ion and fragment ion information.The markers identification was carried out by contrasting with the reference standards. MassLynx was an essential tool to analyze the MS2 fragment ion. The analyzing results was then submitted to database for further study, including the online ChemSpider database (http://www.chemspider.com), Mass Bank (http://www.massbank.jp/), METLIN (http://metlin.scripps.edu/), or Human Metabolome Database (HMDB, http://www.hmdb.ca/) data source.
2.8 Preparative synthesis and isolation of compound 1
UA (228 mg, 0.5 mmol) was dissolved in dichloromethane (5 mL), followed by the dropwise addition of meta-chloroperoxybenzoic acid (mCPBA, 1.3 mmol) at 0 °C. Then, the mixture was warmed to room temperature and stirred for 6 h. Then the mixture was filtered, and the filtrate was successively washed with solutions of Na2S2O3 (5%, 3 × 10 mL) and saturated brine (3 × 10 mL). Anhydrous Na2SO4 was used to dry the organic layer, followed by filtration, and concentration. The residue obtained was separated with column chromatography on silica gel and eluted with dichloromethane/methanol (120:1 to 80:1) to give the epoxide of UA as a white solid (151 mg, 0.32 mmol, 64%).
3. Results
3.1 MVA of the UPLC-Q/TOF-MS data
To distinguish different plasma samples, both the positive and negative ion mode data were used for overall analysis. The analysis results of the positive mode exhibited no significant distinction between the plasma samples, while there was an obvious difference in negative mode. Fig. 2A shows the typical negative base peak intensity chromatogram (BPI) of the mouse plasma samples after the oral administration of UA. As shown in Fig. 2B, the samples were classified into two groups. Six blank plasma samples were bunched up, and six plasma samples after dosing with UA were clustered into another group. The loading plot exhibited the contributing rate of each ion (Fig. 2C). This is an intuitive way that can be used for the selection of the potential biomarkers.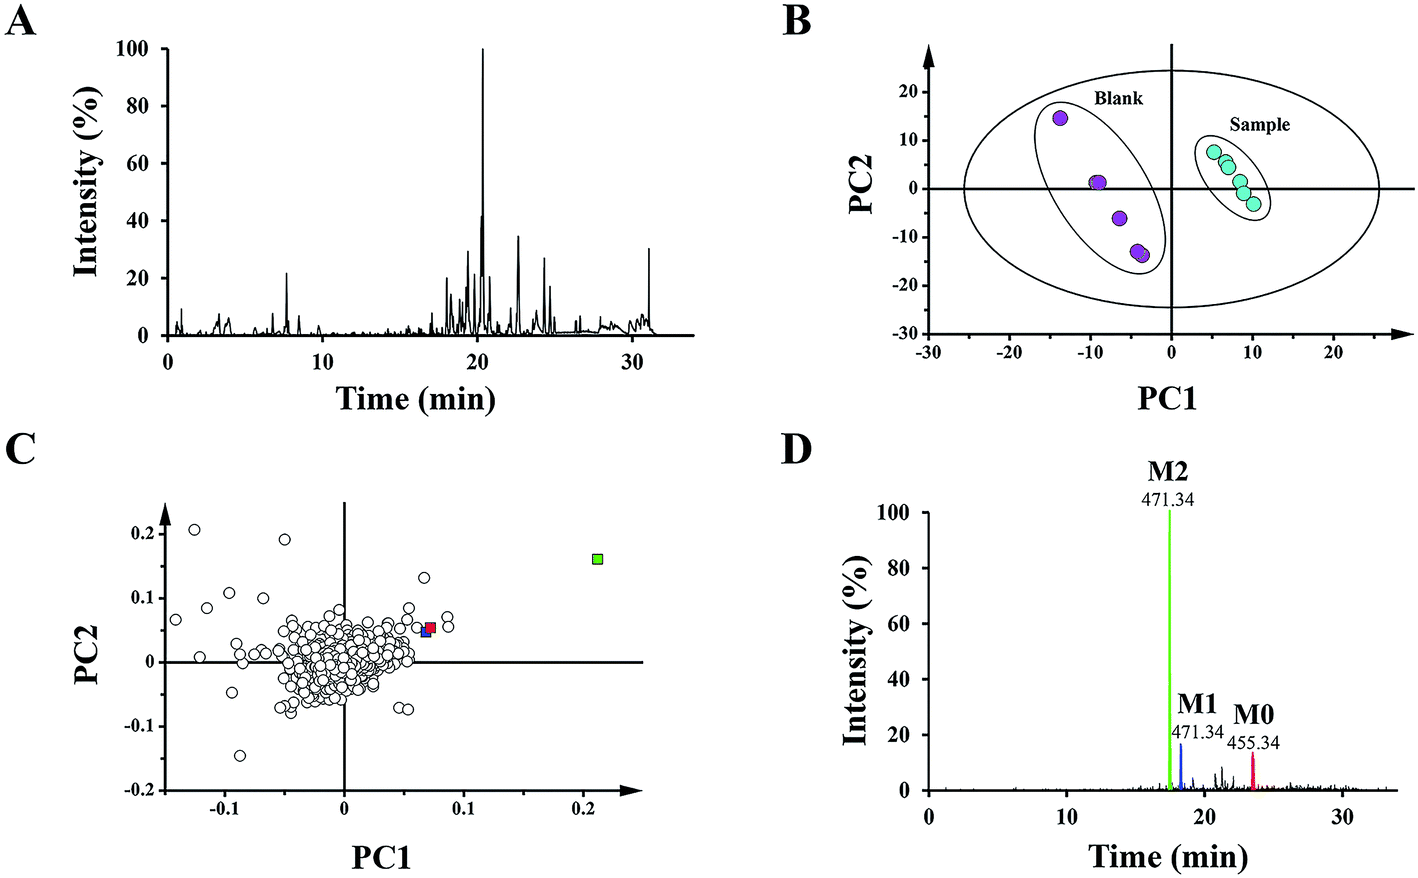 | ||
| Fig. 2 BPI, XICs and PCA of different mouse plasma samples. (A) Representative base peak intensity chromatogram (BPI) in the negative electrospray ionization (ESI) mode of plasma after the oral administration of UA. Score plots (B) and loading plots (C) of the principal component analysis (PCA) for the various samples of blank plasma and plasma after the oral administration of UA by UPLC-Q/TOF-MS in negative ESI mode. (D) Combination of the extracted ion chromatograms (XICs) of UA metabolites (M2, M1, and M0) in plasma. | ||
3.2 Biomarker elucidation
The 15 potential biomarkers were selected for further analysis due to their high variable importance (VIP) among a large amount of variables. The retention time and MSE data were used for the structure identification of the markers. HMBD, METLIN and other online databases was also used to identify the possible chemical constitutes.Based on the PCA analysis results, UPLC-Q/TOF-MS data and databases, 3 visible ions were considered to be marker candidates. The others all belonged to endogenous substances such as lysophosphatidylethanolamine (LysoPE) and its isomers. Fig. 2D shows the combination of the extracted ion chromatograms (XICs) of the 3 markers in plasma. Q/TOF-MS2 spectras of metabolite 1 (M1), metabolite 2 (M2), metabolite 0 (M0) are shown in Fig. 3A.
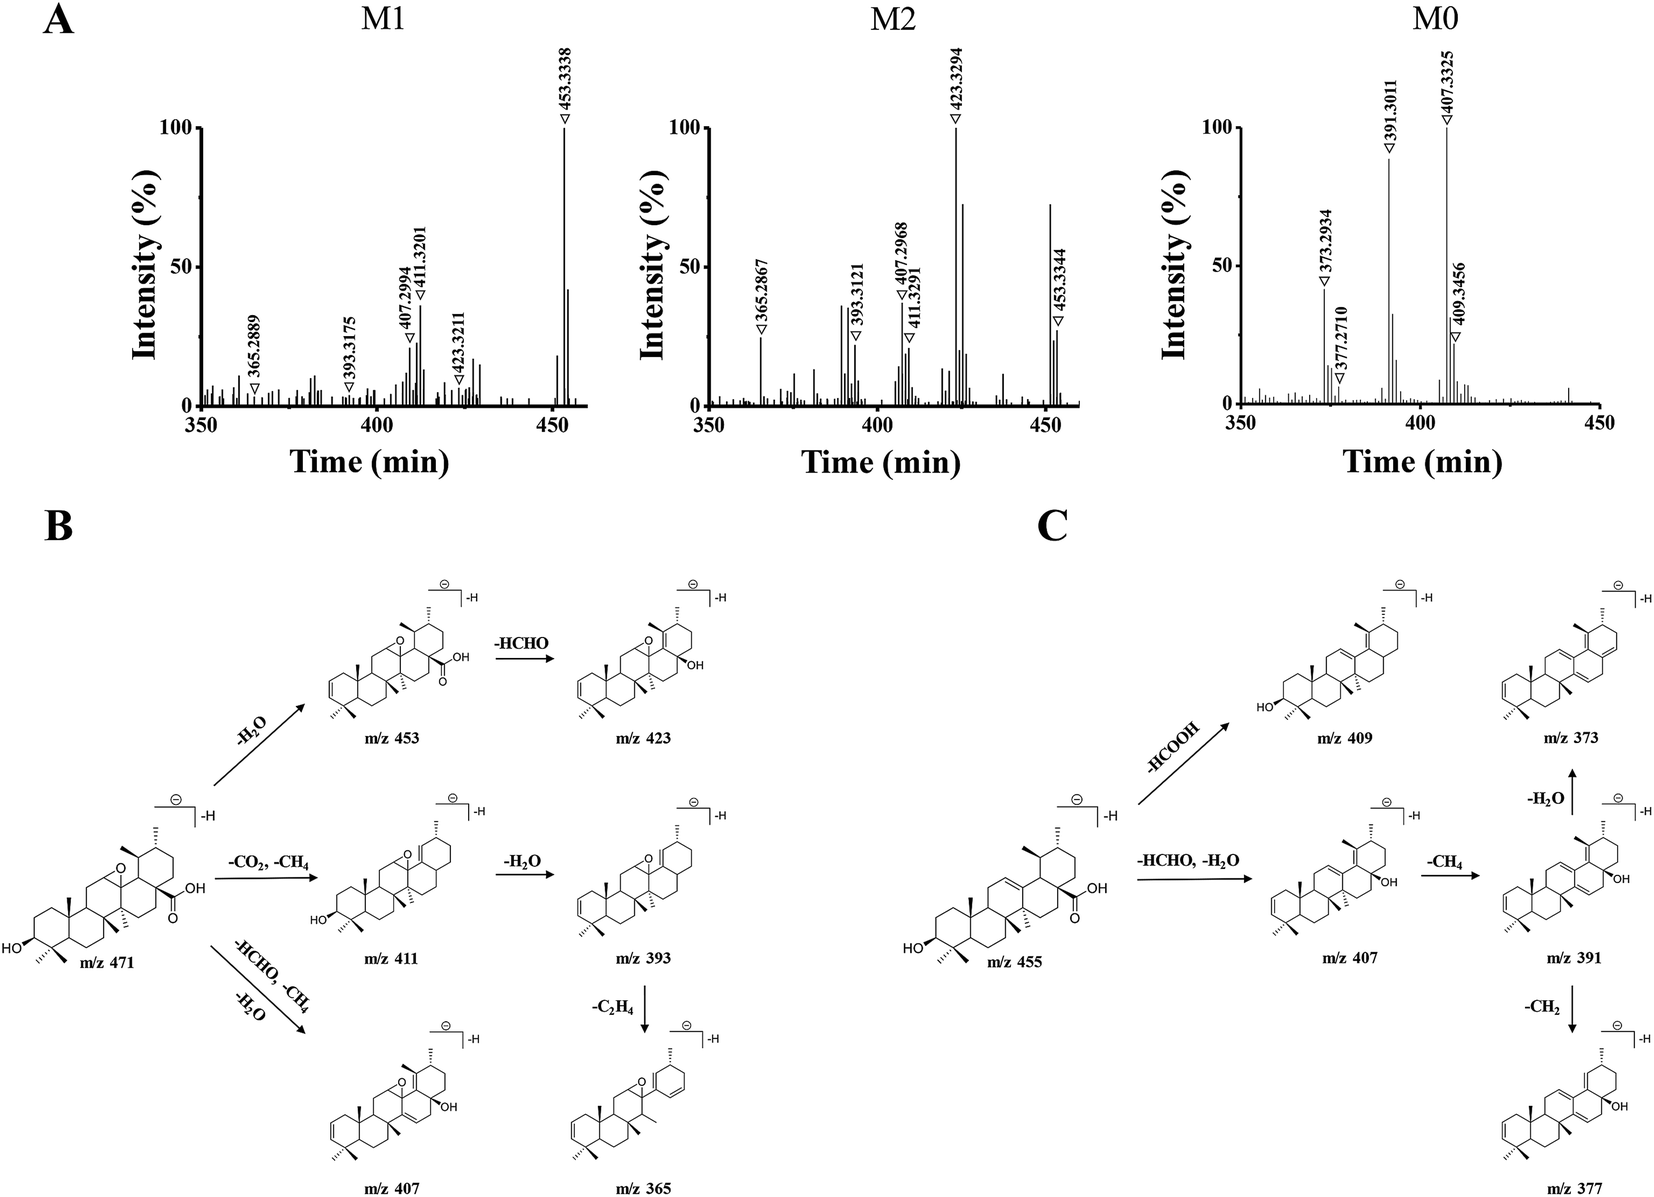 | ||
| Fig. 3 (A) Q/TOF-MS2 spectra in negative ESI mode of M1 (m/z 471.3464), M2 (m/z 471.3487), and M0 (m/z 455.3538). (B) The proposed fragmentation pathways of M1 and M2. (C) The proposed fragmentation pathway of M0. | ||
M1 and M2 were eluted at 18.32 min, and 17.53 min, respectively, and they both gave the same parent ions at m/z 471.34. As shown in Fig. 3B, M1 and M2 showed the same fragment pathways as the following three different ways: (1) diagnostic loss of H2O (18.01 Da) from the deprotonated molecular ion leading to m/z 453.33, followed by loss of HCHO (30.01 Da) leading to m/z 423.32. (2) Diagnostic loss of CO2 (43.98 Da) and CH4 (16.03 Da) from the deprotonated molecular ion leading to m/z 411.32 and successive loss of H2O leading to m/z 393.31. Then, the fragment ions at m/z 393 was successive loss of C2H4 (28.03 Da) leading to m/z 365.28. (3) Diagnostic loss of HCHO, CH4 and H2O from the deprotonated molecular ion leading to m/z 407.29.
M0 was eluted at 23.45 min, gave the parent ion at m/z 455.35. As shown in Fig. 3C, M0 showed the fragment pathways as the following two different ways: (1) diagnostic loss of HCOOH (46.00 Da) from the deprotonated molecular ion leading to m/z 409.34. (2) Diagnostic loss of HCHO and H2O from the deprotonated molecular ion leading to m/z 407.33, followed by loss of CH4 leading to m/z 391.30, and successive loss of CH2 (14.01 Da) or H2O leading to m/z 377.27 or m/z 373.29. The retention time and MS2 data were all the same with the standard UA. Therefore, M0 was a prototype metabolite and was identified as UA.
M1 and M2 were 16 Da more than M0, and the 16 Da shift could be attributed to an additional oxygen atom. According to the UA structure and the type of phase I reaction, we supposed that M1 and M2 could be the products of the olefin oxidation of UA, which meant the reaction occurred in the position of the carbon–carbon double bond under the action of enzymes in vivo.
3.3 Identification of M1 and M2
According to the analysis above by UPLC-Q/TOF-MS, M1 and M2 were tentatively identified as UA epoxides, and we were interested in synthesizing them by a chemical method for further validation and study.Compound 1 was synthetized as a reference standard to identify the structure of M1, and it was unequivocally elucidated by NMR techniques (1D and 2D) and LC-MS. The 1H and 13C NMR spectral data of compound 1 are shown in ESI Table S1.† The 1H, 13C, DEPT, 2D-NMR spectrums of compound 1 are shown in ESI Fig. S2–S8,† respectively. The 1H NMR (Fig. S2†) spectrum of compound 1 exhibited a new signal at 4.29 ppm. 2D-NOESY (Fig. S8†) correlation of compound 1 indicated that this new signal at 4.29 ppm had correlations with the protons H9 and H27 but had no correlation with the proton H18, which meant H12 resided above the plane of the hexatomic ring. Thus, the site of the epoxy structure was under the plane of the hexatomic ring. In summary, compound 1 was identified as (3R,4S,4bR,5aS,6bR,9S,12aR,12bS,14aS)-9-hydroxy-3,4,6b,10,10,12a,12b-heptamethylicosahydro-1H-piceno[12b,13-b]oxirene-14a-carboxylic acid (UA epoxide 1). The structure and NOESY correlation of compound 1 is shown as Fig. 4A.
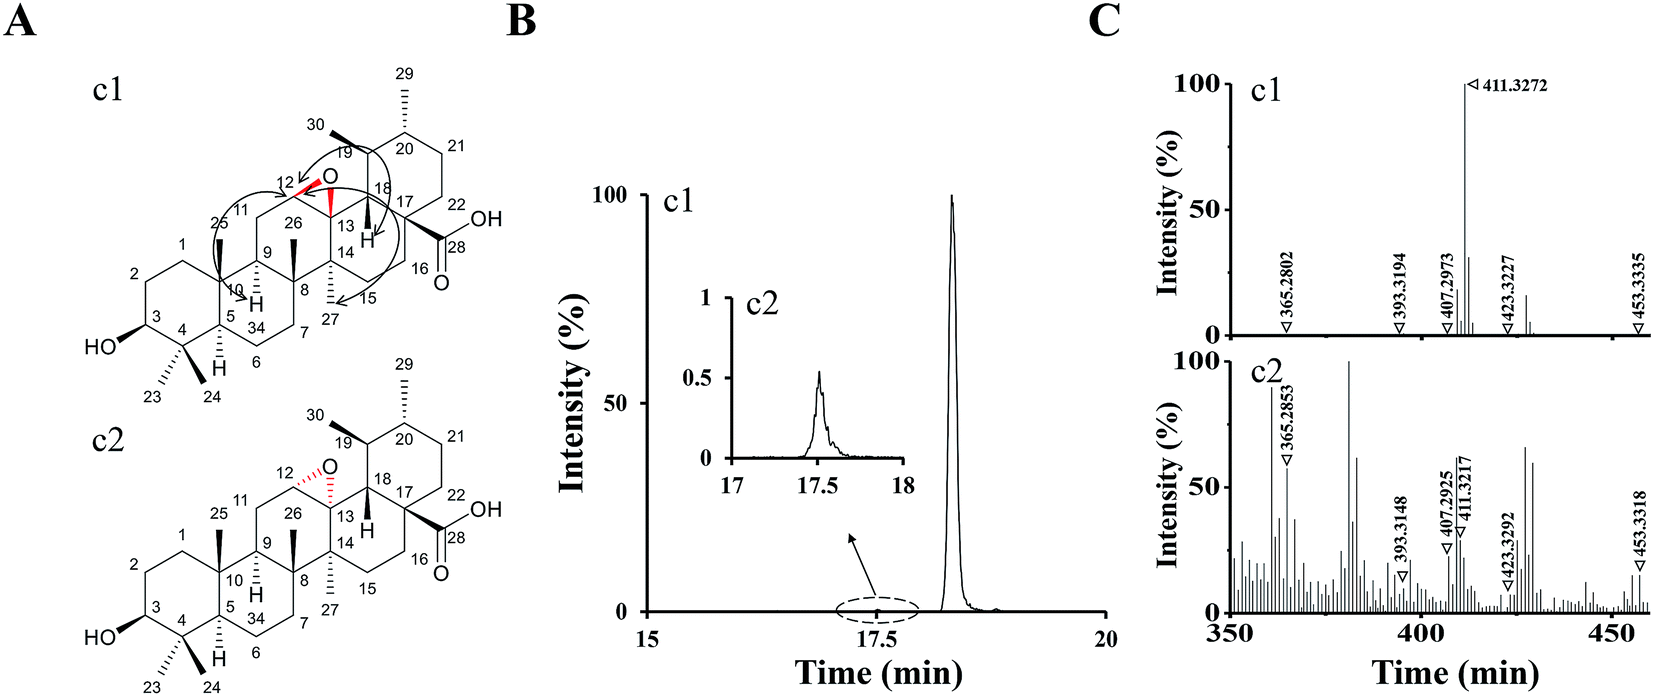 | ||
| Fig. 4 (A) The structure and NOESY correlation of compound 1 (c1) and the structure prediction of compound 2 (c2). (B) The XIC (negative ESI mode) of c1 and c2. (C) Q/TOF-MS2 spectra of c1 and c2. | ||
The collision-induced dissociation mass spectrum of compound 1 (Fig. 4C) was also analyzed to characterize the fragmentation. Compound 1 was eluted at 18.32 min, which was the same with M1. As shown in Table 1, the characteristic parent and fragment ions of M1 were basically identical with those of compound 1. Therefore, we identified M1 as UA epoxide 1.
| Peak no. | RT (min) | Molecule formula | Precursor ions | Metabolic type | MS2 fragment ions | Fragment formula |
|---|---|---|---|---|---|---|
| a Identified by comparison with standards. | ||||||
| M0a | 23.45 | C30H48O3 | 455.3538 | Prototype metabolism | 409.3456, 407.3325, 391.3011, 377.2710, 373.2934 | C29H45O, C29H43O, C28H39O, C27H37O, C28H37 |
| M1a | 18.32 | C30H48O4 | 471.3464 | Olefin oxidation | 453.3338, 423.3211, 411.3207, 407.2994, 393.3175, 365.2889 | C30H45O3, C29H43O2, C28H43O2, C28H39O2, C28H41O, C26H37O |
| M2 | 17.53 | C30H48O4 | 471.3487 | Olefin oxidation | 453.3344, 423.3294, 411.3291, 407.2968, 393.3121, 365.2867 | |
| c1 | 18.32 | C30H48O4 | 471.3477 | — | 453.3335, 423.3277, 411.3272, 407.2973, 393.3194, 365.2802 | |
| c2 | 17.53 | C30H48O4 | 471.3472 | — | 453.3318, 423.3292, 411.3217, 407.2925, 393.3148, 365.2853 | |
| M3 | 18.48 | C40H65N3O10S | 778.4528 | Olefin oxidation, glutathione conjugation | 471.3303, 379.2989, 306.0687, 78.9593 | C30H47O4, C27H39O, C10H16N3O6S, C5H3O |
| M4 | 18.65 | C40H63N3O8S | 744.4252 | Glutathione conjugation | 512.3696, 452.2469, 333.0459, 224.0683 | C32H50NO4, C26H34N3O2S, C11H15N3O7S, C7H14NO5S |
| M5 | 19.01 | C36H56O9 | 631.3724 | Glucuronidation | 455.3221, 277.1135, 175.0013, 113.0353 | C30H47O3, C15H17O5, C6H7O6, C5H5O3 |
| M6 | 20.24 | C32H51NO4 | 512.3663 | Glycine conjugation | 452.3489, 437.3315, 303.2220, 267.1955 | C30H46NO2, C30H45O2, C19H27O3, C16H27O3 |
| M7 | 22.03 | C32H53NO6 | 548.3979 | Olefin oxidation, glycine conjugation | 532.3338, 530.3902, 492.3607, 473.3534 | C31H50NO6, C32H52NO5, C30H52O5, C30H49O4 |
In the analysis process of compound 1, we found the other compound (compound 2) showed a parent ion at m/z 471.34 in the XIC. The XIC of compounds 1 and 2 in the negative ESI mode is shown in Fig. 4B. Compared with compound 1, compound 2 exhibited a very low intensity. Although 1H, 13C and 2D NMR of compound 2 were not measured due to insufficient compound and difficulty in separation, we speculated its structure by analyzing the collision-induced dissociation mass spectrum of it (Fig. 4C). As shown in Table 1, the characteristic parent and fragment ions of compound 2 were basically in accordance with those of compound 1. It should also be noted that the epoxidation reagent mCPBA might show diastereoselectivity according to reports, which could occur at the position of the carbon–carbon double bond to form two chiral configurations.26 Based on the above analysis results, we had reasons to believe that compounds 1 and 2 were chiral isomers. Compound 2 was tentatively identified as (3R,4S,4bS,5aR,6bR,9S,12aR,12bS,14aS)-9-hydroxy-3,4,6b,10,10,12a,12b-hepta-methylicosahydro-1H-piceno[12b,13-b]oxirene-14a-carboxylic acid (UA epoxide 2). The structure prediction of compound 2 is shown in Fig. 4A.
The retention time of compound 2 was 17.53 min, which was the same with M2. As shown in Table 1, characteristic parent and fragment ions of M2 were basically the same as compound 2. Therefore, we identified M2 as UA epoxide 2.
3.4 Identification of phase II metabolites
Phase II reactions mainly include conjugation with endogenous molecules, such as glucuronic acid (GluA), glycine (Gly) or glutathione (GSH), to form conjugated metabolites, which does not only (mostly) lead to the inactivation of the original drug and its primary metabolites but also increase the hydrophilicity and thus enhance excretion. Based on the above metabolic rules of compounds, the probable metabolites were first postulated.Five urinary metabolites (M3–M7) were detected only in the urine after the oral administration of UA to mice. The combination of the XICs (negative and positive ESI mode, respectively) for the metabolite profiling of UA in mouse urine are illustrated in Fig. 5A. The proposed structures, formulas and monoisotopic mass of M3, M4, M5, M6, and M7 are shown in Fig. 5B. These results indicated that the conjugation of glycine, glutathione and glucuronic acid could be major metabolic pathways for UA.
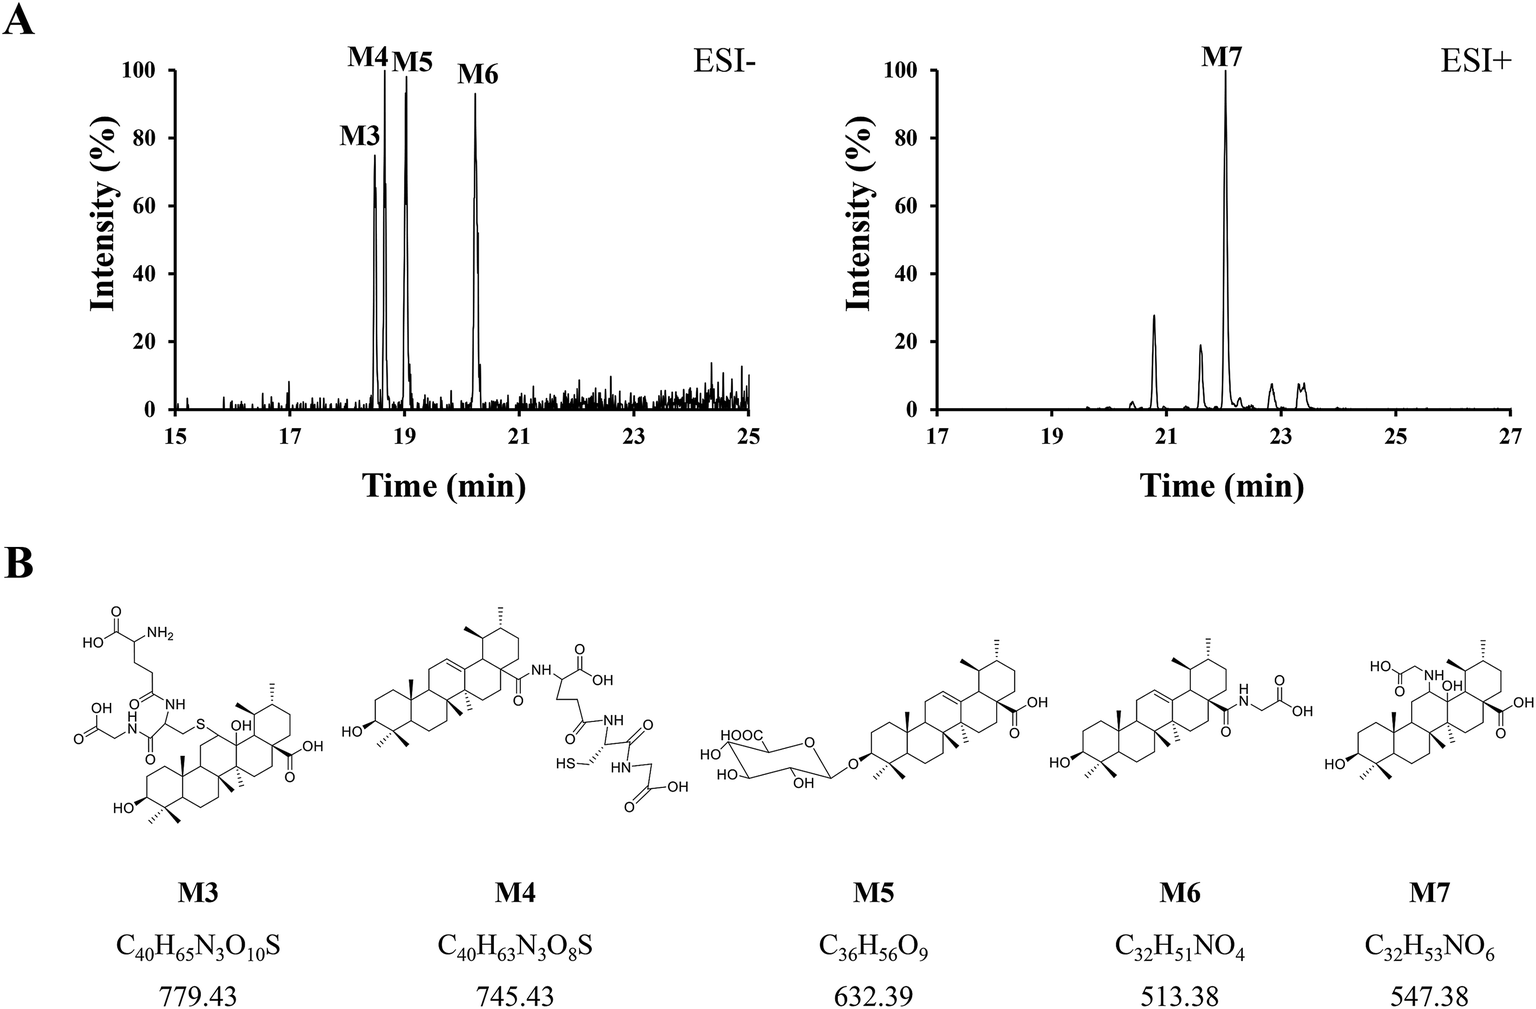 | ||
| Fig. 5 (A) Combination of the XICs (negative and positive ESI mode, respectively) of UA metabolites in mouse urine. (B) The proposed structures, formulas, monoisotopic mass of M3, M4, M5, M6, and M7. | ||
M3 (tR = 18.48 min) exhibited the molecular formula of C40H65N3O10S ([M − H]− m/z 778.45). In the MS2 spectrum, the parent ion further fragmented to ions at m/z 471.33 [M − H − GSH]− and m/z 306.06 [GSH − H]−, respectively. The results indicated that M3 underwent olefin oxidation and glutathione conjugation.
M4 (tR = 18.65 min) exhibited the molecular formula of C40H63N3O8S ([M − H]− m/z 744.42). In its MS2 spectrum, the fragment ions were [M − H − C8H12N2O4S]− at m/z 512.36 and [C11H16N3O7S − H]− at m/z 333.04, respectively. It was tentatively identified as UA glutathione.
M5 (tR = 19.01 min) exhibited the molecular formula of C36H56O9 ([M − H]− m/z 631.37). In its MS2 spectrum, the parent ion further fragmented to ions at m/z 455.32 [M − H − C6H8O6]−, m/z 175.00 [C6H8O6 − H]− and m/z 112.98 [C6H8O6 − H − H2O − CO2]−, respectively. It was tentatively identified as UA glucuronide.
M6 (tR = 20.24 min) exhibited the molecular formula of C32H51NO4 ([M − H]− m/z 512.36). In its MS2 spectrum, the parent ion further fragmented to ions at m/z 452.34 [M − H − CO2 − CH4]− and m/z 437.33 [M − H − Gly]−, respectively. It was tentatively identified as UA glycine.
M7 (tR = 22.03 min) exhibited the molecular formula of C32H53NO6 ([M + H]+ m/z 548.39). In its MS2 spectrum, the parent ion further fragmented to ions at m/z 530.39 [M + H − H2O]+ and m/z 473.35 [M + H − Gly]+, respectively. The results indicated that M7 underwent olefin oxidation and glycine conjugation.
3.5 Metabolic pathway of UA
The information including retention times, metabolic types, proposed molecular and fragment formulas, and precursor and MS2 fragment ion weights are presented in Table 1.In the present research, 7 metabolites of UA were detected in vivo. The proposed metabolic pathway of UA is shown as Fig. 6. The main biotransformation reactions of UA included olefin oxidation, glycine conjugation, glutathione conjugation, and glucuronic acid conjugation. In addition, olefin oxidation was the primary metabolic step, followed by further transformation through the conjugation of glycine, glutathione and glucuronidation, thus generating metabolites M3–M7.
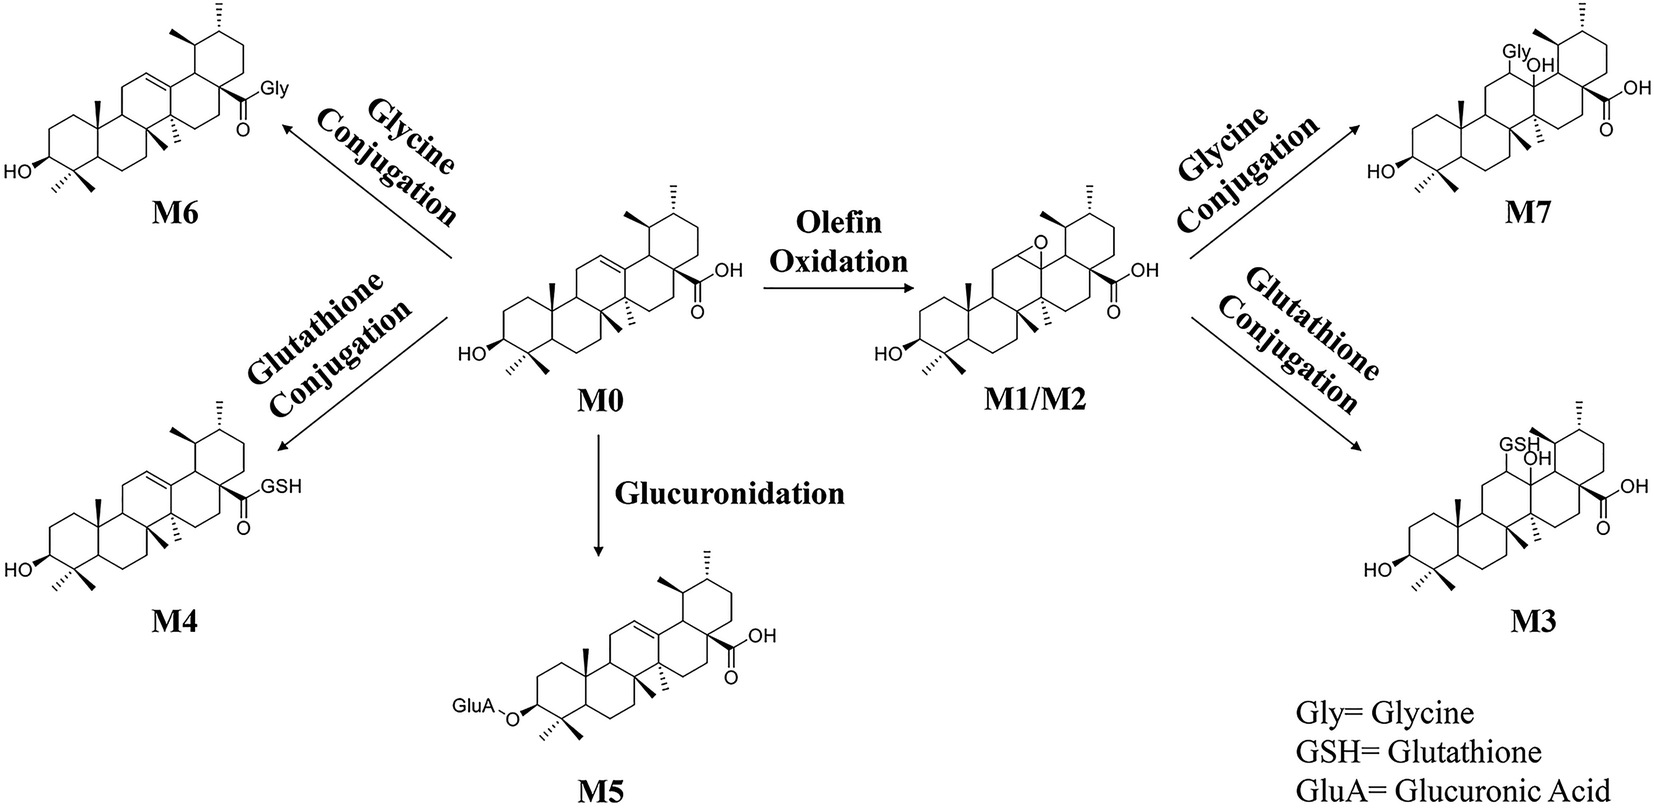 | ||
| Fig. 6 The proposed metabolic pathways of UA in vivo. | ||
4. Discussion
Anti-cancer activities of UA have been cast into the limelight, especially in the prevention of breast cancer. Several studies have shown the anti-breast cancer capacity of UA both in vitro and in vivo.9,11 Because of the huge clinical interest in UA and since the metabolites of UA have never been identified or isolated, we were interested in synthesizing them, as they were proposed as potential bioactive metabolites.In our present research, we have synthesized one of the major phase I metabolites and identified it as UA epoxide 1 by UPLC-Q/TOF-MS and NMR (1D and 2D) techniques. The other phase I metabolite was tentatively identified as UA epoxide 2 by UPLC-Q/TOF-MS. These types of structures probably have strong aromatase inhibition because the double bonds substituted by epoxide functionalities. The substitution part has similar bond geometries and allows the molecule to maintain planarity and it is a major chemical property for anti-aromatase activity.27,28 Aromatase is a unique cytochrome P-450 enzyme. It is the last step in the biosynthesis of estrogens which could catalyzes the aromatization of androgens. Aromatase inhibitors (AIs) are useful in treating estrogen-dependent diseases such as breast cancer by reducing the synthesis of estrogens.29,30 Various evidences as discussed above, indicates that UA epoxide 1 and UA epoxide 2 might be the potential AIs, but the anti-breast cancer activity of them requires further investigation.
Basically, organic substances or other chiral molecules could exhibit differences in chiral environments by enzymatic action, especially regarding biological properties.31,32 Although they might have identical physicochemical properties, the bioactivity processes such as uptake, distribution, metabolism, bioaccumulation and toxicity could be different.33 There were two conformations named UA epoxide 1 and UA epoxide 2 that emerged when the UA double bond is substituted by an epoxide functionality, and they were chiral isomers of each other. It is reported that some chiral isomers have diverse aromatase inhibition effects.34 One epoxide derivative showed strong aromatase inhibition, while its chiral isomer had a dramatic reduction in inhibition. The study also indicated that the angle formed in the ring junction was crucial to fit the enzymatic active site better. Some conformations were almost perpendicular, and these would not be well-accommodated by the enzyme. As for UA epoxide 1 and UA epoxide 2, their biological activities were not clear for the moment, but there were reasons to believe that they may show distinct biological properties. Beyond that, we found that the selectivity of the preferential conformation was different between the mouse body and chemical synthesis. UA epoxide 1 is the preferential conformation in chemical synthesis, while in the mouse body, UA epoxide 2 is the preferential conformation. This suggests that the results of in vivo metabolic enzymes might be different from those of in vitro chemical reagents. Therefore, further study is needed to investigate them, and this study would be meaningful for future experimental and clinical research.
5. Conclusion
The results show that the study established a UPLC-Q/TOF-MS method to identify the possible metabolites in mouse plasma and urine after oral dosing with UA. A total of 2 metabolites in plasma and 5 metabolites in urine were identified by diagnostic mass data and fragmentation patterns. Additionally, we have synthetized and identified two major metabolites of UA, which were new substances that were chiral isomers of each other. The in vivo metabolic processes included olefin oxidation, glycine conjugation, glutathione conjugation, and glucuronidation. Meanwhile, the metabolic pathways for UA were firstly proposed. The investigation provides reliable scientific support for the further understanding of the metabolic fate of UA in vivo. Further preparation of the metabolites and scientific evaluation about their activities will be conductive to clarifying the prospective biological mechanism of UA.Conflicts of interest
The authors have declared no conflicts of interest.Acknowledgements
This study was supported by the National Natural Science Foundation of China (Grant Number 81430095).References
- D. Kashyap, H. S. Tuli and A. K. Sharma, Life Sci., 2016, 146, 201–213 CrossRef CAS PubMed.
- G. Li, X. Zhang, J. You, C. Song, Z. Sun, L. Xia and Y. Suo, Anal. Chim. Acta, 2011, 688, 208–218 CrossRef CAS PubMed.
- L. S. Bergamin, F. Figueiro, F. Dietrich, F. M. Manica, E. C. Filippi-Chiela, F. B. Mendes, E. H. F. Jandrey, D. V. Lopes, F. H. Oliveira, I. C. Nascimento, H. Ulrich and A. M. O. Battastini, Eur. J. Pharmacol., 2017, 811, 268–275 CrossRef CAS PubMed.
- H. Wang, M. K. Sim, W. K. Loke, A. Chinnathambi, S. A. Alharbi, F. R. Tang and G. Sethi, Front. Pharmacol., 2017, 8, 352 CrossRef PubMed.
- X. Ma, Y. Zhang, Z. Wang, Y. Shen, M. Zhang, Q. Nie, Y. Hou and G. Bai, Mol. Nutr. Food Res., 2017, 61, 1700332 Search PubMed.
- S. T. Cargnin and S. B. Gnoatto, Food Chem., 2017, 220, 477–489 CrossRef CAS PubMed.
- M. K. Shanmugam, X. Dai, A. P. Kumar, B. K. Tan, G. Sethi and A. Bishayee, Biochem. Pharmacol., 2013, 85, 1579–1587 CrossRef CAS PubMed.
- Y. Yoon, J. W. Lim, J. Kim, Y. Kim and K. H. Chun, Bioorg. Med. Chem. Lett., 2016, 26, 5524–5527 CrossRef CAS PubMed.
- R. Venugopal and R. H. Liu, Food Science and Human Wellness, 2012, 1, 1–13 CrossRef.
- E. Kassi, T. G. Sourlingas, M. Spiliotaki, Z. Papoutsi, H. Pratsinis, N. Aligiannis and P. Moutsatsou, Cancer Invest., 2009, 27, 723–733 CrossRef CAS PubMed.
- R. E. De Angel, S. M. Smith, R. D. Glickman, S. N. Perkins and S. D. Hursting, Nutr. Cancer, 2010, 62, 1074–1086 CrossRef CAS PubMed.
- Q. Ren, Y. L. Wang, M. L. Wang and H. Y. Wang, J. Chromatogr. B: Anal. Technol. Biomed. Life Sci., 2016, 1027, 64–73 CrossRef CAS PubMed.
- Y. Ma, W. Xie, T. Tian, Y. Jin, H. Xu, K. Zhang and Y. Du, Anal. Biochem., 2016, 511, 61–73 CrossRef CAS PubMed.
- X. Wang, J. Li and A.-H. Zhang, RSC Adv., 2016, 6, 63049–63057 RSC.
- R. Plumb, J. Castro-Perez, J. Granger, I. Beattie, K. Joncour and A. Wright, Rapid Commun. Mass Spectrom., 2004, 18, 2331–2337 CrossRef CAS PubMed.
- T. Zhao, J. He, X. Wang, B. Ma, X. Wang, L. Zhang, P. Li, N. Liu, J. Lu and X. Zhang, J. Pharm. Biomed. Anal., 2014, 98, 311–320 CrossRef CAS PubMed.
- X. Feng, H. Liu, L. Chai, L. Ding, G. Pan and F. Qiu, J. Chromatogr. B: Anal. Technol. Biomed. Life Sci., 2017, 1046, 102–109 CrossRef CAS PubMed.
- D. Yao, Z. Li, C. Huo, Y. Wang, Y. Wu, M. Zhang, L. Li, Q. Shi, H. Kiyota and X. Shi, J. Chromatogr. B: Anal. Technol. Biomed. Life Sci., 2016, 1033–1034, 250–260 CrossRef CAS PubMed.
- S. Li, H. Lin, C. Qu, Y. Tang, J. Shen, W. Li, S. Yue, J. Kai, G. Shang, Z. Zhu, C. Zhang, P. Liu, H. Yan, L. Zhang, L. Qian, D. Qian and J. A. Duan, J. Ethnopharmacol., 2015, 170, 175–183 CrossRef CAS PubMed.
- J. Tang, J. Guo, J. Fan, C. Qian, F. Tao, X. Zhou, X. Wu, Y. Sun, J. Li, Y. Shen and Q. Xu, J. Chromatogr. B: Anal. Technol. Biomed. Life Sci., 2013, 929, 56–62 CrossRef CAS PubMed.
- G. Song, M. Jin, Y. Du, L. Cao and H. Xu, J. Chromatogr. B: Anal. Technol. Biomed. Life Sci., 2016, 1022, 21–29 CrossRef CAS PubMed.
- J. Yin, J. Xie, X. Guo, L. Ju, Y. Li and Y. Zhang, J. Chromatogr. B: Anal. Technol. Biomed. Life Sci., 2016, 1033–1034, 428–435 CrossRef CAS PubMed.
- N. Ma, I. Karam, X. W. Liu, X. J. Kong, Z. Qin, S. H. Li, Z. H. Jiao, P. C. Dong, Y. J. Yang and J. Y. Li, Toxicol. Appl. Pharmacol., 2017, 332, 40–51 CrossRef CAS PubMed.
- Y. Y. Zhao, X. L. Cheng, F. Wei, X. Y. Xiao, W. J. Sun, Y. Zhang and R. C. Lin, Biomarkers, 2012, 17, 48–55 CrossRef CAS PubMed.
- Y. Y. Zhao, J. Liu, X. L. Cheng, X. Bai and R. C. Lin, Clin. Chim. Acta, 2012, 413, 642–649 CrossRef CAS PubMed.
- K. Kamata, T. Hirano, S. Kuzuya and N. Mizuno, J. Am. Chem. Soc., 2009, 131, 6997–7004 CrossRef CAS PubMed.
- C. Varela, E. J. Tavares da Silva, C. Amaral, G. Correia da Silva, T. Baptista, S. Alcaro, G. Costa, R. A. Carvalho, N. A. A. Teixeira and F. M. F. Roleira, J. Med. Chem., 2012, 55, 3992–4002 CrossRef CAS PubMed.
- C. L. Varela, C. Amaral, G. Correia-da-Silva, R. A. Carvalho, N. A. Teixeira, S. C. Costa, F. M. Roleira and E. J. Tavares-da-Silva, Steroids, 2013, 78, 662–669 CrossRef CAS PubMed.
- E. A. Perez, Oncologist, 2006, 11, 1058–1069 CrossRef CAS PubMed.
- V. C. Jordan and A. M. Brodie, Steroids, 2007, 72, 7–25 CrossRef CAS PubMed.
- Q. Zhang, B. Gao, M. Tian, H. Shi, X. Hua and M. Wang, J. Chromatogr. B: Anal. Technol. Biomed. Life Sci., 2016, 1009–1010, 130–137 CrossRef CAS PubMed.
- Y. Qi, D. Liu, M. Luo, X. Jing, P. Wang and Z. Zhou, Chemosphere, 2016, 146, 315–322 CrossRef CAS PubMed.
- X. Cai, W. Liu and G. Sheng, J. Agric. Food Chem., 2008, 56, 2139–2146 CrossRef CAS PubMed.
- M. M. D. S. Cepa, E. J. Tavares da Silva, G. Correia-da-Silva, F. M. F. Roleira and N. A. A. Teixeira, J. Med. Chem., 2005, 48, 6379–6385 CrossRef CAS PubMed.
Footnote |
| † Electronic supplementary information (ESI) available. See DOI: 10.1039/c7ra11856b |
| This journal is © The Royal Society of Chemistry 2018 |