 Open Access Article
Creative Commons Attribution 3.0 Unported Licence
The chemical redox modulated switch-on fluorescence of carbon dots for probing alkaline phosphatase and its application in an immunoassay†
Pei Song ,
Qian Liu,
Ying Zhang,
Wei Liu,
Meng Meng,
Yongmei Yin* and
Rimo Xi*
State Key Laboratory of Medicinal Chemical Biology, College of Pharmacy, Tianjin Key Laboratory of Molecular Drug Research, Nankai University, Tianjin 300353, China. E-mail: xirimo@nankai.edu.cn; yinyongmei@nankai.edu.cn
First published on 20th December 2017
Abstract
Early diagnosis is an important requirement for the early treatment of diseases and reliable detection methods for biomarkers are indispensable tools for early diagnosis. However, recent innovations in analytical technology are rarely employed widely due to multiple factors including the requirement of specialized equipment and infrastructures. Hence, much attention has been focused on exploring universal nanoprobes for routine practices. Here, we report a chemical redox modulated switch-on fluorescence strategy based on versatile carbon dots (CDs) for probing alkaline phosphatase (ALP) and human IgG (a model target). The fluorescence of the CDs is initially quenched by Fe(III) and then restored by ascorbic acid, which is generated from the hydrolysis of ascorbic acid 2-phosphate (AAP) by the catalysis of ALP. Based on that, a simple “switch-on” fluorescence assay for ALP was designed and leads to a sensitivity of as low as 0.8 U L−1. The proposed assay is applied in ALP sensing in human serum samples. Additionally, the application of the switch-on fluorescence strategy is successfully expanded to the immunoassay of human IgG in serum from healthy adults and patients with systemic lupus erythematosus. The developed sensing system could be devised for various target sensors and has promising potential in the field of biological analysis and clinical diagnostics.
Introduction
The development of a distinctive assay for biomarker detection provides abundant options for biology and disease diagnosis. Despite remarkable achievements in laboratories, the extensive adoption of reported technological innovations in clinic is rare. This phenomenon is due to several reasons, such as the need to introduce different equipment, infrastructures and specialized operator training, and to consider the cost and acceptance of patients. Thus, renovating the traditional routine protocols is also a feasible direction for improving the ability of detection for diagnosis.1,2It is well known that alkaline phosphatase (ALP), the membrane-bound enzyme that plays a critical role in the signal transduction and regulation of intracellular processes,3–6 can be found in various tissues of living organisms such as intestine, bone, liver, placenta, and kidney.7–10 The abnormal level of serum ALP is related to various diseases including dynamic bone disease, diabetes, breast and prostate cancer, and liver dysfunction.11–13 In addition, ALP is a widely used labeling enzyme for use in immunoassays,14 DNA hybridization analysis and protein detection.15,16 Therefore, it is of great importance to develop a convenient and sensitive method for ALP level monitoring in various diagnostic applications.
Nowadays, fluorescence nanomaterials including quantum dots (QDs), noble metal nanoclusters, and carbon dots (CDs) receive much attention because of advantages including their easy synthesis and good stability, and a lack of photobleaching. Among them, CDs possess the unique properties of low toxicity and favorable biocompatibility.17–22 Studies on CD-based chemosensors for ALP have been reported previously. Qian et al. developed a detection strategy for ALP based on a turn-off process, which was induced by the disaggregation of CDs with the assistance of copper ions and PPi.23 Li et al. used a fluorescence assay to detect ALP based on the inner filter effect. When in the presence of ALP, p-nitrophenylphosphate was transformed into p-nitrophenol (PNP) and induced the absorption band transition from 310 to 405 nm, which resulted in the complementary overlap between the absorption band of PNP and the excitation band of CDs.24 Tang et al. developed a convenient assay for ALP through specific host–guest recognition based on β-cyclodextrin-modified CDs. The photoinduced electron transfer process between PNP and the CDs results in the quenching of the fluorescence of the CDs.25 Unfortunately, all of these assays are based on fluorescence quenching. However, such enzyme sensors do not contribute to a signal output on account of the high background signals.26,27 Additionally, the turn-off detection mode might cause an increased possibility of false positive signals due to self-quenching, solvent quenching, and so on.28,29 A “switch-on” sensing platform avoids the above disadvantage, whereas CD-based “switch-on” fluorescence assays for probing ALP have been rarely reported.
In this study, we developed a “switch-on” fluorescence assay for sensing ALP based on a simple chemical redox strategy. The fluorescence of the CDs prepared from lotus leaves is initially quenched specifically by Fe(III), and then restored by ascorbic acid (AA) generated from the hydrolysis of ascorbic acid 2-phosphate (AAP) by the catalysis of ALP (Fig. 1). The recovery of the fluorescence is due to the redox reaction between AA and Fe(III), which destroys the structure of the non-fluorescent CD–Fe(III) complex. The “switch-on” fluorescence assay for sensing ALP was successfully applied to the determination of ALP in human serum samples. Additionally, the ALP detection strategy was successfully combined with the immunoassay to monitor human IgG (as a model). This approach provides a new pathway to determine, but is not restricted to, ALP. It is a versatile platform with the ability to sense various targets and the platform can be extended to a large range of biological analyses and clinical diagnostics.
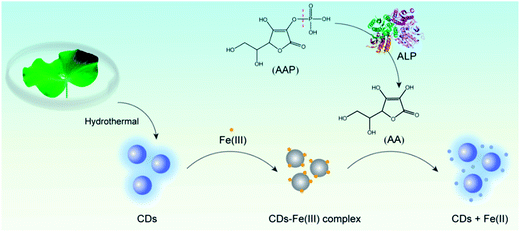 | ||
| Fig. 1 Schematic illustration of the detection strategy for ALP based on the chemical redox modulated switch-on fluorescence of carbon dots. | ||
Experimental section
Materials and instruments
Lotus leaves were obtained from Mati Lake at Nankai University and washed thoroughly before use. FeCl3 was purchased from Aladdin Chemistry Co., Ltd. (Shanghai, China). Alkaline phosphatase (ALP, from bovine intestinal mucosa) and ascorbic acid (AA) were bought from Sigma-Aldrich (St. Louis, MO, USA). Ascorbic acid 2-phosphate (AAP) was purchased from Adamas-Beta (Shanghai, China). Rabbit antihuman IgG and human IgG were obtained from Solarbio Bioscience & Technology Co., Ltd. (Beijing, China). ALP-labeled goat antihuman IgG was purchased from ImmunoReagents Inc. (Carolina, USA). High-purity water, which was purified using a Millipore System (Molsheim, France), was used throughout the experiments. Other chemicals were of analytical grade and used as received.The fluorescence measurements were conducted on a Hitachi F-4600 FL spectrophotometer using a 5/5 nm slit width (Tokyo, Japan). Fourier transform infrared spectra (FT-IR) were acquired on a BRUKER Tensor 37 spectrometer using KBr pellets (Germany). UV-vis absorption spectra were recorded on a Shimadzu UV-1750 spectrophotometer with one pair of 10 mm quartz cells (Japan). The transmission electron microscopic (TEM) image was acquired on a FEI Tecnai G2 F20 microscope operating at 200 kV (Hillsboro, USA). Particle size analysis was done using Image J software. The X-ray photoelectron spectra (XPS) were obtained out using a PE PHI-5300 ESCA system (Massachusetts, USA).
Synthesis of carbon quantum dots
CDs were simply synthesized by the hydrothermal method. Briefly, 2 g of lotus leaves and 10 mL of ultrapure water were added into a 50 mL Teflon-lined autoclave and heated at 200 °C for 5 h. After the mixture was cooled to room temperature naturally, the carbide slag was removed through centrifugation at 12![[thin space (1/6-em)]](https://www.rsc.org/images/entities/char_2009.gif) 000 rpm for 10 min. The supernatant was purified by filtration through a 0.22 μm filter membrane and then diluted with ultrapure water for further use.
000 rpm for 10 min. The supernatant was purified by filtration through a 0.22 μm filter membrane and then diluted with ultrapure water for further use.
Fluorescence quenching of the CDs by ferric ions
Ten microliters of Fe(III) solution (0, 5, 10, 20, 30, 40, 50, 60, 80, 100, 200, 300, 400, 600 μM) was added into the CD solution (990 μL, 1 μL mL−1), then they were mixed. After incubation at room temperature, the fluorescence emission spectra were recorded at the excitation wavelength of 320 nm. The specificity of the CDs for sensing Fe(III) was evaluated by the interfering metal ions (Fe2+, Cu2+, Cd2+, Cr3+, Zn2+, Mn2+, Ni2+, Co2+, Al3+, Pb2+, Ag+, Hg2+, Mg2+, Ba2+, Ca2+) under the same conditions. Besides, 100 μM of commonly used compounds (cysteine, glycine, Na2HPO4 and NaCl) were analyzed, with the same procedures as indicated above.Fluorescence assay for ALP
Ten microliters of AAP (50 mM) solution and 10 μL of ALP or other proteins were added into 480 μL of Tris–HCl buffer (10 mM, pH 7.4) and incubated for 30 min at 37 °C. After that, 490 μL of the CD (Tris–HCl) solution was added to make the pH of the mixture equal to 6.5 and then 10 μL of Fe(III) (300 μM) was added for another incubation of 5 min at room temperature. The fluorescence spectra were recorded at the excitation wavelength of 320 nm. In addition, several enzymes and anions that existed in the serum were selected to evaluate the specificity of the assay for ALP, including glucose oxidase (GOx), lysozyme, lactic dehydrogenase (LDH), trypsin, galactosidase (GAL), thrombin, tyrosinase (TYR), Cl− and HCO3−.For ALP determination in complex biological media, 10 μL of AAP (50 mM) solution and 10 μL of ALP solutions with different final concentrations were added into 480 μL of Tris–HCl buffer (10 mM, pH 7.4) containing 1% human serum for 30 min at 37 °C. The followed procedure was the same as indicated above.
Human IgG detection
The developed “switch-on” fluorescence assay was applied to human IgG detection based on a sandwich immunoassay platform. 96-well plates were coated with 1 μg mL−1 of anti-human IgG (100 μL per well) at 4 °C overnight, washed 3 times with Tris–HCl buffer (0.05% Tween 20), blocked by Tris–HCl buffer (10 g L−1 OVA) for 2 h and washed 3 times with Tris–HCl buffer (0.05% Tween 20). Next, human IgG (100 μL, 40–4000 ng mL−1) or the serum sample (105-fold dilution) was added, incubated for 30 min at 37 °C and washed 3 times. Then, ALP-labeled anti-human IgG (100 μL, 1![[thin space (1/6-em)]](https://www.rsc.org/images/entities/char_2009.gif) :
:![[thin space (1/6-em)]](https://www.rsc.org/images/entities/char_2009.gif) 200 dilution) was added, incubated for 30 min and washed 4 times. After this, the ALP reaction system was added and finally, the fluorescence spectra were recorded.
200 dilution) was added, incubated for 30 min and washed 4 times. After this, the ALP reaction system was added and finally, the fluorescence spectra were recorded.
Results and discussion
Characterization of CDs
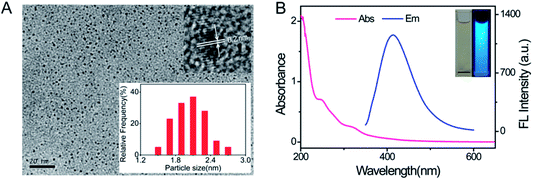
The as-prepared CDs were characterized using transmission electron microscopy (TEM), X-ray photoelectron spectroscopy (XPS), Fourier transform infrared spectroscopy (FT-IR), UV-vis absorption and fluorescence emission spectra. As shown in Fig. 2A, the TEM image confirms the spherical morphology and size information of the CDs (the average diameter is 2.1 nm). The high resolution TEM image (inset in Fig. 2A) shows that the CDs displayed a highly crystalline structure with a 0.2 nm lattice parameter, which is similar to the (102) diffraction plane of graphitic (sp2) carbon. In the XPS survey spectrum (Fig. S1A†) the C 1s, N 1s and O 1s signals appear at 285 eV, 400 eV and 532 eV, respectively. The elemental composition of the CDs was analyzed and confirmed the presence of 72.48% C, 12.95% N and 14.58% O. The high-resolution XPS spectrum of C 1s (Fig. S1B†) shows three peaks at 284.6 eV, 285.4 eV and 288.0 eV, which are assigned to C–C, C–N/C–O and C![[double bond, length as m-dash]](https://www.rsc.org/images/entities/char_e001.gif) O, respectively. The N 1s peak at 399.8 eV (Fig. S1C†) reveals the presence of C–N–C. The two peaks at 531.3 eV and 532.5 eV in O 1s spectrum (Fig. S1D†) are associated with the C
O, respectively. The N 1s peak at 399.8 eV (Fig. S1C†) reveals the presence of C–N–C. The two peaks at 531.3 eV and 532.5 eV in O 1s spectrum (Fig. S1D†) are associated with the C![[double bond, length as m-dash]](https://www.rsc.org/images/entities/char_e001.gif) O and C–OH/C–O–C bands.30 In addition, the functional groups on the surface of the CDs were further characterized using an FT-IR spectrum (Fig. S2†). It exhibits the stretching vibrations of O–H and N–H (3423 cm−1), C–H stretching vibrations (2966 cm−1), C–N stretching vibrations (2360 cm−1) and C
O and C–OH/C–O–C bands.30 In addition, the functional groups on the surface of the CDs were further characterized using an FT-IR spectrum (Fig. S2†). It exhibits the stretching vibrations of O–H and N–H (3423 cm−1), C–H stretching vibrations (2966 cm−1), C–N stretching vibrations (2360 cm−1) and C![[double bond, length as m-dash]](https://www.rsc.org/images/entities/char_e001.gif) O stretching vibrations (1666 cm−1). Besides, the peak at 1632 cm−1 could be identified as the stretching vibrations of C–O and the bending vibrations of N–H.31 The peak at 1400 cm−1 is attributed to C–N, N–H, and –COO groups.32 The bands in the range of 1043–1120 cm−1 are assigned to the stretching and bending vibration of C–O bonds. The UV-vis absorption and fluorescence emission spectra of the aqueous dispersion of the CDs are presented in Fig. 2B. It is seen that the resultant CDs show two weak absorption peaks at 242 nm and 320 nm which are ascribed to the π–π* transition of C
O stretching vibrations (1666 cm−1). Besides, the peak at 1632 cm−1 could be identified as the stretching vibrations of C–O and the bending vibrations of N–H.31 The peak at 1400 cm−1 is attributed to C–N, N–H, and –COO groups.32 The bands in the range of 1043–1120 cm−1 are assigned to the stretching and bending vibration of C–O bonds. The UV-vis absorption and fluorescence emission spectra of the aqueous dispersion of the CDs are presented in Fig. 2B. It is seen that the resultant CDs show two weak absorption peaks at 242 nm and 320 nm which are ascribed to the π–π* transition of C![[double bond, length as m-dash]](https://www.rsc.org/images/entities/char_e001.gif) C bonds and n–π* transition of C
C bonds and n–π* transition of C![[double bond, length as m-dash]](https://www.rsc.org/images/entities/char_e001.gif) O bonds in the CDs.33,34 The emission spectrum shows that a strong emission with a maximum emission wavelength at 412 nm could be observed under excitation at 320 nm. Strong blue photoluminescence was seen under UV light (inset in Fig. 2B). Besides, the fluorescence spectra depicted an excitation dependent behavior. With an increase in excitation wavelength from 290 nm to 380 nm, the maximum emission shifted from 407 nm to 446 nm (Fig. S3†). The strongest emission spectrum was observed at an excitation wavelength of 320 nm. The excitation-dependent fluorescence behavior of the CDs is due to the different sizes and surface states of the nanoparticles,35 as in the case of graphene quantum dots and most of the luminescent carbon dots.36
O bonds in the CDs.33,34 The emission spectrum shows that a strong emission with a maximum emission wavelength at 412 nm could be observed under excitation at 320 nm. Strong blue photoluminescence was seen under UV light (inset in Fig. 2B). Besides, the fluorescence spectra depicted an excitation dependent behavior. With an increase in excitation wavelength from 290 nm to 380 nm, the maximum emission shifted from 407 nm to 446 nm (Fig. S3†). The strongest emission spectrum was observed at an excitation wavelength of 320 nm. The excitation-dependent fluorescence behavior of the CDs is due to the different sizes and surface states of the nanoparticles,35 as in the case of graphene quantum dots and most of the luminescent carbon dots.36
Fluorescence response of the CDs and mechanism analysis
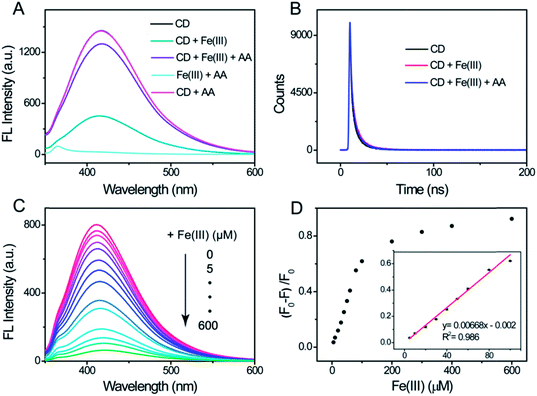
As it has been reported that metal ions can be used to coordinate to the fluorescence indicator to form a chemosensing ensemble,37–39 we assessed the influence of sixteen metal cations and four compounds on the fluorescence of the CDs in this work. The introduction of the ions except with Fe(III) leads to an ignorable influence on the fluorescence of the CDs (Fig. S4†). Also, no significant change was observed with the addition of the four compounds, whereas the presence of Fe(III) has a remarkable impact on the fluorescence intensity with a distinct quenching effect (Fig. 3A). According to the results of the XPS and FT-IR, plentiful hydroxyl groups exist on the surface of the CDs. Furthermore, the electronegativity of oxygen-containing groups is higher than that of nitrogen-containing groups.40 Thus, we deduce that the fluorescence quenching of the CDs by Fe(III) arises from the coordination interactions between Fe(III) and the hydroxyl groups on the surface of the CDs. To get insight into the quenching mechanism, we measured the fluorescence lifetime to investigate the excited states of the CDs in the absence/presence of Fe(III). The fluorescence decay curves were found to fit well to a classical three-exponential function (Table S1†). In comparison to the CDs alone, the CD/Fe(III) complex shows a negligible change in the lifetime (Fig. 3B). The virtually identical fluorescence lifetimes implies that the fluorescence quenching obeys a simple static mechanism. According to the above analysis, the fluorescence quenching of the CDs should be attributed to the formation of the non-fluorescent complex, which is based on the coordination interactions between Fe(III) and the hydroxyl groups on the surface of the CDs, and it is a static quenching process.Fig. 3A exhibits the fluorescence emission spectra of differently treated CDs and shows that their fluorescence could be quenched by Fe(III). However, when AA was introduced into the CD/Fe(III) system, the quenched fluorescence was restored. In a control experiment, no change in the fluorescence intensity was observed with the individual addition of AA to the CD solution. Meanwhile, there was no detectable fluorescence when the AA solution was introduced to the Fe(III) solution. Thus, we suggest that the fluorescence restoring results from the redox reaction between AA and Fe(III) in the CD/Fe(III) complex. To further confirm the fluorescence restoring principle, the theoretical stability constant and fluorescence lifetime were investigated. As we know, Fe(II) is produced from the redox reaction between AA and Fe(III). The theoretical stability constant for the complex of hydroxide and Fe(III) is 1.00 × 10¹¹, whereas that of hydroxide and Fe(II) is lower (3.16 × 10⁴), which indicates that the generated Fe(II) may be separated from the surface of the CDs and would turn on the fluorescence. Additionally, the fluorescence decay data show that the lifetime of the resulting CD/Fe(III)/AA mixture is 9.62 ns (Fig. 3B and Table S1†), which is similar to the CDs and CD/Fe(III) complex. This result suggests that the whole quenching/recovery of the fluorescence obeys a static mechanism and the destruction of the structure of the non-fluorescent CD/Fe(III) complex induces the fluorescence recovery. Therefore, all of the above results demonstrate that the oxidation/reduction modulated by Fe(III)/AA results in the structural construction/destruction of the non-fluorescent CD/Fe(III) complex, leading to the fluorescence quenching/recovery.
We further evaluated the feasibility of the CDs as a fluorescent sensor for Fe(III) and AA detection by adding varying the concentration of the target. Fig. 3C shows the fluorescence emission spectra of the CDs when adding different amounts of Fe(III). It is found that the fluorescence of the CDs is significantly quenched by Fe(III) ions and the corresponding fluorescence intensity decreases obviously with the increase in the amount of Fe(III). The fluorescence intensity decreases by 92% of the original value when the concentration of Fe(III) is 600 μM (Fig. 3D). A good linear relationship was obtained between the fluorescence quenching efficiency and the concentration of Fe(III) in the range of 5 to 100 μM and the limit of detection for Fe(III) is 1.09 μM. The sensing performance of the CD–Fe(III) system for the detection of AA was evaluated by the addition of different concentrations of AA. The fluorescence intensity of the system could be gradually recovered upon the addition of AA (Fig. S5A†). The degree of the fluorescence recovery is directly related to the concentration of AA. A good linear relationship between the fluorescence intensity and AA concentration was obtained in the range of 0.5 to 200 μM (Fig. S5B†).
Assessment of the detection strategy for ALP based on CDs and AAP
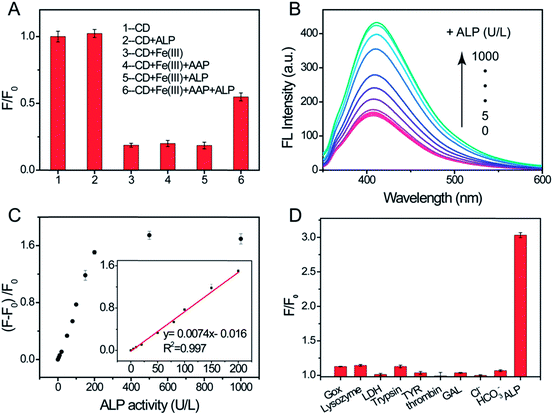
ALP catalyzes the hydrolysis of various orthophosphoric monoesters to yield phosphate and the corresponding alcohols/phenols. As one of the substrates of ALP, AAP can be converted to AA and phosphate. When AAP or ALP was added into the CD/Fe(III) system, no obvious change in the fluorescence intensity was observed (Fig. 4A), whereas, the strong fluorescence signal was restored with the addition of both AAP and ALP to the CD/Fe(III) system. Besides, the related fluorescence emission spectra are also displayed (Fig. S6†). Based on the above analysis, the enzymatically produced AA switches on the fluorescence of the CDs and a novel fluorescence assay for ALP can be developed.The experimental conditions including the amount of iron ions, the amount of AAP, pH and the incubation time were optimized and the results are listed in Fig. S7.† Under the optimal conditions, the sensing performance of this system for the quantitative analysis of ALP was investigated by adding varying concentrations of ALP. As displayed in Fig. 4B, the fluorescence peak at 412 nm increased gradually with the increase of the amount of ALP from 0 to 1000 U L−1. A good linear fitting curve was obtained between the relative fluorescence intensity and ALP concentration from 5 to 200 U L−1 (Fig. 4C). The limit of detection for ALP was estimated to be 0.8 U L−1 (with a signal-to-noise ratio of 3), which is comparable to those based on carbon dots reported recently (Table S2†). The results demonstrate that the proposed assay provides a sensitive platform for ALP detection. In order to evaluate the selectivity of the CD-based “switch-on” fluorescent probe for ALP, the effect of the proteins and anions possibly coexisting with ALP was investigated. As shown in Fig. 4D, the presence of GOx, lysozyme and trypsin result in slight fluorescence enhancements and no obvious fluorescence change is observed in the presence of LDH, GAL, thrombin, TYR, Cl− and HCO3−. However, the addition of ALP leads to a sharp increase of fluorescence intensity, indicating a good selectivity for the ALP response.
To test the applicability of the proposed assay to real human serum samples containing a variety of proteins and other contaminants, the assay for ALP in human serum was carried out. It is worth mentioning that the interference of GSH and Cys in the serum samples can be eliminated by adding NEM (0.3 mM), which is a scavenger that specifically reacts with GSH and Cys.41 Three serum samples with the addition of different concentrations of ALP were detected by the proposed method (Table S3†). The results indicate that our assay provides acceptable recoveries in the range of 93% to 110%, suggesting the negligible influence from complex biological media on ALP sensing and the potential of the “switch-on” fluorescent probe for ALP detection in real biological samples.
Human IgG detection
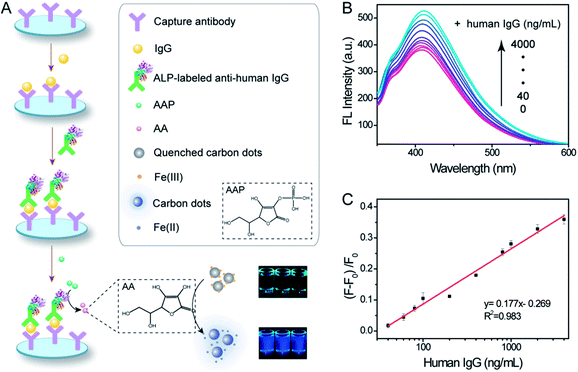
Inspired by the successful and extensive application of ALP in the immunoassay, the highly selective and sensitive ALP sensing system has great potential to be extended to an ALP-labeled immunoassay for a target antigen. Fig. 5A schematically illustrates the recognition principle of the proposed fluorescence immunoassay, which has been used to detect human IgG (a model target). The anti-human IgG antibody and ALP-labeled anti-human IgG antibody were employed as capture and detection antibodies, respectively. Meanwhile, AAP was chosen as the substrate and ALP was used as the readout enzyme. After the formation of a sandwich-type immunocomplex in the presence of human IgG, the ALP bound on the polystyrene microwells triggers the AA-mediated fluorescence recovery of the CDs. Therefore, a fluorescence sandwich immunoassay can be established and developed.The degree of fluorescence recovery is directly related to the concentration of the target antigen (Fig. 5B). A CD-based “switch-on” fluorescence immunoassay platform was developed where a serial increase of the target molecule resulted in different gradients of fluorescence intensity. The relative fluorescence intensity is proportional to the logarithm of the human IgG concentration in a linear range from 40 to 4000 ng mL−1 (Fig. 5C). The limit of detection is 150 pg mL−1. As a comparison, the human IgG ELISA kit provided a LOD of 6 ng mL−1, which has a lower sensitivity than that obtained by our “switch-on” fluorescence immunoassay. Additionally, the selectivity of the constructed immunoassay was evaluated. As depicted in Fig. S8,† there is no significant interference observable from rabbit IgG, goat IgG and mouse IgG. However, this strategy could be applied to various target molecules simply by using different antigen–antibody pairs.
Human IgG is not only a widely used model antigen but also a biomarker of autoimmune diseases. Quantitative measurement of its presence in serum is highly valuable to the diagnosis of diseases and to the monitoring of treatment responses.42 In clinic, the amount of IgG in serum ranges from 7–16.5 mg mL−1 for healthy adults and that of patients with systemic autoimmune diseases is higher.43 To demonstrate the reliability and clinical application potential of the assay, sera from 7 donors (3 healthy donors and 4 SLE patients) were assayed with either standard ELISA or the proposed CD-based sensing system. As demonstrated in Fig. 6, the IgG detection results from these two methods show highly consistent values and they were not considered statistically significant (P > 0.1 for t-tests). It can be concluded that the results have no significant difference. The result suggests that the proposed assay provides a potential alternative for early diagnosis and monitoring treatment responses.
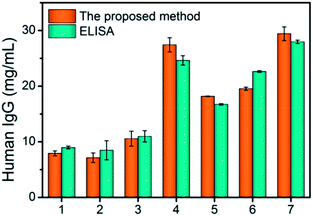 | ||
| Fig. 6 The detection of human IgG in 7 serum samples using our method and ELISA kits. Serum samples of no. 1–3 were from normal adults; serum samples of no. 4–7 were from the patients with SLE. | ||
Conclusion
In summary, a versatile CD-based platform modulated by a chemical redox “switch-on” fluorescence assay was presented, using lotus leaves as a raw material. This design was based on the phenomenon that the fluorescence of the prepared CDs was specifically quenched by Fe(III). The flexibility of this strategy has allowed us to quantify Fe(III), AA or ALP and detect human IgG in serum samples. The CDs prepared in this work possess many advantages, for example, they are low-cost and have high photostability and excellent biocompatibility, thus they are expected to be used in assays in vivo. The designed assay shows good specificity, sensitivity and capability of application to routine practice in clinic. Meanwhile, we envision that this “switch-on” fluorescence sensing platform is not limited to the above applications and has the potential to detect a variety of targets for biological analysis, early diagnosis, and treatment monitoring.Conflicts of interest
There are no conflicts to declare.Acknowledgements
This work was supported by financial support from the International Science & Technology Cooperation Program of China (No. 2015DFR40460), National Natural Science Foundation under Grant No. 81402896 and No. 81573390, and the National High-Tech Research and Development Program of China (863 Program) under Grant No. 2014AA022303.Notes and references
- W. C. Chan and S. Nie, Science, 1998, 281, 2016–2018 CrossRef CAS PubMed.
- J. M. Nam, C. S. Thaxton and C. A. Mirkin, Science, 2003, 301, 1884–1886 CrossRef CAS PubMed.
- P. Cohen, Trends Biochem. Sci., 2000, 25, 596–601 CrossRef CAS PubMed.
- M. B. Yaffe, Nat. Rev. Mol. Cell Biol., 2002, 3, 177–186 CrossRef CAS PubMed.
- L. N. Johnson and R. J. Lewis, Chem. Rev., 2001, 101, 2209–2242 CrossRef CAS PubMed.
- S. G. Julien, N. Dube, S. Hardy and M. L. Tremblay, Nat. Rev. Cancer, 2011, 11, 35–49 CrossRef CAS PubMed.
- J. E. Coleman, Annu. Rev. Biophys. Biomol. Struct., 1992, 21, 441–483 CrossRef CAS PubMed.
- J. P. Lalles, Nutr. Rev., 2014, 72, 82–94 CrossRef PubMed.
- Y. Kuang, J. Shi, J. Li, D. Yuan, K. A. Alberti, Q. Xu and B. Xu, Angew. Chem., Int. Ed., 2014, 53, 8104–8107 CrossRef CAS PubMed.
- M. C. L. Yeung and V. W. W. Yam, Chem. Sci., 2013, 4, 2928–2935 RSC.
- J. A. Lorente, H. Valenzuela, J. Morote and A. Gelabert, Eur. J. Nucl. Med., 1999, 26, 625–632 CrossRef CAS.
- P. Colombatto, A. Randone, G. Civitico, J. Monti Gorin, L. Dolci, N. Medaina, F. Oliveri, G. Verme, G. Marchiaro, R. Pagni, P. Karayiannis, H. C. Thomas, G. Hess, F. Bonino and M. R. Brunetto, J. Viral Hepatitis, 1996, 3, 301–306 CrossRef CAS.
- P. Colombatto, A. Randone, G. Civitico, G. Monti Gorin, L. Dolci, N. Medaina, G. Calleri, F. Oliveri, M. Baldi, G. Tappero, R. Volpes, E. David, G. Verme, A. Smedile, F. Bonino and M. R. Brunetto, J. Viral Hepatitis, 1997, 4(suppl. 1), 55–60 CrossRef.
- M. F. Hoylaerts, L. Ding, S. Narisawa, S. Van Kerckhoven and J. L. Millan, Biochemistry, 2006, 45, 9756–9766 CrossRef CAS PubMed.
- V. B. Paragas, Y. Z. Zhang, R. P. Haugland and V. L. Singer, J. Histochem. Cytochem., 1997, 45, 345–357 CrossRef CAS PubMed.
- K. P. Top, G. Hatleberg, K. N. Berggren, D. Ryan, C. Kemper, R. P. Haugland and W. F. Patton, Electrophoresis, 2001, 22, 896–905 CrossRef CAS PubMed.
- H. Duan, D. Wang and Y. Li, Chem. Soc. Rev., 2015, 44, 5778–5792 RSC.
- J. Deng, W. Ma, P. Yu and L. Mao, Anal. Chem., 2015, 87, 6958–6965 CrossRef CAS PubMed.
- S. Y. Lim, W. Shen and Z. Gao, Chem. Soc. Rev., 2015, 44, 362–381 RSC.
- V. Strauss, J. T. Margraf, C. Dolle, B. Butz, T. J. Nacken, J. Walter, W. Bauer, W. Peukert, E. Spiecker, T. Clark and D. M. Guldi, J. Am. Chem. Soc., 2014, 136, 17308–17316 CrossRef CAS PubMed.
- G. E. LeCroy, S. K. Sonkar, F. Yang, L. M. Veca, P. Wang, K. N. Tackett, J. J. Yu, E. Vasile, H. Qian, Y. Liu, P. G. Luo and Y. P. Sun, ACS Nano, 2014, 8, 4522–4529 CrossRef CAS PubMed.
- Y. Wu, P. Wei, S. Pengpumkiat, E. A. Schumacher and V. T. Remcho, Anal. Chem., 2015, 87, 8510–8516 CrossRef CAS PubMed.
- Z. S. Qian, L. J. Chai, Y. Y. Huang, C. Tang, J. J. Shen, J. R. Chen and H. Feng, Biosens. Bioelectron., 2015, 68, 675–680 CrossRef CAS PubMed.
- G. Li, H. Fu, X. Chen, P. Gong, G. Chen, L. Xia, H. Wang, J. You and Y. Wu, Anal. Chem., 2016, 88, 2720–2726 CrossRef CAS PubMed.
- C. Tang, Z. Qian, Y. Huang, J. Xu, H. Ao, M. Zhao, J. Zhou, J. Chen and H. Feng, Biosens. Bioelectron., 2016, 83, 274–280 CrossRef CAS PubMed.
- C. C. Huang, C. T. Chen, Y. C. Shiang, Z. H. Lin and H. T. Chang, Anal. Chem., 2009, 81, 875–882 CrossRef CAS PubMed.
- Z. Zhou, Y. Du and S. Dong, Biosens. Bioelectron., 2011, 28, 33–37 CrossRef CAS PubMed.
- X. L. Hu, X. M. Wu, X. Fang, Z. J. Li and G. L. Wang, Biosens. Bioelectron., 2016, 77, 666–672 CrossRef CAS PubMed.
- Z. Qian, L. Chai, C. Tang, Y. Huang, J. Chen and H. Feng, Anal. Chem., 2015, 87, 2966–2973 CrossRef CAS PubMed.
- S. Liu, J. Tian, L. Wang, Y. Luo, J. Zhai and X. Sun, J. Mater. Chem., 2011, 21, 11726–11729 RSC.
- Y. Yang, J. Cui, M. Zheng, C. Hu, S. Tan, Y. Xiao, Q. Yang and Y. Liu, Chem. Commun., 2012, 48, 380–382 RSC.
- D. Sun, R. Ban, P. H. Zhang, G. H. Wu, J. R. Zhang and J. J. Zhu, Carbon, 2013, 64, 424–434 CrossRef CAS.
- S. Li, Y. Li, J. Cao, J. Zhu, L. Fan and X. Li, Anal. Chem., 2014, 86, 10201–10207 CrossRef CAS PubMed.
- X. C. Sun, C. Bruckner and Y. Lei, Nanoscale, 2015, 7, 17278–17282 RSC.
- Y. Q. Dong, H. C. Pang, H. B. Yang, C. X. Guo, J. W. Shao, Y. W. Chi, C. M. Li and T. Yu, Angew. Chem., Int. Ed., 2013, 52, 7800–7804 CrossRef CAS PubMed.
- A. Jaiswal, S. S. Ghosh and A. Chattopadhyay, Chem. Commun., 2012, 48, 407–409 RSC.
- B. Shi, Y. Su, L. Zhang, M. Huang, R. Liu and S. Zhao, ACS Appl. Mater. Interfaces, 2016, 8, 10717–10725 CAS.
- Z. Gao, L. B. Wang, R. X. Su, R. L. Huang, W. Qi and Z. M. He, Biosens. Bioelectron., 2015, 70, 232–238 CrossRef CAS PubMed.
- J. H. Lin, Y. C. Yang, Y. C. Shih, S. Y. Hung, C. Y. Lu and W. L. Tseng, Biosens. Bioelectron., 2016, 77, 242–248 CrossRef CAS PubMed.
- J. J. Mullay, J. Am. Chem. Soc., 1985, 107, 7271–7275 CrossRef CAS.
- J. Yuan, Y. Cen, X. J. Kong, S. Wu, C. L. Liu, R. Q. Yu and X. Chu, ACS Appl. Mater. Interfaces, 2015, 7, 10548–10555 CAS.
- R. C. Cunningham, Blood, 2010, 116, 7–15 CrossRef PubMed.
- D. C. Heiner, Am. J. Med., 1984, 76, 1–6 CrossRef CAS PubMed.
Footnote |
| † Electronic supplementary information (ESI) available. See DOI: 10.1039/c7ra11784a |
| This journal is © The Royal Society of Chemistry 2018 |

