 Open Access Article
Optochemical properties of gas-phase protonated tetraphenylporphyrin investigated using an optical waveguide NH3 sensor†
Gulimire Tuerdi a,
Patima Nizamidina,
Nuerguli Kari
 a,
Abliz Yimit*a and
Fu Wang
 b
b
aCollege of Chemistry and Chemical Engineering, Xinjiang University, Urumqi 830046, China. E-mail: ablizyimit@xju.edu.cn; Fax: +86-991-8580191; Tel: +86-991-8580191
bLaboratory of Environmental Sciences and Technology, Xinjiang Technical Institute of Physics & Chemistry, Key Laboratory of Functional Materials and Devices for Special Environments, Chinese Academy of Sciences, Urumqi 830011, China
First published on 1st February 2018
Abstract
5,10,15,20-Tetraphenylporphyrin (TPP) was synthesized, and a glass optical waveguide (OWG, which restricts and maintains the light energy in a specific, narrow space and propagates along the space axially) was coated with a gas-phase protonated TPP thin film to develop a sensor for NH3 gas detection. The results show that the TPP thin film agglomerated into H-based J-type aggregates after H2S gas exposure. The molecules in the protonated TPP film OWG sensor acted as NH3 receptors because the gas-phase protonated TPP film morphologically changed from J-type aggregates into free-base monomers when it was deprotonated by NH3 exposure. In this case, H2S gas could be used to increase the relative amount of J-type aggregates in the TPP film and restore the sensor response. The reversible surface morphology of the TPP film was analyzed by 1H NMR spectroscopy, atomic force microscopy, and UV-vis spectroscopy.
1. Introduction
Porphyrins are a well-known class of organic compounds that have attracted much attention owing to not only their important role in many bio-chemical processes, but also their unique electronic properties, which make them valuable reagents in the formation of functionalized molecular devices, such as porphyrin chemical sensors,1 solar cells,2 and memory storage devices.3,4 In such functionalized devices that have spectroscopic and optochemical properties, various intermolecular interactions can drive the porphyrins into specific assembled structures such as nanowires,5 nanorods,6,7 nanotubes,8,9 and nanodiscs.10 These assemblies are mostly stabilized by van der Waals forces, hydrogen bonds, π–π interactions, and electronic repulsion.11 Therefore, characterizing such interactions of free-base porphyrins and correlating the structures of final assemblies through specific applications are fundamentally important for the design of free-base porphyrin assemblies. Tetraphenylporphyrin (TPP) has a square framework with four phenyl groups located perpendicular to the central ring and two free nitrogen atoms at the center of the ring.12 Since under acidic condition, the two nitrogen atoms undergo protonation,13 various protonated derivatives have been obtained from liquid–liquid interface14–16 and in the gas-phase.17 Such phenomena were investigated by UV-vis spectroscopy and monitoring the displacement of the sorption peaks, which suggested face-to-face stacking of the TPP rings and the formation of J-type aggregates.18 Interestingly, the gas-phase protonated aggregates of TPP reversed into its monomers when exposed to amine vapors. Such electronic spectral behaviors and optical properties of TPP are highly beneficial for gas sensing applications.Detection of molecular species by optical sensing techniques is currently a topic of great interest.19 Thin film-based OWG gas sensors have two key principles: (i) the absorbance of the thin film is directly affected by the interactions with the analytes and (ii) the changes in the intensity of light reflected from the OWG thin film are related to the changes in the absorbance of the sensor, which, in turn, is affected by the interactions with the analytes. Since the major development in planar OWG sensors in the 1980s,20–22 scientists have paid close attention to research and application of OWG sensors in the field of optical communication.23–25 Thin planar OWG sensors have been used for electronic and/or fluorescence detection of clinical analytes and toxic agents.26
Ammonia (NH3) is one of the most common and harmful air pollutants that can significantly endanger human health.27 Humans can smell NH3 gas at concentrations as low as ∼55 ppm.28 Exposure to even 1 ppm NH3 gas may cause irritation of the eyes, throat, and nose. Exposure to concentrations higher than 25 ppm can cause extensive lung damage as well as the burning of eyes and skin, and over 300 ppm can cause immediate danger to life or health.29 Analytical laboratory instruments, such as gas chromatography (GC/MS, MS, and AAS), enable the detection and quantification of NH3 with high sensitivity and resolution.30 However, these techniques suffer from some drawbacks such as they are generally costly, cannot be used in the real field monitoring of analytes, and need experienced operators. The OWG method for analyte detection has several advantages over other types of sensors, such as the potential for high sensitivity, fast response and recovery times, anti-electromagnetic interference, remote controllability, and intrinsically safe detection. Furthermore, this type of sensors can be fabricated at a very low cost.31,32 Herein, based on the changes in the absorption spectrum of TPP and the OWG technique, we examined the performance of a free-base TPP film ammonia sensor modified with gas-phase protonation and demonstrated the synthesis of a gas-phase protonated TPP thin film and its coating on a glass OWG as a sensing layer. H2S gas was used as a gas-phase proton donor owing to its noticeable features such as ease of preparation, proton-richness, and most importantly, its unique gas-phase acidity compared to other hydrides (HCl and HBr). A highly sensitive and fast responding–recovering gas-phase protonated TPP OWG sensor was prepared and applied in the detection of low concentrations of NH3 gas, which yielded a detection limit (40 ppb) lower than that reported for NH3 sensors in literature.33–37
2. Experimental
2.1 Synthesis of 5,10,15,20-tetraphenylporphyrin
Free-base TPP was prepared according to the method developed by Zhang et al.38 Pyrrole was purchased from Sigma-Aldrich (USA) and all the other chemicals (analytical grade) were purchased from Tianjin Kermel Chemical Reagent Co., Ltd (China), and were used without further purification. Propionic acid (1.63 g, 0.022 mol) and benzaldehyde (4.05 mL, 0.04 mol) were added to 180 mL xylene and stirred for 3 h. Pyrrole (2.8 mL, 0.04 mol) was completely dissolved in 20 mL xylene and added to the previous mixture and refluxed for 3 h at 140 °C. Xylene (200 mL) was removed by distillation under reduced pressure, and the crude product was purified by column chromatography (silica gel, CHCl3/CH3OH, 90![[thin space (1/6-em)]](https://www.rsc.org/images/entities/char_2009.gif) :
:![[thin space (1/6-em)]](https://www.rsc.org/images/entities/char_2009.gif) 10), which yielded purple crystals (2.8 g, 45.6%). 1H NMR (Bruker AVANCE DMX400, 400 MHz, CDCl3, USA) δ 8.87 (s, 8H), 8.26–8.23 (m, 8H), 7.80–7.74 (m, 12H), −2.73 (s, 2H).
10), which yielded purple crystals (2.8 g, 45.6%). 1H NMR (Bruker AVANCE DMX400, 400 MHz, CDCl3, USA) δ 8.87 (s, 8H), 8.26–8.23 (m, 8H), 7.80–7.74 (m, 12H), −2.73 (s, 2H).
2.2 Fabrication and characterization of the film
The gas-phase protonated TPP film OWG sensor was prepared by the following method: the sensing element was coated on a glass slide (76 mm × 26 mm × 1 mm, microscopy slide, Citotest Labware Manufacturing Co., Ltd., China) by spin-coating. Before coating, the glass slide (contains various oxides including Na2O, CaO, and SiO2) was subjected to a potassium-ion (K+) exchange process via the thermal ion-exchange method,39 and the glass was immersed into molten KNO3 at 400 °C for 40 min. The net index depends on the molar volume, ionic polarizability, and stress state created by the substitution. In the case of K+–Na+ exchange, as the polarizability of K+ is comparably higher than that of Na+ on glass, K+ can be easily incorporated into glass (≈1–2 μm deep), and the accompanying surface index change is lower (n ≤ 0.01) along with a smaller diffusion rate.40 The TPP solution (0.07 wt%) was then coated onto the surface of the K+-exchanged glass OWG by using a spin-coater at a rotation speed of 1850 rpm for 30 s. The coated sample was heated at 60 °C for 10 min to allow desorption of any solvent trapped in the film, and then dried in a vacuum oven for 24 h at room temperature. Finally, it was exposed to standard dry H2S gas (100 ppm) for 2 min to induce the formation of gas-phase protonated TPP film OWG sensor, and then flushed with pure nitrogen gas (99.99%) for 2 min to clean the thin-film surface (see Fig. 1).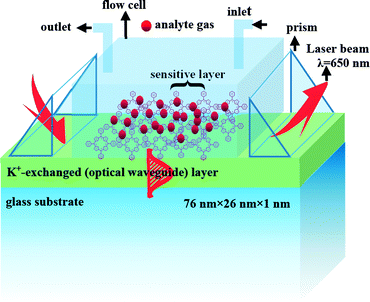 | ||
| Fig. 1 Schematic illustration of a setup for gas-phase protonated TPP OWG gas sensing spectroscopy and an idealized electric distribution of the TE0 mode. | ||
The changes in the refractive index, thickness, porosity, absorbance, and attenuation of the TPP thin film after exposure to 100 ppm H2S gas were examined. Five different points on the TPP film surface were monitored. Mean thickness and refractive index were determined using an SGC-10 ellipsometer, the porosity of the film was calculated from Yoldas' expression,41 and the attenuation of the protonated TPP film due to absorption and scattering was measured by using the cut-back method.42 All the results are summarized in Table 2.
A theoretical calculation indicates that a 113 nm-thick film could support the guiding mode of the transverse electric (TE0) mode.43 Propagation of the TE0 mode in the TPP film OWG was then examined by prism coupling of a 650 nm laser beam. Fig. 1 shows a schematic illustration of the OWG spectroscopy setup and the idealized electric distribution of the TE0 mode. As shown in Fig. 1, when the film is irradiated with a laser beam, the OWG mode can be excited in the film, and a streak is observed on the film surface along the traveling path of the TE0 mode.
In the TE0 mode, the protonated TPP film waveguide on a glass substrate was calculated with Runge–Kutta method expressed by the following equation:44
 | (1) |
2.3 Gas sensing measurements
The gas sensing apparatus46 consisted of the protonated TPP film OWG sensor, a compressed air source, a red semiconductor laser beam (650 nm), a flow meter, a reflector, a diffusion tube, a light detector, and a recorder. The protonated TPP film OWG sensor was attached to the prism in an index matching fluid (glass prism, n = 1.75, matching fluid of diiodomethane, n = 1.74), and irradiated by light, and then fixed to the detection cell. The intensity of the reflected light was detected by a light detector, and the signal was recorded by a computer. For each measurement, a new syringe was used to inject 20 cm3 of gas sample into the flow cell which was then vented out. In order to carry the sample gas to the sensitive layer, dry air was directed through the cell at a constant rate of 50 cm3 min−1. All measurements were performed at room temperature.Standard H2S gas was obtained by reacting a given amount of FeS with HCl at room temperature and normal pressure, and the produced H2S gas was allowed to flow into a standard vessel (600 cm3). Standard NH3 gas was obtained by vaporizing a given amount of ammonia solution (25–28%) inside a standard vessel (600 cm3). The concentrations of H2S and NH3 gases were confirmed using commercial H2S and NH3 gas detection tubes (working range of 2–200 ppm, Gastec, Beijing Municipal Institute). Different amounts of standard NH3 gas were diluted with dry air in a second standard vessel (600 cm3) in order to obtain the desired concentrations. Using this standard vessel-dilution method, a very low concentration of NH3 (0.1 ppm) could be obtained.
3. Results and discussion
3.1 Characterization of protonation of TPP film under gas-phase condition
The film was characterized by optical absorption (UV-1780, Shimadzu Technology Co. Ltd, China) and 1H NMR spectroscopy. Atomic force microscopy (AFM) was performed using a Multimode 8 system (Bruker, USA) to characterize the surface morphologies of the TPP thin film before and after exposure to the analytes.The UV/vis absorption spectra was performed to characterize the protonated TPP film under gas-phase condition before and after exposure to the analytes, as shown in Fig. 2 and 3. We can see that before exposure to H2S and HCl, the typical absorption spectrum of TPP contains a Soret band at 436 nm and Q bands at 522, 557, 596, and 652 nm (see Fig. 2). The TPP thin film absorption spectra show a significant change after exposure to H2S and HCl gases. As we can see from Fig. 2, first, the Soret band at 436 nm shifted to 461 nm when the film was exposed to analytes and demonstrated a pronounced broadening. Second, there a slight increase in intensity of the peak observed at 365 nm, while the peak at 677 nm increased obviously. The red-shifting of the Soret band suggests that when the TPP thin film was exposed to acidic gases, the porphyrin monomers underwent J-type aggregation, wherein the monomers were arranged in a head-to-tail fashion.47 However, no noticeable differences in the intensities of the Soret band or Q bands were observed in the UV/vis spectra of the TPP film after exposure to amine vapors, as shown in Fig. 3.
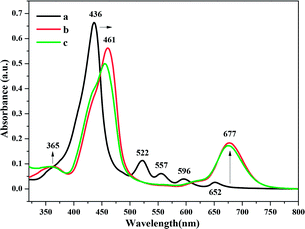 | ||
| Fig. 2 Absorbance spectra of (a) TPP thin film and after exposure to 100 ppm (b) H2S and (c) HCl gases. | ||
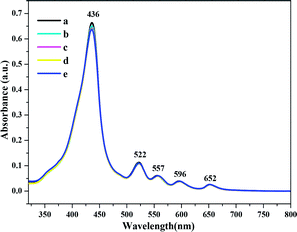 | ||
| Fig. 3 Absorbance spectra of (a) TPP thin film and after exposure to saturated vapors of (b) ammonia, (c) methylamine, (d) dimethylamine, and (e) trimethylamine. | ||
The degree of deprotonation in gas-phase reactions, including proton transfer reactions, is measured in terms of gas-phase acidity, defined as the enthalpy of deprotonation (ΔHacid). Further, Fig. 2 indicates that there were minor differences in the intensities of the absorbance peaks for the sensitive film exposed to HCl and H2S gases. Although the bonding energy of HCl is higher than that of H2S in aqueous solution, as shown in Table 1, both the ΔHacid and molar refractivity (RD) of H2S are greater than those of HCl, with the RD of a gas being proportional to its adsorption.48 This indicates that a greater number of H2S gas molecules were adsorbed onto the thin film surface compared to HCl gas, and provided protons to the TPP monomers.
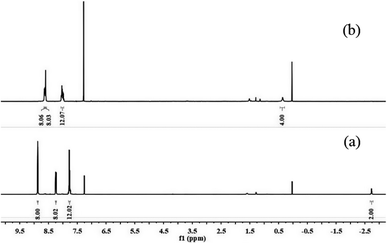
In order to elucidate the protons that were transferred from the gas-phase to the TPP monomer, 1H NMR spectroscopy was performed on the TPP solution (0.07 wt%) in deuterated chloroform (CDCl3) after the treatment of the active TPP monomer with the analyte gas. The injection of high concentration of H2S gas (≈104 ppm) caused a noticeable change in the 1H NMR spectrum of the TPP thin film, as shown in Fig. 4. Fig. 4 presents the 1H NMR spectral data of the neutral and protonated forms of TPP. In CDCl3, TPP exhibited a chemical shift of −2.73 ppm, which is related to the pyrrolic NH protons (see Fig. 4a).51 However, for H2S treatment, the pyrrolic NH protons resulted in a shift of 0.26 ppm (see Fig. 4b). In addition, the broad β-pyrrolic CH resonance shifted from 7.72 ppm to 8.01 ppm. At the same time, the two resonances at 8.25 ppm and 8.85 ppm (see Fig. 4a) merged into a single resonance observed at 8.65 ppm (see Fig. 4b). These changes indicated that strong hydrogen bonding was responsible for the up-field shift in the 1H NMR resonance arising from the inner NH protons.52
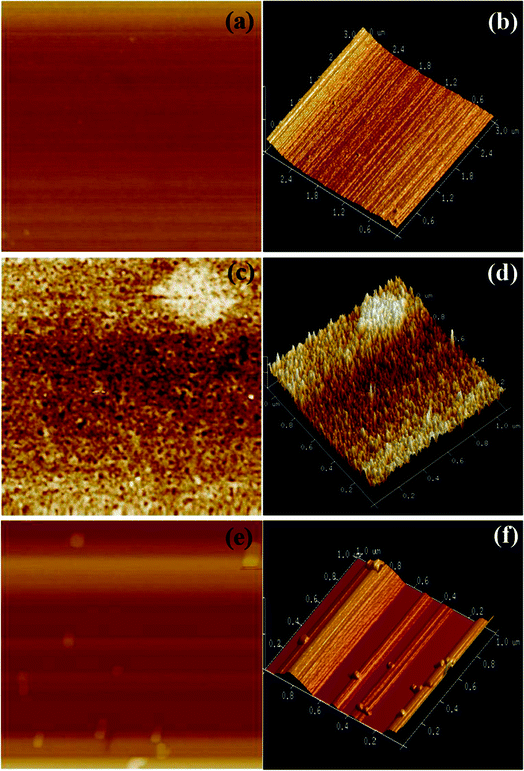
The AFM images of the TPP-coated glass slide were obtained in the tapping mode both before and after exposure to H2S and NH3 gases. We can see from Fig. 5a and b that the film is relatively dense and smooth before exposure to H2S. After exposure of H2S gas, nanosized aggregates were observed on the film surface (see Fig. 5c and d), whereas no such aggregates were detected in the unexposed TPP film. It is evident from the images that the TPP monomers on the film surface aggregated in the gas-phase after exposure to H2S gas. Furthermore, the high-magnification 3D view (see Fig. 5d) shows that the TPP aggregates grew vertically, and bundles of small nanorods of TPP assembled in a parallel manner, producing the nanosized aggregates. This observation is in agreement with that in a previous report.53 However, significant structural changes were observed in the film topography after exposure of the film containing surface aggregates (by exposure of H2S) to NH3 gas (see Fig. 5e and f); the vertical nanorods disappeared and the surface of the film became smooth. This indicates that the aggregates dispersed after exposure to NH3.
3.2 Gas sensing measurement
The gas sensing property of the protonated TPP thin film OWG sensor was evaluated based on the deprotonation of TPP. The protonated film turned from red to blue after exposure to NH3 gas, as shown in Fig. 6. When the TPP film was exposed to H2S gas, significant changes were observed in the visible region, with the Soret band of the TPP film undergoing a red shift from 436 nm to 460 nm and two new Q bands emerging at 364 nm and 677 nm, respectively. At the same time, when the same film was exposed to NH3 gas, the Soret band underwent a blue shift from 460 nm to 436 nm, with the two Q bands splitting into four Q bands; these are characteristic features of the free-base TPP monomer. The absorbance changes are listed in Table 2.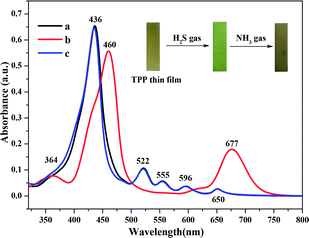 | ||
| Fig. 6 Absorption spectra of (a) TPP film, (b) thin film exposed to H2S gas (100 ppm), and (c) gas-phase protonated thin film exposed to NH3 gas (100 ppm). | ||
| Samples | Refractive index (n) | Thickness (nm) | Absorbance (ΔAbs) | Porosity | Attenuation (dB mm−1) |
|---|---|---|---|---|---|
| a “—” implies no change. | |||||
| TPP film | 1.6324 | 111.95 | — | — | — |
| Protonated TPP film | 1.7757 | 118.31 | 0.057 | 22.68% | 5.42 |
| After exposure to NH3 | 1.6302 | 110.31 | 0 | — | — |
For the OWG sensor, as mentioned above, the thickness, refractive index, porosity, and attenuation of the film are the major factors that affect its intensity. A sensing film with higher refractive index, thickness, and porosity, and lower attenuation reveals higher sensitivity.54 We can see from Table 2 that the refractive index decreased from 1.7757 to 1.6302 due to the decrease in thickness. The remarkable decrease in the refractive index in the excitation of the waveguide mode in the protonated TPP film OWG, which enhanced the inherent sensitivity of the sensor in accordance with the simulated results shown in Fig. 7. Besides, the NH3 gas molecule was small enough to penetrate the protonated TPP pores several tens to hundred nanometers in diameter.
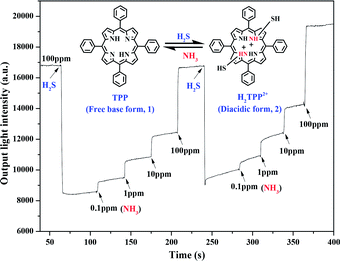
The reversible responses of the protonated TPP thin film OWG sensor to NH3 gas at various concentrations were studied, and the results are presented in Fig. 7. The signal attenuations, defined as α = −10![[thin space (1/6-em)]](https://www.rsc.org/images/entities/char_2009.gif) log(Iammonia/Ihydrogen sulfide),55 corresponding to 100, 10, 1, and 0.1 ppm of NH3, were 4.07, 1.01, 0.57, and 0.24 dB, respectively. The injection of air from the surrounding environment caused a slight disturbance in the signal; however, the disturbance was significantly smaller than the change in the signal in the presence of 100 ppb NH3.
log(Iammonia/Ihydrogen sulfide),55 corresponding to 100, 10, 1, and 0.1 ppm of NH3, were 4.07, 1.01, 0.57, and 0.24 dB, respectively. The injection of air from the surrounding environment caused a slight disturbance in the signal; however, the disturbance was significantly smaller than the change in the signal in the presence of 100 ppb NH3.
The reaction mechanism is shown in Fig. 7. Initially, the H2S gas molecules are adsorbed onto the TPP film OWG primarily in the form of J-aggregates. The exposure of the protonated TPP film OWG sensor to NH3 gas leads to the deprotonation of H2TPP2+, which results in its return to the monomeric state. TPP becomes protonated again when it is exposed to H2S gas. It is clearly seen from Fig. 7 that TPP can be reversibly converted into H2TPP2+ through protonation and deprotonation reactions in the presence of H2S and NH3, respectively. Repeated exposure of the TPP thin film to NH3 and H2S causes the formation of (NH4)2S as a by-product. However, (NH4)2S can be removed by washing the film with water. The protonated TPP film OWG sensor exhibited a strong and fast response, complete reversibility, and excellent repeatability even after several sensing cycles (see Fig. 7). These results confirm that the gas-phase protonated TPP film OWG sensor is a suitable material for the detection of NH3 gas.
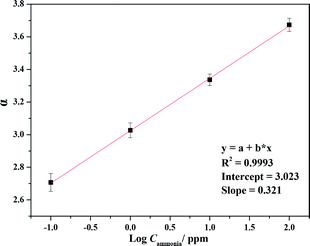
A calibration curve of absorbance as a function of NH3 gas concentration is plotted in Fig. 8. This curve was obtained by plotting the signal (α) of the sensor against the concentration of NH3 gas. The value of α = log(ΔIhydrogen sulfide/Iammonia) is plotted on the ordinate axis; here, Ihydrogen sulfide is the change in the initial intensity of the output light after injection of H2S gas and Iammonia is the highest output light intensity either before or after the injection of NH3 gas into the flow chamber. The relationship between the signal and NH3 concentration was found to be linear. From the data, it can be observed that the response of the sensor to NH3 gas was strongly dependent on NH3 gas concentration, with the response being linear in the range of NH3 concentrations from 100 ppb to 100 ppm (A = (2.59 ± 0.019) + (0.32 ± 0.013)[NH3], R = 0.99).
Table 3 provides a comparison of the ammonia detection performance of the developed sensor with those of the other porphyrin sensors in terms of analytical range and limit of detection (LOD), revealing that the gas-phase protonated TPP film OWG sensor featured a much lower detection limit than other types of porphyrin sensors did. Furthermore, compared to other sensors, the one described herein was easier to fabricate and was reusable for NH3 detection.
| Sensor type | Sensitive element | Analytical range and LODs (ppm) | Ref. |
|---|---|---|---|
| Optical fiber | PDDA/TSPP nanoassembly | 0.5–50 | 56 |
| 0.5 | |||
| QCM | HMZnP networks | 10–3010 | 57 |
| 10 | |||
| Chemiresistive type | Zn-bis-TPP | 5–40 | 58 |
| 5 | |||
| LOR | TiO2 containing TMPyP | 0.1–5 | 59 |
| 0.16 | |||
| Absorption intensity type | Zn(II)TPP-PLA NFM nanoporous | 1–5 | 60 |
| 0.264 | |||
| OWG | Gas-phase protonated TPP | 0.1–100 | This work |
| 0.04 |
4. Conclusions
In summary, TPP monomers underwent protonation when they were exposed to acidic gases. H2S gas acted as a proton donor to the TPP monomers in gas-phase owing to its proton richness, and the sensor was characterized by 1H MNR and AFM. Here, a novel gas-phase protonated TPP film OWG sensor for NH3 gas detection was demonstrated. The sensor was highly sensitive toward NH3 gas, and sensitivity to other amine gases were smaller (see Fig. S1†) then that of NH3. The sensing mechanism was found to be strongly dependent on the changes in the TPP film morphology, which in turn led to changes in the film absorbance. The enhanced absorbance was associated with the presence of aggregate structures on the protonated TPP film surface, and was examined in terms of the changes detected in the reflected light intensity. We successfully detected NH3 gas at a concentration as low as 0.1 ppm. Furthermore, the sensor exhibited a high sensitivity, reversible response, and fast response–recovery times. In addition, the sensor was found to be both inexpensive and reusable and should therefore find wide application in environmental monitoring and detection of poisonous gases in agricultural, industrial, and medical fields. This sensor system can also be utilized as a novel bio-sniffer for sensitive and selective detection of amines found in the environment or those produced by the human body.Conflicts of interest
There are no conflicts to declare.Acknowledgements
This work was supported by the National Natural Science Foundation of China (Grant No. 21765021).References
- Y. Ding, W. H. Zhu and Y. Xie, Chem. Rev., 2016, 117, 2203 CrossRef PubMed
.
- J. H. Lee, H. Jintoku, Y. Okazaki, T. Sagawa, M. Takafuji and H. Ihara, Sol. Energy Mater. Sol. Cells, 2015, 140, 428 CrossRef CAS
.
- M. C. Tsai, C. L. Wang, C. Y. Lin, C. L. Tsai, H. J. Yen, H. C. You and G. S. Liou, Polym. Chem., 2016, 7, 2780 RSC
.
- P. Gao, Z. Chen, Z. Zhao-Karger, J. E. Mueller, C. Jung, S. Klyatskaya, T. Diemant, O. Fuhr, T. Jacob, R. J. Behm, M. Ruben and M. Fichtneret, Angew. Chem., 2017, 56, 10341 CrossRef CAS PubMed
.
- K. Liu, R. Xing, C. Chen, G. Shen, L. Yan, Q. Zou, G. Ma, H. Mçhwald and X. Yan, Angew. Chem., 2015, 127, 510 CrossRef
.
- A. D. Schwab, D. E. Smith, C. S. Rich, E. R. Young, W. F. Smith and J. C. D. Paula, J. Phys. Chem. B, 2003, 107, 11339 CrossRef CAS
.
- D. D. La, A. Rananaware, M. Salimimarand and S. V. Bhosal, ChemistrySelect, 2016, 1, 4430 CrossRef CAS
.
- G. Zhu, Y. Li, H. Zhu, H. Su, S. H. Chan and Q. Sun, ACS Catal., 2016, 6, 6294 CrossRef CAS
.
- F. Song, P. Ma, C. Chen, J. Jia, Y. Wang and P. Zhu, J. Colloid Interface Sci., 2016, 474, 51 CrossRef CAS PubMed
.
- K. K. Ng, J. F. Lovell, A. Vedadi, T. Hajian and G. Zheng, ACS Nano, 2013, 7, 3484 CrossRef CAS PubMed
.
- G. M. Whitesides and B. Grzybowski, Science, 2002, 295, 2418 CrossRef CAS PubMed
.
- J. Wang, Z. Yong, W. Liang, Z. Na, R. Cao, K. Bian, A. Leanne, R. E. Haddad, F. Bai and H. Fan, Nano Lett., 2016, 16, 6523 CrossRef CAS PubMed
.
- P. Roberto, N. Sara, M. Donato, S. Manuela and D. N. Corrado, Chem. Rev., 2017, 117, 2517 CrossRef PubMed
.
- H. Takechi, A. Canillas, J. M. Ribó and H. Watarai, Langmuir, 2013, 29, 7249 CrossRef CAS PubMed
.
- H. Nagatani and H. Watarai, Anal. Chem., 1996, 68, 1250 CrossRef CAS PubMed
.
- S. Wada, K. Fujiwara, H. Monjushiro and H. Watarai, J. Phys.: Condens. Matter, 2007, 19, 1501 CrossRef
.
- S. Jung, J. Seo and S. K. Shin, J. Phys. Chem. A, 2010, 114, 11376 CrossRef CAS PubMed
.
- N. C. Maiti, A. S. Mazumdar and N. Periasamy, J. Phys. Chem. B, 1998, 102, 1528 CrossRef CAS
.
- L. Zheng and S. S. Kenneth, ACS Sens., 2016, 1, 1330 CrossRef
.
- P. L. Smock, T. A. Orofino, G. W. Wooten and W. S. Spencer, Anal. Chem., 1979, 51, 505 CrossRef CAS PubMed
.
- J. F. Giuliani, H. Wohltjen and N. L. Jarvis, Opt. Lett., 1983, 8, 54 CrossRef CAS PubMed
.
- K. Tiefenthaler and W. Lukosz, Opt. Lett., 1984, 10, 137 CrossRef
.
- J. Qin, Y. Zhang, X. Liang, C. Liu, C. Wang, T. Kang, H. Lu, L. Zhang, P. Zhou, X. Wang, B. Peng, J. Hu, L. J. Deng and L. Bi, ACS Photonics, 2017, 4, 1403 CrossRef CAS
.
- A. Yamaguchi, K. Hotta and N. Teramae, Anal. Chem., 2009, 81, 105 CrossRef CAS PubMed
.
- K. Hotta, A. Yamaguchi and N. Teramae, ACS Nano, 2012, 6, 1541 CrossRef CAS PubMed
.
- A. R. Chris, B. S. Stephanie, J. F. Mark, P. G. Joel and S. L. France, Anal. Chem., 1999, 71, 433 CrossRef
.
- M. Palanisamy and S. J. Abraham, Sens. Actuators, B, 2012, 174, 74 CrossRef
.
- American Industrial Hygiene Association, Ammonia, Hygienic Guide Series, Detroit, Michigan, 1971 Search PubMed
.
- Health and safety executive, Guidance note EH40/93 occupational exposure limits, HMSO, London, 1993 Search PubMed
.
- R. Nieto, A. G. Calder, S. E. Anderson and G. E. Lobley, J. Mass Spectrom., 2015, 31, 289 CrossRef
.
- A. Yimit, A. G. Rossberg, T. Amemiya and K. Itoh, Talanta, 2005, 65, 1102 CrossRef CAS PubMed
.
- K. Hotta, A. Yamaguchi and N. Teramae, ACS Nano, 2012, 6, 1541 CrossRef CAS PubMed
.
- P. Muthukumar and S. A. John, Sens. Actuators, B, 2012, 174, 74 CrossRef CAS
.
- L. Q. Nguyen, P. Q. Phan, H. N. Duong, C. D. Nguyen and L. H. Nguyen, Sensors, 2013, 13, 1754 CrossRef CAS PubMed
.
- J. Enon, A. Tuantranont, T. Kerdcharoen and C. Wongchoosuk, RSC Adv., 2017, 7, 16885 RSC
.
- X. Liu, N. Chen, B. Han, X. Xiao, G. Chen, I. Djerdj and Y. Wang, Nanoscale, 2015, 7, 14872 RSC
.
- J. Wei, B. Liang, Q. Cao, C. Mo, Y. Zheng and X. Ye, RSC Adv., 2017, 7, 33510 RSC
.
- Z. Zhang, J. Zhu, Q. Han, H. Cui, H. Bi and X. Wang, Appl. Surf. Sci., 2014, 321, 404 CrossRef CAS
.
- R. Salmio, J. Saarinen, J. Turunen and A. Tervonen, Appl. Phys. Lett., 1995, 66, 917 CrossRef CAS
.
- H. Ablat, A. Yimit, M. Mahmut and K. Itoh, Anal. Chem., 2008, 80, 7678 CrossRef CAS PubMed
.
- P. Nizamidin, A. Yimit, A. Abdurrahman and K. Itoh, Sens. Actuators, B, 2013, 176, 460 CrossRef CAS
.
- H. Nishihara, M. Haruna and T. Suhara, Integrated Optics, 1st edn, 1987 Search PubMed
.
- H. Yanagi, K. Itoh, M. Murabayashi and Z. M. Qi, J. Lightwave Technol., 2002, 18, 1106 Search PubMed
.
- A. Yimit, K. Itoh and M. Murabayashi, Sens. Actuators, B, 2003, 88, 239 CrossRef CAS
.
- P. Nizamidin, A. Yimit, J. D. Wang and K. Itoh, Thin Solid Films, 2012, 520, 6250 CrossRef CAS
.
- P. Nizamidin, A. Yimit, A. Abdurrahman and K. Itoh, Sens. Actuators, B, 2011, 76, 460 Search PubMed
.
- J. Ma, W. Zhang, Z. Li, Q. Lin, J. Xu and Y. Han, Cryst. Growth Des., 2016, 16, 1942 CAS
.
- S. I. T. Kondo and I. Abe, Absorb Science, ed. G. X. Li, Chemical Industry Press, Beijing, 3rd edn, 2003 Search PubMed
.
- L. A. Curtiss, C. Jones, G. W. Trucks, K. Raghavachari and J. A. Pople, J. Chem. Phys., 1990, 93, 2537 CrossRef CAS
.
- J. S. Brian and R. Leo, J. Phys. Chem., 1991, 95, 10551 CrossRef
.
- Y. Zhang, M. X. Li, M. Y. Lü, R. H. Yang, F. Liu and K. A. Li, J. Phys. Chem. A, 2005, 109, 7442 CrossRef CAS
.
- Y. Saegusa, T. Ishizuka, Y. Shiota, K. Yoshizawa and T. Kojima, J. Org. Chem., 2017, 82, 322 CrossRef CAS PubMed
.
- P. Kalimuthu and S. A. John, ACS Appl. Mater. Interfaces, 2010, 2, 3348 CAS
.
- N. Patima, Y. Abliz and I. Kiminori, New J. Chem., 2016, 40, 295 RSC
.
- N. Hiroshi, H. Masamitsu and S. Toshiaki, Integrated Optical Circuit, Science Press, Beijing, 2005 Search PubMed
.
- S. Korposh, S. Kodaira, R. Selyanchyn, F. H. Ledezma, S. W. James and S. W. Lee, Opt. Laser Technol., 2018, 101, 1 CrossRef CAS
.
- J. H. Park, J. H. Ko, S. Hong, Y. J. Shin, N. Park, S. Kang, S. M. Lee, H. J. Kim and S. U. Son, Chem. Mater., 2015, 27, 5845 CrossRef CAS
.
- K. Garg, A. Singh, C. Majumder, S. K. Nayak, D. K. Aswal, S. K. Gupta and S. Chattopadhyay, Org. Electron., 2013, 14, 1189 CrossRef CAS
.
- D. Tiwari, K. Mullaney, S. Korposh, S. W. James, S. W. Lee and R. P. Tatam, Sens. Actuators, B, 2017, 242, 645 CrossRef CAS
.
- M. Hu, W. Kang, Z. Li, S. Jie, Y. Zhao, L. Li and B. Cheng, J. Porous Mater., 2016, 23, 911 CrossRef CAS
.
Footnote |
| † Electronic supplementary information (ESI) available. See DOI: 10.1039/c7ra11643h |
| This journal is © The Royal Society of Chemistry 2018 |

