 Open Access Article
Sweeping-micelle to solvent stacking for the on-line preconcentration and determination of organic acids in Angelica sinensis by capillary electrophoresis†
Xiumin Yang ,
Lin Hao,
Shuaihua Zhang,
Chun Wang
 and
Zhi Wang*
Department of Chemistry, College of Science, Agricultural University of Hebei, Baoding 071001, China. E-mail: wangzhi@hebau.edu.cn; zhiwang2013@aliyun.com; Fax: +86-312-7521513; Tel: +86-312-7521513
First published on 20th February 2018
Abstract
A novel on-line two-step stacking preconcentration method by sweeping plus micelle to solvent stacking in capillary zone electrophoresis was developed for the simultaneous determination of three organic anions (vanillic acid, ferulic acid and cinnamic acid) in Angelica sinensis. Hexadimethrine bromide was used for electroosmotic flow reversal. The main experimental parameters that affected the separation and sensitivity were investigated and optimized. The best separation was achieved in 50 mM ammonium acetate (pH 12.0) containing 50% methanol (v/v) under a negative voltage of 20 kV. The micellar solution was a mixed solution comprised of 12 mM cetyltrimethyl ammonium bromide and 20 mM ammonium acetate. After injecting a short plug (0.5 psi, 30 s) of micellar solution, the sample was introduced into the capillary at 0.5 psi for 45 s. Under the optimal conditions, the sensitivity enhancement factors obtained by the developed method were between 42 and 77. The intra-day (n = 6) and inter-day (n = 5) precisions of the method expressed as their relative standard deviations were found to be less than 7.2%. The Angelica sinensis sample was pulverized and then refluxed in 95% ethanol and filtered. After an aliquot of the extractant was dried, it was reconstituted in 20 mM ammonium acetate for capillary electrophoresis analysis. The recoveries of the analytes by this method for the analysis of Angelica sinensis were in the range of 94.4% to 108.4%.
1. Introduction
Angelica sinensis is a well-known traditional Chinese medicine (TCM) used for thousands of years for treating gynecological diseases such as female anemia, menoxenia and amenorrhea.1 The active ingredients most often associated with the pharmacological properties of Angelica sinensis are organic acids including ferulic acid, vanillic acid and cinnamic acid, which are able to inhibit platelet aggregation and serotonin release;2,3 their levels are frequently used as an indicator of the quality of Angelica sinensis.4,5Many analytical tools have been used for the analysis of the bioactive components in TCMs to guarantee their quality. Organic acids, as the main bioactive components of TCMs, are usually determined by high performance liquid chromatography (HPLC),6–9 HPLC-fingerprint,10 ultra-performance liquid chromatography-quadrupole/time-of-flight with partial least squares-discriminant analysis,11 gas chromatography (GC)-mass spectrometry9 and capillary electrophoresis (CE).12–14 Compared with HPLC and GC, CE has advantages such as short analysis time and high separation efficiency, almost organic solvent-free analysis, and small sample amount requirements. Therefore, CE has become more and more popular for the analysis of the bioactive components in TCMs. Nevertheless, due to the short optical path length across the capillary, the main drawback of CE is its poor detection sensitivity with ultraviolet detection. Therefore, various on-line sample preconcentration or stacking methods prior to CE have been established (e.g., sweeping, dynamic pH junction, large volume sample stacking (LVSS) transient isotachophoresis and micelle to solvent stacking (MSS)).15,16
MSS was first introduced by Quirino in 2009 and relies on the change in the direction of the effective electrophoretic mobility of the charged analytes in the presence of organic solvents and micelles.17 It is a relatively new on-line CE preconcentration technique and has been applied for the detection of cations (antipsychotic drugs, β-blockers, tricyclic antidepressant medicines and alkaloids, as well as herbicides).18 Thereafter, when compared with that of MSS alone, further improvements in the detection sensitivity were reported by coupling it with sweeping19–21 or field enhanced sample injection22–25 or both.26,27 In 2011, for anionic analytes, the new two-step stacking by sweeping and MSS using cationic micelles in co-electroosmotic flow (EOF) was developed.28 The co-EOF condition where the direction of EOF is the same as the anions was satisfied by a positive dynamic coating of a fused silica capillary using hexadimethrine bromide (HDMB). In such a process, the background solution (BGS) contained organic solvent and the sample solution was devoid of micelles. A cationic micellar solution was injected before the sample solution and a negative voltage was applied. The analytes in the micelle-free sample zone were swept by the micelles brought to the MSS boundary where the second stacking step was induced by the presence of the organic solvent in BGS. However, the study28 mainly focused on the stacking mechanism of the proposed method using hypolipidaemic drugs, anti-inflammatory drugs and herbicides as the model analytes, and the enrichment factors for the analytes were only about 20. So far, the applications of sweeping-MSS for other anionic analytes have not been investigated.
In this study, we report a two-step on-line stacking technique, MSS coupled with sweeping, to analyze three anionic organic acids named vanillic acid, ferulic acid and cinnamic acid found in Angelica sinensis. The experimental variables that may affect the strategy are investigated. The developed method is simple, sensitive and suitable for the determination of the organic acids in TCM.
2. Experimental
2.1. Reagents
Organic standards of vanillic acid, ferulic acid and cinnamic acid (all 98% pure) were purchased from Tianjin Heowns Biochem Technologies. Sinapic acid (98%), cetyltrimethyl ammonium bromide (CTAB) and hexadimethrine bromide (HDMB) (94%) were purchased from Sigma-Aldrich (St. Louis, MO, USA). Angelica sinensis was obtained from Yubaotang Pharmacy (Baoding, China). Ammonium acetate, sodium hydroxide, hydrochloric acid, boracic acid and HPLC-grade methanol were purchased from Kaitong Chemical Reagent Co., Ltd. (Tianjin, China). All reagents were of analytical grade and used without further purification. All the solvents were filtered through a 0.45 μm Micro Science membrane filter (Tianjin Automatic Science Instrument Co., Ltd. Tianjin, China). The water used throughout the study was double-distilled using an SZ-93 automatic double-distiller (Shanghai Yarong Biochemistry Instrumental Factory, Shanghai, China).A mixed stock solution containing vanillic acid, ferulic acid and cinnamic acid (50 μg mL−1 each), and stock solutions of the internal standard (IS) sinapic acid at 50 μg mL−1 and 1.0 mg mL−1 were prepared in absolute ethanol and stored in a refrigerator at 4 °C. A series of standard solutions were prepared by mixing an appropriate amount of the stock solutions with 20 mM ammonium acetate after the stock solution was dried under a gentle stream of nitrogen at room temperature. The BGS was 50 mM ammonium acetate (pH 12.0) containing 50% methanol (v/v), and the micellar solution was 20 mM ammonium acetate containing 12 mM CTAB. Both BGS and the micellar solution were freshly prepared daily and sonicated for 10 min prior to use.
2.2. Apparatus
All CE experiments were performed on a Beckman P/ACE MDQ Capillary Electrophoresis System (Fullerton, CA, USA) equipped with an auto sampler and a diode array detector. An uncoated fused-silica capillary (Yongnian Ruifeng Optical Fiber Factory, Hebei, China) of 50 cm (effective length, 41.5 cm) × 75 μm i.d. was used throughout the experiments. Data acquisition and instrument control were carried out with Beckman P/ACE MDQ 32 Karat software. A PHS-3C pH meter (Hangzhou Dongxing Instrument Factory, Hangzhou, China) was used for the pH measurements. Conductivity measurements were made using a conductivity meter purchased from Mettler-Toledo instruments (Shanghai) Co., Ltd.2.3. Preparation of the samples
The dried roots of the Angelica sinensis sample were pulverized. 400 mg of Angelica sinensis powder was weighed and 500 μL of IS stock solution (1.0 mg mL−1) was added. Next, the powder was refluxed in 20 mL of 95% ethanol for 30 min and then filtered. The residue was refluxed and filtered one more time as described above. Then, all the solvent extracts were combined and transferred into a 50 mL volumetric flask and made to the mark with 95% ethanol. 200 μL of the resulting solution of the Angelica sinensis sample was evaporated to dryness under a gentle stream of nitrogen at room temperature. Then, the sample solution was obtained by dissolving the residues in 200 μL of 20 mM ammonium acetate. The sample solution was filtered through a 0.45 μm syringe filter prior to the CE experiments.2.4. General CE procedures
Before its first use, the new capillary was sequentially flushed with methanol (10 min), water (5 min), 0.1 M sodium hydroxide (10 min), water (5 min) and 1% HDMB (60 min) at 20 psi. At the start of each day, the capillary was flushed with 1% HDMB (10 min), water (5 min) followed by BGS (5 min). Between runs, the capillary was flushed in sequence with 1% HDMB (3 min), water (3 min) and BGS (3 min).The optimized experimental conditions for CE with stacking were as follows: after preconditioning the capillary with BGS, the micellar solution was introduced at 0.5 psi for 30 s. Then, the sample solution prepared in 20 mM ammonium acetate was injected at 0.5 psi for 45 s. The temperature was set at 25 °C and a negative voltage of 20 kV was applied throughout this procedure. The detection wavelength for the three analytes was set at 215 nm.
2.5. Determination of the sensitivity enhancement factor
The focusing efficiency of the current method was assessed by a comparison of its performance under the optimum conditions with that of normal capillary zone electrophoresis (CZE). The sensitivity enhancement factor (SEF) in terms of the peak height was obtained by simply determining the ratio of the peak height obtained by the current method to that obtained by normal CZE injection and then multiplying by the concentration dilution factor.293. Results and discussion
3.1. Optimization of the stacking conditions
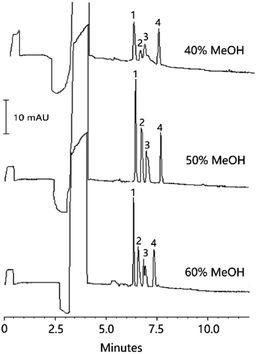
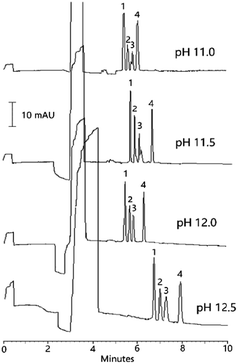
In our study, the concentration of both ammonium acetate and methanol in BGS, the pH value of BGS, the concentration of both CTAB and ammonium acetate in the micellar solution, and the injection time for both the micellar solution and sample solution were investigated and optimized. A mixed solution of the organic acids and IS (5.0 μg mL−1 each) was used for the optimization.Ohm's law plot was used for the determination of the maximum voltage that can be utilized for BGS. Fig. S2† indicates that when the voltage was between −5 kV and −20 kV, there was a linear relationship between the applied voltage and the produced current; when the voltage was between −20 kV and −25 kV, the produced current became much higher than that predicated by the Ohm's law. Hence, −20 kV was selected as separation voltage.
The conductivity of the micellar solution and sample matrix should be lower than or approximately equal to that of BGS.17 In this study, when the concentration of CTAB was kept at 12 mM, five different ammonium acetate concentrations (0, 20, 40, 80 and 120 mM) in the micellar solution were investigated (Fig. S1C†), and their corresponding micellar solution conductivities were 0.338, 2.39, 4.16, 7.62 and 11.76 mS cm−1, respectively. As a result, the best separation and focusing efficiency was obtained when 20 mM ammonium acetate was used. Under this condition, the conductivity of the micellar solution (NH4Ac 20 mM, CTAB 12 mM) was close to that of BGS (2.72 mS cm−1). The five different ammonium acetate concentrations (5, 10, 20, 30 and 40 mM) in the sample matrix were also investigated, and their corresponding sample matrix conductivities were 0.543, 1.06, 2.05, 3.02 and 3.82 mS cm−1, respectively. It can be seen from Fig. S1D† that the peak heights of all the three organic acids increased when the ammonium acetate concentration was increased from 5 to 20 mM. Then, when the ammonium acetate concentration was further increased from 20 to 40 mM, the peak heights remained constant for ferulic acid, slightly increased for cinnamic acid and slightly decreased for vanillic acid. On the basis of the above results, 20 mM ammonium acetate was selected as the sample matrix.
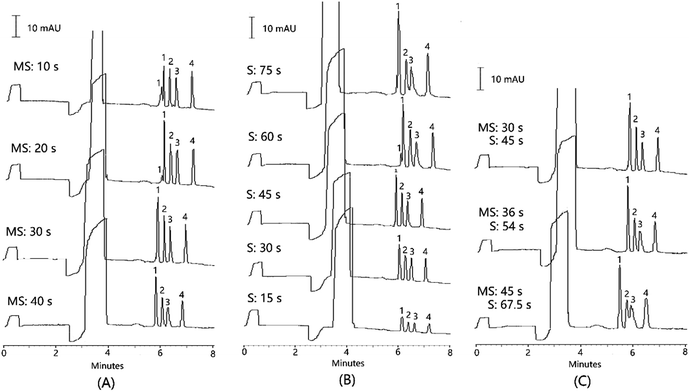
When the injection time for the micellar solution was maintained at 0.5 psi for 30 s, the sample injection time in the range of 15 to 75 s was investigated. The peak heights for the three analytes increased with the extension of the injection time of the sample solution from 15 to 45 s. However, when the injection time was longer, the micellar solution was relatively insufficient, leading to a poor stacking efficiency for vanillic acid (Fig. 3B). Besides, a declines in both the resolution between ferulic acid and IS, and the separation efficiencies for all the compounds was observed when the injection time was increased from 45 to 75 (Table S3†). As a result, the injection time ratio of the micellar solution to sample solution was maintained at 2![[thin space (1/6-em)]](https://www.rsc.org/images/entities/char_2009.gif) :
:![[thin space (1/6-em)]](https://www.rsc.org/images/entities/char_2009.gif) 3. When the injection time for both the micellar solution and sample solution were further increased simultaneously, both the resolution between the ferulic acid and IS and the separation efficiency were seriously decreased (Fig. 3C and Table S4†). As a result, the micellar solution and sample solution injections were selected at 0.5 psi for 30 s and 45 s, respectively.
3. When the injection time for both the micellar solution and sample solution were further increased simultaneously, both the resolution between the ferulic acid and IS and the separation efficiency were seriously decreased (Fig. 3C and Table S4†). As a result, the micellar solution and sample solution injections were selected at 0.5 psi for 30 s and 45 s, respectively.
3.2. Quantitative analysis
The calibration curve, limits of detection (LODs), correlation coefficient (r2) and repeatability were studied under the above optimized conditions for the analysis of the three organic acids. The results are summarized in Table 1. The corrected peak area was defined as the ratio between the peak area and the migration time. A series of standard sample solutions containing each of the organic acids at nine concentration levels of 0.1, 0.25, 0.5, 1.0, 2.5, 5.0, 10.0, 15.0 and 20.0 μg mL−1, as well as 5.0 μg mL−1 IS each were prepared for obtaining the calibration curves. The calibration curves were obtained by plotting the mean relative corrected peak areas (corrected peak area of the analyte/corrected peak area of the IS) versus the concentrations of the individual analyte with three replicate measurements. As a result, a good linear relationship (r2 > 0.9989) was obtained for all the studied organic acids. LOD (S/N = 3) for vanillic acid, ferulic acid and cinnamic acid was 0.05, 0.05 and 0.06 μg mL−1, respectively. The intra- and inter-day repeatabilities expressed as relative standard deviations (RSDs) were studied using the 2.5 μg mL−1 standard. The resulting intra-day (n = 6) and inter-day (n = 5) RSDs of the peak areas ranged from 4.1 to 5.3% and 5.8 to 7.2%, respectively.| Analyte | Linear range (μg mL−1) | Linear equationa | r2 | LOD (μg mL−1) | RSDb (%) | |
|---|---|---|---|---|---|---|
| Intra-day (n = 6) | Inter-day (n = 5) | |||||
| a y: The relative corrected peak area = corrected peak area of analyte/corrected peak area of IS and x: concentration.b The concentration of each organic acid was 2.5 μg mL−1. The other conditions were the optimum conditions. | ||||||
| Vanillic acid | 0.1–20.0 | y = 0.245x | 0.9998 | 0.06 | 4.1 | 5.8 |
| Ferulic acid | 0.1–20.0 | y = 0.2228x | 0.9998 | 0.05 | 4.0 | 7.1 |
| Cinnamic acid | 0.1–20.0 | y = 0.2771x | 0.9989 | 0.05 | 5.3 | 7.2 |
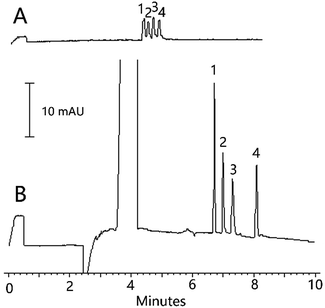
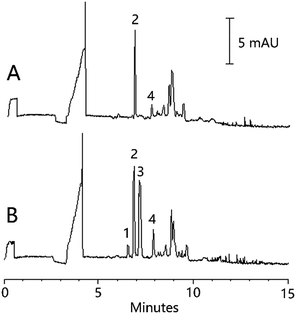
For the normal CZE analysis, the best separation was achieved in 150 mM H3BO3 (pH 8.5) at a voltage of 20 kV at 25 °C. The mixed standard solution containing the three analytes and IS (25.0 μg mL−1 each) was prepared in 150 mM H3BO3 (pH 8.5). Then, it was injected into the capillary at 0.5 psi for 3 s. The electropherogram for the analysis of the organic acids by normal CZE is shown in Fig. 4A, and the result obtained by the current method with the sample solution containing the three analytes and IS(5.0 μg mL−1 each) is presented in Fig. 4B. When compared with those for the normal CZE injection procedure, 77, 52 and 42-fold sensitivity enhancements for vanillic acid, ferulic acid and cinnamic acid, respectively were achieved using the current method.
3.3. Real sample analysis
The developed stacking preconcentration method was used for the analysis of three organic acids in the commonly used TCM, Angelica sinensis. The results are shown in Table 2. The Angelica sinensis sample was found to contain ferulic acid and cinnamic acid at 0.74 mg g−1 and 0.09 mg g−1, respectively. No vanillic acid was found in the sample. The determined recoveries of the analytes for the method were in the range of 94.4% to 108.4% with RSDs between 4.5% and 7.5%. Fig. 5 shows the typical chromatograms obtained for the Angelica sinensis sample before and after being spiked with each of the organic acids.| Ingredient | Content (mg g−1) | Spiked (mg g−1) | Found (mg g−1) | Recovery (%) | RSD (%) (n = 3) |
|---|---|---|---|---|---|
| a ND, not detected. | |||||
| Vanillic acid | ND | 0.125 | 0.118 | 94.4 | 7.5 |
| 0.25 | 0.263 | 105.2 | 7.3 | ||
| Ferulic acid | 0.74 | 0.125 | 0.861 | 96.8 | 4.5 |
| 0.25 | 1.011 | 108.4 | 5.7 | ||
| Cinnamic acid | 0.09 | 0.125 | 0.209 | 95.2 | 6.2 |
| 0.25 | 0.348 | 103.2 | 6.4 | ||
3.4. A comparison with other analytical techniques
The performance of the current method based on sweeping-MSS-CZE used for the determination of organic acids was compared with that of the relevant methods previously reported in the literature. As listed in Table 3, the two-step stacking method is more sensitive than one-step stacking13 or no stacking methods.12,14 In addition, the obtained LOD values were comparable to those of the HPLC methods reported by other authors with DAD detection.6,7,9 However, the separation time of CE is much shorter than that of HPLC.| Method | Sample | Linearity (μg mL−1 or μg g−1) | LOD (μg mL−1 or μg g−1) | RSD (%) | Analysis time (min) | Ref. |
|---|---|---|---|---|---|---|
| HPLC | Rat plasma | 0.037–3.7 | 0.012 | <8.1 | 25 | 6 |
| HPLC | Plants of Lamiaceae family | 0.5–20 | 0.02 | <7.06 | 45 | 7 |
| HPLC | Aromatic plants | 0.09–7.21 | 0.05 | 3.2–6.9 | 110 | 9 |
| MEKC | Tomato | 1–20 | 0.8–3.8 | <4.4 | 15 | 14 |
| CZE | Brassica oleracea | 1–500 | 1.1–2.3 | <3.6 | 6.5 | 12 |
| LVSS-CZE | Wine | 0.9–4.0 | 0.18 | <6.9 | 20 | 13 |
| Sweeping-MSS-CZE | Angelica sinensis | 0.1–20 | 0.05–0.06 | 4.0–7.2 | 10 | This study |
4. Conclusions
The sweeping-MSS method was developed for the determination of three organic acids found in Angelica sinensis. The technique used for the analysis of anions was successfully applied in the TCM sample. In comparison with that of normal CZE, the detection sensitivity for the organic acids was enhanced 42–77-fold. The present method is suitable and favourable for the analysis of organic acids on account of its cost effectiveness, rapidity, simplicity and sensitivity.Conflicts of interest
There are no conflicts of interest to declare.Acknowledgements
The authors acknowledge the financial support of the Natural Science Foundation of Hebei Province (B2016204146) and the Science and Technology Foundation of Hebei Agricultural University (LG201607).References
- W. L. Wei, R. Zeng, C. M. Gu, Y. Qu and L. F. Huang, J. Ethnopharmacol., 2016, 190, 116–141 CrossRef CAS PubMed.
- M. Jin, K. Zhao, Q. Huang, C. Xu and P. Shang, Carbohydr. Polym., 2012, 89, 713–722 CrossRef CAS PubMed.
- D. Zhou, N. Li, Y. Zhang, C. Yan, K. Jiao, Y. Sun, H. Ni, B. Lin and Y. Hou, RSC Adv., 2016, 6, 97302–97312 RSC.
- K. Zhang, G. Yan, A. Zhang, H. Sun and X. Wang, RSC Adv., 2017, 7, 28876–28888 RSC.
- G. H. Lu, K. Chan, K. Leung, C. L. Chan, Z. Z. Zhao and Z. H. Jiang, J. Chromatogr., A, 2005, 1068, 209–219 CrossRef CAS PubMed.
- J. Qi, X. Jin, L. Huang and Q. Ping, Biomed. Chromatogr., 2007, 21, 816–822 CrossRef CAS PubMed.
- A. Skendi, M. Irakli and P. Chatzopoulou, Journal of Applied Research on Medicinal and Aromatic Plants, 2017, 6, 62–69 CrossRef.
- M.-A. Jabri, N. Hajji, D. Wannes, H. Tounsi, M. Jridi, A. Abdellaoui, M. Nasri, L. Marzouki and H. Sebai, RSC Adv., 2017, 7, 53472–53480 RSC.
- C. Proestos, M. Kapsokefalou and M. Komaitis, J. Food Qual., 2008, 31, 13 CrossRef.
- Q. Xue, H. Fan, K. Li, L. Yang, L. Sun and Y. Liu, RSC Adv., 2017, 7, 51151–51161 RSC.
- G. Ding, Y. Wang, A. Liu, Y. Hou, T. Zhang, G. Bai and C. Liu, RSC Adv., 2017, 7, 22034–22044 RSC.
- I. S. L. Lee, M. C. Boyce and M. C. Breadmore, Food Chem., 2011, 127, 797–801 CrossRef CAS PubMed.
- C. A. Ballus, A. D. Meinhart, R. G. de Oliveira and H. T. Godoy, Food Res. Int., 2012, 45, 136–144 CrossRef CAS.
- R. Martí, M. Valcárcel, J. M. Herrero-Martínez, J. Cebolla-Cornejo and S. Roselló, Food Chem., 2017, 221, 439–446 CrossRef PubMed.
- M. C. Breadmore, A. Wuethrich, F. Li, S. C. Phung, U. Kalsoom, J. M. Cabot, M. Tehranirokh, A. I. Shallan, A. S. Abdul Keyon, H. H. See, M. Dawod and J. P. Quirino, Electrophoresis, 2017, 38, 33–59 CrossRef CAS PubMed.
- X. Hou, X. Zhang and Y. Lu, Anal. Methods, 2017, 9, 10–17 RSC.
- J. P. Quirino, J. Chromatogr., A, 2009, 1216, 294–299 CrossRef CAS PubMed.
- X. Yang, S. Zhang, C. Wang and Z. Wang, Chin. J. Anal. Chem., 2013, 41, 1939–1946 CrossRef CAS.
- J. P. Quirino, J. Chromatogr., A, 2010, 1217, 7776–7780 CrossRef CAS PubMed.
- X. Yang, X. Cheng, Y. Lin, Z. Tan, L. Xie and M. M. F. Choi, J. Chromatogr., A, 2014, 1325, 227–233 CrossRef CAS PubMed.
- X. Yang, S. Zhang, J. Wang, C. Wang and Z. Wang, Anal. Chim. Acta, 2014, 814, 63–68 CrossRef CAS PubMed.
- J. P. Quirino and A. T. Aranas, Anal. Chim. Acta, 2012, 733, 84–89 CrossRef CAS PubMed.
- C. Kukusamude, S. Srijaranai, M. Kato and J. P. Quirino, J. Chromatogr., A, 2014, 1351, 110–114 CrossRef CAS PubMed.
- L. Y. Thang, H. H. See and J. P. Quirino, Talanta, 2016, 161, 165–169 CrossRef CAS PubMed.
- A. Wuethrich, P. R. Haddad and J. P. Quirino, Electrophoresis, 2016, 37, 1139–1142 CrossRef CAS PubMed.
- W. Grochocki, M. J. Markuszewski and J. P. Quirino, J. Chromatogr., A, 2015, 1424, 111–117 CrossRef CAS PubMed.
- W. Grochocki, M. J. Markuszewski and J. P. Quirino, J. Chromatogr., A, 2016, 1442, 140–143 CrossRef CAS PubMed.
- J. P. Quirino and A. M. Guidote Jr, J. Chromatogr., A, 2011, 1218, 1004–1010 CrossRef CAS PubMed.
- J. P. Quirino, P. Anres, J. Sirieix-Plénet, N. Delaunay and P. Gareil, J. Chromatogr., A, 2011, 1218, 5718–5724 CrossRef CAS PubMed.
Footnote |
| † Electronic supplementary information (ESI) available. See DOI: 10.1039/c7ra11553a |
| This journal is © The Royal Society of Chemistry 2018 |

