 Open Access Article
Attraction or repulsion? Theoretical assessment of bulky alkyl groups by employing dispersion-corrected DFT†
Mo Xie * and
Wei Lu
 *
*
Department of Chemistry, South University of Science and Technology of China, Shenzhen, Guangdong, 518055 P. R. China. E-mail: xiem@sustc.edu.cn; luw@sustc.edu.cn
First published on 9th January 2018
Abstract
London dispersion, which is the most widespread attractive part of van der Waals force, can be enhanced by introducing a bulky alkyl group to the interacting molecules. However, this strategy will also result in increased steric repulsion. Our theoretical investigation of the attraction–repulsion balance of alkyl groups is implemented, based on an intramolecular configuration torsion system, by varying the sizes and positions of alkyl groups and employing density functional theory (DFT) with or without dispersion correction. The more stabilized folded configurations, higher conversion energy barriers, and stronger alkyl–π interactions are all obtained within the dispersion-corrected DFT calculations. The position of the alkyl is the obvious controlling factor in the configuration conversion. The attractive dispersion effect of the bulky alkyl is better reflected than the steric repulsion. Furthermore, the present findings separate two different reaction pathways depending on two different stereoisomers of the unfolded reactants and the DFT+D3 simulated pathways were proved to be more reasonable.
Introduction
van der Waals forces are widespread in nature as crucial noncovalent interactions.1 The ability of geckos to hang on a glass surface or climb on sheer surfaces has been attributed to van der Waals forces.2 In chemistry and biology, van der Waals forces are supposed to be the major drivers of molecular aggregation, the formation of nanoparticles, and the binding of small molecules and proteins or biological receptors.3,4 van der Waals forces include the attraction and repulsion between atoms, molecules, and surfaces, as well as other intermolecular forces. They differ from covalent and ionic bonding in that they are caused by correlations in the fluctuating polarizations of nearby particles.5The most widespread attractive part of the van der Waals force is the London dispersion that arises from the interactive forces between instantaneous multipoles in molecules without permanent multipole moments.3 London dispersion was once viewed as neutralized or negligible because it is non-permanent and not easily observed and measured. In the past few years, however, theoretical methods and computational skills have been development, making the London dispersion an observable quantity.6–9 In particular, the London dispersion force was demonstrated to play a significant role in some processes of chemistry and biology. For example, Grimme and co-workers reported that the dispersion force had a strong impact on the thermodynamic stability and conformational isomerism of molecules;10 Wagner et al.11 and Osuna et al.12 elaborated on the dispersion-based driving force in biological molecular ladders and chemical cycloaddition reaction, respectively. Recently, Rösel and co-workers demonstrated that the stabilizing effect of alkyl groups is mainly from the dispersion energy.13
In a general chemical experiment, introducing a bulky alkyl group to one compound is an effective method to increase its steric repulsion.14,15 However, the addition of a bulky alkyl group will also increase the attractive London dispersion and then stabilize the molecule.16,17 How to synthetically assess these two effects of the bulky alkyl group is a meaningful and intriguing research question. Shimizu's research group was dedicated to design and modify the “torsion balance molecule” to measure noncovalent interactions, such as aromatic stacking interaction,18 metal–π interaction19 and π–π interaction.20 In their latest work, the stabilizing and destabilizing effects of alkyl groups on an aromatic stacking interaction were evaluated by varying the sizes and positions of the alkyl groups in the molecular balance model system.21 Inspired by this work and maturing dispersion corrected density functional theory (DFT),22–24 we propose that the computational calculation is a feasible and powerful pathway to evaluate the attractive and steric balance of the bulky alkyl group, including the effect from the dispersion force.
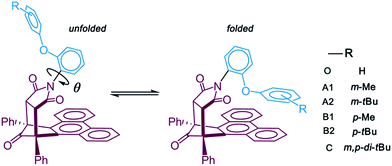
Herein, the influence of the dispersion force on alkyl groups was studied based on Shimizu's molecular balance model. We performed more intuitive reaction mechanism calculations in contrast to the assessment of the folded/unfolded equilibrium ratios in the experiment. The detailed reaction behavior, including the geometry and energy of reaction transition states, reaction Gibbs free energy differences, and energy barriers, were compared by using “standard” DFT and “dispersion-corrected” DFT. We aimed to investigate whether the dispersion could be a controlling factor in the conformational equilibrium reaction process of a bulky alkyl system.
Computational details
Density functional theory (DFT) was applied here using Becke's three-parameter hybrid method combined with the Lee–Yang–Parr correlation functional25 (B3LYP) and B3LYP with dispersion correction (B3LYP+D3). The total energy of DFT-D3 is given by| EDFT-D3 = EKS-DFT + Edisp | (1) |
 | (2) |
The geometries of the reactants, transition states, and products were fully optimized with the standard 6-311+G(d,p) basis set26 for all atoms. Frequency calculations were performed at the same theoretical level to verify the correct stationary points and transition states. The transition states have only one negative eigenvalue of the Hessian matrix, whereas the minimum structures of reactants and products show only positive eigenvalues. Frequency calculations also yielded the thermodynamic data including a zero-point energy correction,27 such as Gibbs free energy and enthalpy at room temperature, and the standard atmosphere pressure. Solvent effects were considered using the polarizable continuum model28 (PCM) of the SCRF procedure for acetonitrile, which was also employed experimentally. M062X functional29 was also used in this weak interaction dominated system to be a reference in the calculations of potential energy scan, geometry and thermodynamic energy value.
To achieve the structural initial prediction of the transition states, we performed a flexible scan of the potential energy curves. The potential energy curves were constructed between stepwise rotated dihedral angle θ (labeled in Scheme 1) and the single-point relative energies of the optimized geometry at each step. Noncovalent interaction analysis30 (NCI) was conducted to investigate the nature of the interaction between the alkyl arm and the phenanthryl π-plane. All calculations were performed with the Gaussian 09 program package.31 The NCI analysis was finished by Multiwfn 3.3 program32 based on the Gaussian calculated geometries and the mapped isosurface graphs of NCI on molecular structure were rendered by VMD 1.9 program.33
Results and discussion
Configuration conversion pathways
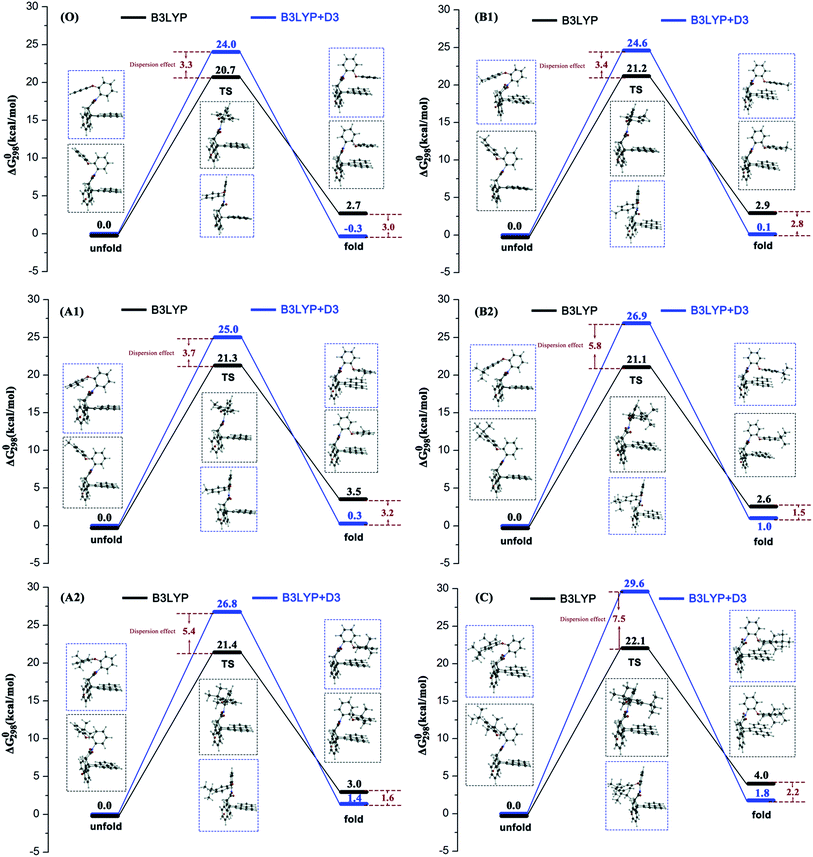
Previous experimental studies established a rule to characterize the folding energies through measuring the folded/unfolded ratios. The reaction pathway calculations can provide more information to assist us in understanding the folded/unfolded mechanism more comprehensively. We carried out the stepwise geometry optimizations along the rotated dihedral angle θ from −150 to 150° to cover the whole folded/unfolded conversion process. The reaction path energy profiles were obtained and are shown in Fig. 1. Strictly speaking, the folded/unfolded conversion process is not exactly a chemical reaction. It can simply be considered as a configuration torsional process inside one molecule. However, herein, to discuss the results conveniently, we still term the unfolded/folded configurations as reactant/product and the torsion transition states are also discussed as the reaction transition state. The total Gibbs free energy of the reactants in the related steps is set as zero for reference. RC, PD, and TS represent the reactant, product, and transition state, respectively.For all six molecules with different sizes and positions of alkyl groups, as shown in Fig. 1, there was only one transition state and no intermediate during the unfolded/folded conversion process whether the pathway was calculated with or without dispersion correction. In general, the unfolded reactants need to overcome a free energy barrier of approximately 20–30 kcal mol−1 to transform to folded products. The free energy barriers calculated with dispersion correction were higher, while the dispersion corrected reaction free energy differences were lower.
It is worth noting that two different configuration conversion pathways were found in the DFT calculation. As shown by the dashed boxes in Fig. 1, all six molecules possessed different reactants, different transition states, and similar products in two pathways. In all of the calculations without consideration of the dispersion, the orientations of the rotatable alkyl-phenyl in the unfolded reactants were upward, and forward in the transition states. However, the orientations of the rotatable alkyl-phenyl in the reactants were downward and backward in the transition states with dispersion correction calculations. This arm orientation remained closer to the main body in the activation process from reactants to the transition states. This phenomenon can be attributed to two different spatial orientations of the O–C–O bond, which linked the rotatable arms and the relatively motionless molecular bodies. Obviously, the stereoisomerism of unfolded reactants was not taken into consideration in the corresponding experimental study, since it did not affect the folded/unfolded ratios. However, the stereoisomerism of the unfolded reactants determined which reaction pathway should be adopted. The simultaneous appearance of these two reaction pathways in our simulations indicated their rationality. However, the weight between two different reaction pathways in an actual situation cannot be predicted by computational methods without the proportion of two unfolded isomers reported in the experiment. It is suggested that the pathways calculated by B3LYP+D3 are more reasonable, owing to the addition of the dispersion correction, and the energy of reactant is lower. In this pathway, the attractive interaction between the arm and body was described more accurately so that it can overcome the steric hindrance caused by the relatively closer position of the arm and body. In the second half of the conversion reaction, different transition states predicted by B3LYP and B3LYP+D3 arrived to the similar products and the energies of the dispersion corrected products were lower. This result illustrates the rationality of the dispersion corrected reaction pathways once again. Furthermore, owing to the fact that the different reaction pathways were obtained by the functionals with or without dispersion correction, the over-estimation of B3LYP+D3 in the activation energy of the configuration equilibrium cannot be attributed to the algorithm of the dispersion correction.
Influence of alkyl sizes and positions and dispersion effect
Table 1 lists the free energy barrier ΔΔG0(TS − RC) and reaction free energy difference ΔΔG0(PD − RC) and the data of A1–C in parentheses are the numeral increments benchmarked against the data of the unsubstituted molecule O for clarity. According to the free energy results, a primary conclusion can be obtained that all the substituted molecules generated higher energy TS and PD except for B3LYP calculated ΔΔG0(PD − RC) of B2. This result, where the conversion reactions of substituted molecules were more difficult, can be attributed to the steric hindrance of the alkyl, if the attraction–repulsion effect of the alkyl substituent was the only influencing factor considered in this reaction. Although the increments of the free energy effected by the steric hindrance were quite small (no larger than 5.6 kcal mol−1), we believed that the present effects were the comprehensive results of two factors.| ΔΔG0(TS − RC)/kcal mol−1 | ΔΔG0(PD − RC)/kcal mol−1 | |||||
|---|---|---|---|---|---|---|
| B3LYP | B3LYP+D3 | M062X | B3LYP | B3LYP+D3 | M062X | |
| O | 20.7 | 24.0 | 24.5 | 2.7 | −0.3 | −0.1 |
| A1 | 21.3(+0.6) | 25.0(+1.0) | 26.6(+2.1) | 3.5(+0.8) | 0.3(+0.6) | 1.7(+1.8) |
| A2 | 21.4(+0.7) | 26.8(+2.8) | 28.1(+3.6) | 3.0(+0.3) | 1.4(+1.7) | 1.5(+1.6) |
| B1 | 21.2(+0.5) | 24.6(+0.6) | 26.1(+1.6) | 2.9(+0.2) | 0.1(+0.4) | 0.8(+0.9) |
| B2 | 21.1(+0.4) | 26.9(+2.9) | 27.8(+3.3) | 2.6(-0.1) | 1.0(+1.4) | 1.8(+1.9) |
| C | 22.1(+1.4) | 29.6(+5.6) | 30.5(+6.0) | 4.0(+1.3) | 1.8(+2.1) | 2.2(+2.3) |
According to the size of alkyl groups, molecules A1 and A2, which contain alkyls with different sizes in the same position, can be treated as one group, symbolized as a meta-group. The group collected B1 and B2 is symbolized as a para-group. For convenience of control, the unsubstituted molecule O was also arranged in each group. In the B3LYP calculated meta-group, the free energy barrier and reaction free energy difference of molecule O was 20.7 kcal mol−1 and 2.7 kcal mol−1, respectively. Along with the increase in the alkyl size, the free energy barriers of A1 and A2 increased by 0.6 kcal mol−1 and 0.7 kcal mol−1, and the reaction free energy differences of A1 and A2 increased by 0.8 kcal mol−1 and 0.3 kcal mol−1, respectively. A linear relation could be observed for the free energy barrier series of this meta-group only. In fact, molecule A2 will cross the highest energy barrier and generate a relative lower energy product than molecule A1. Namely, larger alkyl substituents do not always make the unfolded/folded reaction difficult in the meta-position.
In the B3LYP calculated para-group, along with the increase in the alkyl size, the free energy barriers of B1 and B2 increased by 0.5 kcal mol−1 and 0.4 kcal mol−1, and the reaction free energy differences of B1 and B2 increased by 0.3 kcal mol−1 and −0.1 kcal mol−1, respectively. Two energy series in the para-group exhibited the consistent changing trends: molecule B1 with the second-largest alkyl group will overcome the highest energy barrier to form the highest energy folded product. Hence, the fact that the free energy increments affected by tert-butyl substituent are smaller than that by methyl substituent suggest that attraction of larger alkyl groups plays an effective role in facilitating the unfolded/folded conversion reaction.
As for the other influencing factor, the position of alkyl groups, a similar analysis can be applied. Molecule O, A1, and B1 can be organized into a methyl-group. The free energy barrier series and reaction free energy difference series were (0, +0.6, +0.5) kcal mol−1 and (0, +0.8, +0.3) kcal mol−1 in this group in the B3LYP calculations. The free energy barrier series and reaction free energy difference series of the tert-butyl-group including molecule O, A2, and B2, were (0, +0.7, +0.4) kcal mol−1 and (0, +0.3, −0.1) kcal mol−1 under non-dispersion calculations. This result indicated that the para-position is more favorable for unfolded/folded conversion of molecules with both methyl and tert-butyl substituents.
When the dispersion correction was considered in the calculations, the free energy barrier series and reaction free energy difference series in the meta-group were (0, +1.0, +2.8) kcal mol−1 and (0, +0.6, +1.7) kcal mol−1; and in the para-group were (0, +0.6, +2.9) kcal mol−1 and (0, +0.5, +1.4) kcal mol−1, respectively. Similar conclusions can be obtained in two groups where the molecule with the largest alkyl will cross the highest free energy barrier and produce the highest energy folded form. The linear effects of the alkyl sizes were reflected well after dispersion correction was considered. The repulsion effect of a larger alkyl substituent seemed to be the dominant factor in the B3LYP+D3 reaction pathway. Two different attraction–repulsion competition results were obtained effected by the dispersion correction in the calculations, leading to an inadequate judgment of the relationship between the alkyl size and unfolded/folded reaction. However, there seems to be other factors causing the difference and we will discuss these later.
Compared with the former analysis on alkyl sizes, the influence of the alkyl positions is more regular because the energy change trends affected by dispersion correction are similar. Molecules with an alkyl in the para-position will be easier to cross the energy barrier to complete the unfolded/folded conversion chemical process and easily form the lower-energy folded configurations. This is in good agreement with the experimental conclusion that the position is the major factor in controlling the stability of the folded forms.
To investigate the influence of the dispersion force on alkyl groups is the core objective of this study. It can be seen from Fig. 1, the free energy barriers of all six molecules in the B3LYP+D3 calculation were higher and the reaction free energy differences were lower. This result indicated that the unfolded reactants will overcome the higher energy barrier rather than form the more stable folded configurations under the effect of dispersion. As mentioned above, this result can be attributed to two reaction pathways caused by two different functions with or without dispersion.
In particular, for the unsubstituted molecule O first, the B3LYP+D3 calculated folded PD configuration was more stable than the unfolded RC. Compared with the non-dispersion calculated pathway of molecule O, the more stable folded PD configuration can be attributed to the π–π attraction between the arm and body, which is properly evaluated by the dispersion-inclusive method. When molecule O was substituted by alkyl groups, all unfolded RC configurations were more stable than folded PD. Nonetheless, the free energies of the dispersion-inclusive calculated PDs were lower than the non-dispersion results. Second, for both the meta-group and para-group, the dispersion influence was increased along with the alkyl size on the free energy of TS and decreased on the free energy of PD. No linear correlation was found between the dispersion influence and alkyl positions. Third, the energy differences between the B3LYP data and B3LYP+D3 data for molecule C were 7.5 kcal mol−1 in ΔΔG0(TS − RC) and −2.2 kcal mol−1 in ΔΔG0(PD − RC), respectively. The energy barrier difference was the largest among all six molecules and the reaction free energy difference was in the middle-position. This result well supports the positive correlation between the dispersion effect and alkyl size on the free energy barrier.
As a reference, the reaction processes predicted by M062X functional are closer to B3LYP+D3 results, that is, arms are closer to the main body in the conformational conversion reaction. However, the energies of the M062X predicted intermediates and products are higher that of B3LYP+D3. This result shows that the stabilization effect of dispersion correction in this study is better than the long-term correlation of M062X.
Alkyl–π interaction in folded configurations
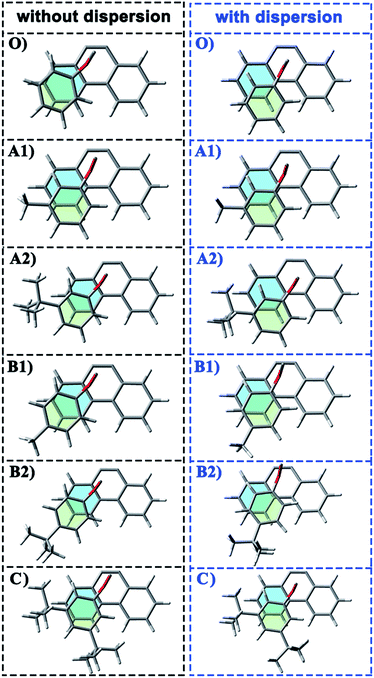
In the current work, the folded products are the most suitable configurations to reflect the noncovalent interactions. In the calculations, the structural differences in PDs simulated with and without D3 correction are no more than that in RCs and TSs. Throughout the comparison with the crystal structure, we confirmed that the PD configurations of B3LYP and B3LYP+D3 were both belong to the “folded” category (see the ESI† for details). However, the small structural differences between them are convenient for us to distinguish the role of dispersion in the structural simulation of folded products. Thus, we first focused on the comparison of the structural parameter of folded configurations. The top view and side view of the folded products are shown in Fig. 2, 3, and 4, and the packing areas from the top view and some representative structural parameters from the side view are labeled. In Fig. 2, the alkyl-benzene in all molecules overlaps with one benzene ring of phenanthryl whether the folded geometries are optimized with or without dispersion correction. If we carefully observe the relative location between the alkyl-benzene and phenanthryl, we can confirm that the alkyl-benzene is closer to the central axis of the whole molecule with dispersion correction. Hence, the alkyl-arms need a larger rotation angle to achieve the stable products configuration.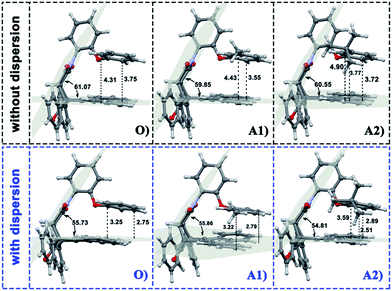 | ||
| Fig. 3 Geometries of folded conformation O, A1 and A2 calculated with or without dispersion correction. The major structural parameters were listed. | ||
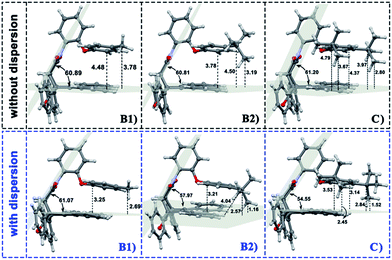 | ||
| Fig. 4 Geometries of folded conformation B1, B2 and C calculated with or without dispersion correction. The major structural parameters were listed. | ||
It is far from comprehensive to summarize the correlations between the packing areas and dispersion, and the alkyl group sizes and positions only depend on the top view graphs in Fig. 2. Thus, a more detailed side view with structural parameters of the folded configurations will be analyzed here to confirm the dispersion and alkyl effects to packing. Fig. 3 and 4 show that the alkyl-phenyls are not parallel with the phenanthryl plane in all structures. As for molecule O, particularly, the angle between the succinimide plane and phenanthryl plane is 61.07° and the longest and shortest distances between the alkyl-benzene and the phenanthryl plane are 4.31 Å and 3.75 Å, respectively. The above parameters change to 55.73°, 3.25 Å and 2.75 Å when affected by the dispersion correction. Both angles and distances indicate that the alkyl-benzene is closer to phenanthryl plane under the influence of dispersion. Combined with the analysis of the relative Gibbs free energy discussed above, the more stable folded configuration simulated by B3LYP+D3 possesses the smaller arm–body interaction distance. A similar conclusion can be made for other molecules. In B3LYP calculated molecule A1, the angle between the succinimide plane and phenanthrene plane is 59.85°, the distance between carbon atom of methyl and phenanthrene plane is 4.43 Å, and the distance from the nearest carbon atom of alkyl-phenyl to the phenanthryl plane is 3.55 Å. When methyl is replaced by tert-butyl, the angle grows to 60.55°, the distance between the tertiary carbon atom of tert-butyl and phenanthryl plane is 4.90 Å, the distance between the bottommost carbon atom of tert-butyl and phenanthryl plane is 3.77 Å, and the shortest distance between alkyl-benzene and phenanthryl plane is 3.72 Å. Unlike the dispersion free calculations, the distance between the alkyl groups or alkyl-benzene and the phenanthryl plane is not obviously increased along with the increment of the alkyl size within dispersion-corrected DFT. Note that the distance between the bottommost carbon atom of tert-butyl and the phenanthryl plane is 2.51 Å in A2. This distance is much less than the sum of the van der Waals radius of two carbon atoms. As for molecules B1 and B2, the arm–body distance increased along with the alkyl size increment without dispersion considered in calculation and decreased with dispersion correction. Surprisingly, molecule C with the bulkiest alkyl groups possesses the smallest angle between the succinimide plane and phenanthryl plane and the shortest alkyl-phenanthryl plane distance influenced by dispersion correction.
Taking molecule B2 as an example, we compared its structure with the crystal structure of the 3i molecule named in the experiment (see the ESI†). The results show that the structure data of B3LYP+D3 is closer to the experiment, especially in the parameter that can reflect the relative position arm and body. As a consequence, the attractive dispersion force possibly dominates the control of the conversion reaction compared with the repulsion. In combination with the analysis of the interaction distance between arm and body, we can confirm that the arm–body interaction is strengthened along with the size of the alkyl groups.
If the positions of the alkyl groups are regarded as variable to assess the interaction between the arm and body, these results can be obtained: (I) the alkyl groups are far from the phenanthryl plane at the para-position; (II) the molecules with the alkyl groups at the para-position present the shorter alkyl-phenanthryl plane vertical distance; (III) these conditions are more explicit within the dispersion corrected DFT calculations. In addition, in the dispersion corrected series, the packing areas in the folded para-position molecules B1 and B2 are larger than that in corresponding meta-position molecules A1 and A2, respectively. Only in the para-position can the central carbon atom of the alkyl (carbon atom of the methyl and tertiary carbon atom of the tert-butyl) hold the nearest distance between itself and the phenanthryl plane along the alkyl-benzene plane. Accordingly, the superiority of the alkyl positions is reflected in the dispersion corrected calculations. This result is in good agreement with the above energy analysis and experimental conclusions and proves the feasibility and rationality of the dispersion corrected DFT in such chemical systems.
To distinguish the interactions within the dispersion corrected and dispersion free calculations intuitively, a noncovalent interaction analysis (NCI) was performed and the nature of the interaction between the alkyl arm and phenanthryl π-plane was visualized. Take molecule C as an example (see ESI† for the NCI of other molecules), Fig. 5 shows a scatter diagram (top) and colored contour surface (bottom) of the reduced density gradient (RDG), where RDG is a function which is related to electronic density; ρ(r) is the electronic density at r point, which reflects the intensity of the interaction; λ2 is the second largest eigenvalue of the electronic density Hessian matrix and the sign of λ2 can represent the type of interaction. In general, if the RDG scatters in the range ±0.005 in spike form, there would be weak interactions like dispersion force; if the RDG scatters in the range >0.005, there would be strong repulsive interactions, like steric hindrance in aromatic rings; if the RDG scatters in the range <0.005, there would be strong attractive interaction, like a hydrogen bond. The contour surfaces characterize the positions of the interaction and the colors characterize the type of interaction. In this visualization, the same extended distance and grid quantity are used for the folded product configurations simulated with or without dispersion correction. In the scatter diagrams, the most obvious differences between B3LYP and B3LYP+D3 results are reflected in the weak interaction regions. Weak interactions are better described in calculations with dispersion correction. As can be seen from the colored contour surface diagram, the green regions are almost localized in the highlighted range, which represent the dispersion interaction. The weak interaction area is so large to spread throughout all arm–body packing areas practically in the dispersion-corrected results. The attractive dispersion interactions attributed from two tert-butyls is more obvious. The repulsive weak interaction area is mainly localized on the center of the benzene rings. Overall, the attractive week interactions, which drive the unfolded/folded conversion, are most probably to be the dispersion force.
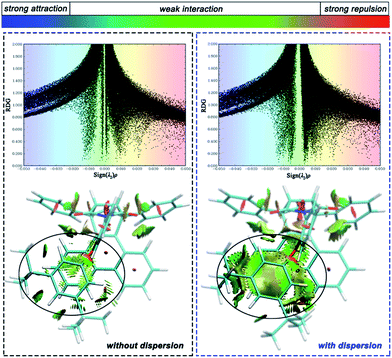 | ||
| Fig. 5 Scatter diagram (top) and colored contour surface (bottom) of reduced density gradient (RDG) of folded conformation C. | ||
Conclusions
Standard DFT and dispersion corrected DFT were employed in this study to simulate the reaction pathway of the unfolded/folded conversion based on Shimizu's molecular balance model. The influences of size and position of alkyl groups on the alkyl–π stacking interaction during the conversion process was demonstrated. The reaction energy profiles calculated with B3LYP and B3LYP+D3 indicated that the unfolded configurations needed to overcome an energy barrier of approximately 20–30 kcal mol−1 and undergo only one transition state to transform to the folded configurations for all molecules with different sizes and positions of alkyl groups. However, we found two different reaction pathways which contained different unfolded reactants, different transition states, and similar folded products, depending on whether the dispersion correction was included or not. All B3LYP+D3 calculated reaction pathways showed a higher activation barrier and lower energy folded products. This is a theoretically unique conclusion which depended on the stereoisomerism of unfolded reactants. The DFT+D3 simulated pathways were proved to be more reasonable according to energy analysis and structural comparison between the calculated folded products structure and the experimental crystal structure. Throughout the analysis of the relative Gibbs free energy of reactants, transition states, and products, the similar conclusion was obtained conforming to the experimental results: molecules with an alkyl in the para-position will easily cross the energy barrier to complete the unfolded/folded conversion chemical process and easily form lower-energy folded configurations. In short, the position is the major factor in controlling the stability of the folded forms. Furthermore, the alkyl–π packing area, alkyl–π interaction distance, and noncovalent interaction were probed. The correlations between alkyl size and alkyl–π interaction, and between alkyl position and alkyl–π interaction are both positive in the dispersion-corrected calculations. Dispersion of the alkyl groups is the main driving force for the unfolded configurations to transform to a folded configuration.In summary, although the unfolded configuration will go through a higher activation barrier and form a larger steric transition state with dispersion, it will finally arrive at the lower-energy folded configuration with more stable alkyl–π interactions. The attractive dispersion effect of the bulky alkyl is preferably reflected in this system rather than the repulsion steric effect throughout the dispersion corrected DFT. Therefore, the inclusion of dispersion corrections for simulating the noncovalent weak interaction is necessary.
Conflicts of interest
There are no conflicts to declare.Acknowledgements
This work was supported by National Natural Science Foundation of China (21571096) and Science and Technology Innovation Commission of Shenzhen Municipality (JCYJ20160301114634613).References
- J. D. van der Waals, Over de Continuiteit van den Gas-en Vloeistoftoestand, Sijthoff, 1873 Search PubMed
.
- K. Autumn, M. Sitti, Y. A. Liang, A. M. Peattie, W. R. Hansen, S. Sponberg, T. W. Kenny, R. Fearing, J. N. Israelachvili and R. J. Full, Proc. Natl. Acad. Sci. U. S. A., 2002, 99, 12252–12256 CrossRef CAS PubMed
.
- I. G. Kaplan, Intermolecular interactions: physical picture, computational methods and model potentials, John Wiley & Sons, 2006 Search PubMed
.
- E. H. Krenske and K. Houk, Acc. Chem. Res., 2013, 46, 979 CrossRef CAS PubMed
.
- A. Stone, The Theory of Intermolecular Forces, 1997 Search PubMed
.
- I. Sedov and B. Solomonov, J. Struct. Chem., 2013, 54, 262–270 CrossRef CAS
.
- L. Yang, C. Adam, G. S. Nichol and S. L. Cockroft, Nat. Chem., 2013, 5, 1006–1010 CrossRef CAS PubMed
.
- E. Lyngvi, I. A. Sanhueza and F. Schoenebeck, Organometallics, 2014, 34, 805–812 CrossRef
.
- J. P. Wagner and P. R. Schreiner, Angew. Chem., Int. Ed., 2015, 54, 12274–12296 CrossRef CAS PubMed
.
- S. Grimme, R. Huenerbein and S. Ehrlich, ChemPhysChem, 2011, 12, 1258–1261 CrossRef CAS PubMed
.
- J. P. Wagner and P. R. Schreiner, J. Chem. Theory Comput., 2014, 10, 1353–1358 CrossRef CAS PubMed
.
- S. Osuna and K. N. Houk, Chem.–Eur. J., 2009, 15, 13219–13231 CrossRef CAS PubMed
.
- S. Rosel, C. Balestrieri and P. R. Schreiner, Chem. Sci., 2017, 8, 405–410 RSC
.
- M. Charton, Steric effects in drug design, 1983, pp. 57–91 Search PubMed
.
- R. Gallo, Prog. Phys. Org. Chem., 1983, 14, 115–163 CrossRef CAS
.
- P. R. Schreiner, L. V. Chernish, P. A. Gunchenko, E. Y. Tikhonchuk, H. Hausmann, M. Serafin, S. Schlecht, J. E. Dahl, R. M. Carlson and A. A. Fokin, Nature, 2011, 477, 308–311 CrossRef CAS PubMed
.
- A. A. Fokin, L. V. Chernish, P. A. Gunchenko, E. Y. Tikhonchuk, H. Hausmann, M. Serafin, J. E. P. Dahl, R. M. K. Carlson and P. R. Schreiner, J. Am. Chem. Soc., 2012, 134, 13641–13650 CrossRef CAS PubMed
.
- J. Hwang, B. E. Dial, P. Li, M. E. Kozik, M. D. Smith and K. D. Shimizu, Chem. Sci., 2015, 6, 4358–4364 RSC
.
- J. M. Maier, P. Li, J. Hwang, M. D. Smith and K. D. Shimizu, J. Am. Chem. Soc., 2015, 137, 8014–8017 CrossRef CAS PubMed
.
- W. R. Carroll, P. Pellechia and K. D. Shimizu, Org. Lett., 2008, 10, 3547–3550 CrossRef CAS PubMed
.
- J. Hwang, P. Li, M. D. Smith and K. D. Shimizu, Angew. Chem., 2016, 128, 8218–8221 CrossRef
.
- S. Grimme, J. Comput. Chem., 2004, 25, 1463–1473 CrossRef CAS PubMed
.
- S. Grimme, J. Comput. Chem., 2006, 27, 1787–1799 CrossRef CAS PubMed
.
- S. Grimme, J. Antony, S. Ehrlich and H. Krieg, J. Chem. Phys., 2010, 132, 154104 CrossRef PubMed
.
- A. D. Becke, J. Chem. Phys., 1993, 98, 5648–5652 CrossRef CAS
.
- M. J. Frisch, J. A. Pople and J. S. Binkley, J. Chem. Phys., 1984, 80, 3265–3269 CrossRef CAS
.
- A. G. Baboul, L. A. Curtiss, P. C. Redfern and K. Raghavachari, J. Chem. Phys., 1999, 110, 7650–7657 CrossRef CAS
.
- M. Cossi, V. Barone, R. Cammi and J. Tomasi, Chem. Phys. Lett., 1996, 255, 327–335 CrossRef CAS
.
- Y. Zhao and D. G. Truhlar, Theor. Chem. Acc., 2008, 120, 215–241 CrossRef CAS
.
- E. R. Johnson, S. Keinan, P. Mori-Sanchez, J. Contreras-Garcia, A. J. Cohen and W. Yang, J. Am. Chem. Soc., 2010, 132, 6498 CrossRef CAS PubMed
.
- M. J. Frisch, H. B. Schlegel, G. E. Scuseria, M. A. Robb, J. R. Cheeseman, G. Scalmani, V. Barone, B. Mennucci, G. A. Petersson, H. Nakatsuji, M. Caricato, X. Li, H. P. Hratchian, A. F. Izmaylov, J. Bloino, G. Zheng, J. L. Sonnenberg, M. Hada, M. Ehara, K. Toyota, R. Fukuda, J. Hasegawa, M. Ishida, T. Nakajima, Y. Honda, O. Kitao, H. Nakai, T. Vreven, J. A. Montgomery Jr, J. E. Peralta, F. Ogliaro, M. Bearpark, J. J. Heyd, E. Brothers, K. N. Kudin, V. N. Staroverov, R. Kobayashi, J. Normand, K. Raghavachari, A. Rendell, J. C. Burant, S. S. Iyengar, J. Tomasi, M. Cossi, N. Rega, J. M. Millam, M. Klene, J. E. Knox, J. B. Cross, V. Bakken, C. Adamo, J. Jaramillo, R. Gomperts, R. E. Stratmann, O. Yazyev, A. J. Austin, R. Cammi, C. Pomelli, J. W. Ochterski, R. L. Martin, K. Morokuma, V. G. Zakrzewski, G. A. Voth, P. Salvador, J. J. Dannenberg, S. Dapprich, A. D. Daniels, Ö. Farkas, J. B. Foresman, J. V. Ortiz, J. Cioslowski and D. J. Fox, Gaussian 09, revision E.01 Inc., Wallingford CT, 2009 Search PubMed
.
- T. Lu and F. Chen, J. Comput. Chem., 2012, 33, 580–592 CrossRef CAS PubMed
.
- W. Humphrey, A. Dalke and K. Schulten, J. Mol. Graphics, 1996, 14, 33–38 CrossRef CAS PubMed
.
Footnote |
| † Electronic supplementary information (ESI) available: Comparison of experimental and calculated structure of molecule B2, NCI analysis for molecule O-B2 and the optimized coordinates of RC, PD, TS of all six molecules. See DOI: 10.1039/c7ra11547d |
| This journal is © The Royal Society of Chemistry 2018 |

