 Open Access Article
Systematic studies on YbxBi1−xVO4:Tm3+ solid solutions: experiments and DFT calculations on up-conversion photoluminescence properties
Juan Yi†
ab,
Zong-Yan Zhao† *a and
Yu-An Wangb
aFaculty of Materials Science and Engineering, Kunming University of Science and Technology, Kunming 650093, P. R. China. E-mail: zzy@kmust.edu.cn; Fax: +86-871-65107922; Tel: +86-871-65109952
bShenzhen Water (Group) Co., Ltd., Shenzhen 518026, P. R. China
First published on 2nd January 2018
Abstract
Compound solid solutions have attracted intensive attention due to their adjustable structure, electronic structure, and optical properties. Despite tremendous advances in compound solid solution preparations, combining a rare metal compound and a bismuth compound with the same crystal phase by forming a compound solid solution is still challenging but fascinating. For example, RE1−xBixVO4 with a zircon-type structure exhibits tunable band gaps and photoluminescence performance with varying RE compositions. Herein, Yb1−xBixVO4 solid solutions with continuous monophasic phase prepared by a facile synthesis strategy that is combined with co-precipitation and hydrothermal methods are reported. By doping a small amount of Tm3+, YbxBi1−xVO4 solid solutions can achieve a broad range up-conversion photoluminescence from UV-light to NIR-light. Combined with DFT calculations, the underlying mechanism of experimental observations is explained. In these up-conversion processes, the existence of Tm3+ is an essential factor. In particular, the NIR-to-UV up-conversion photoluminescence of YbxBi0.98−xVO4: 2 mol% Tm3+ solid solution is very interesting and a worthy phenomenon for further studies. As such, designing compound solid solutions may provide a new avenue for controllable up-conversion efficiencies in semiconductor nanocrystals and also a novel insight into the rational tunable up-conversion process for applications in biological labeling and imaging.
1. Introduction
Rare earth (RE) elements are the essential components of laser crystals, high efficiency fluorescent materials, permanent magnetic materials, high-temperature superconducting materials, etc. Therefore, the optical properties of RE-related materials have become an important subject for scientific research. Because of their unique 4fN5dM electronic configuration, RE elements (or ions) have attracted significant interest in the field of photoluminescence. Due to the relatively high quantum numbers (principal and orbital angular momentum), RE ions can form more energy levels which result in more possible transitions between them, forming various bands of the spectrum ranging from the ultraviolet region to the infrared region. Moreover, the spectrum of a RE ion is a narrowband, which is similar to that of an atom. Therefore, their chromaticity is very pure and they can act as the ideal activating ions for luminescence materials. For example, Wuister et al. observed an efficient energy transfer from Ce3+ ions to the TRITC molecules upon photoexcitation of Ce3+-doped yttrium–aluminum garnet. The 5d state of Ce3+ ion is situated at a low energy, resulting in a fast intraconfigurational 5d → 4f luminescence in the visible region.1 Hungerford et al. observed that the lanthanide emissions helped elucidate POM–POM interactions. In these complex compounds, Er3+ and Tb3+ exhibit the characteristic emission bands, such as 5D4 → 7F6/7F5/7F4/7F3, and 5D0 → 7F2.2 Therefore, selecting proper lanthanide dopants and inserting them in appropriate hosts can generate many new series of such doped nanocrystals with several unique and attractive properties in order to meet current challenges in the versatile field of luminescent materials.3RE vanadate (REVO4) possess stable physical and chemical properties, and have a large absorption cross section for UV-light. Furthermore, VO43− groups of REVO4 possess outstanding self-activated emitting properties. They can absorb UV radiation energy by self-activation and emit visible-light or they can efficiently transfer the excitation energy to sensitize RE ions to emit the corresponding characteristic luminescence. Thus, REVO4 exhibit a high luminescent effect and luminous intensity, and therefore have already been applied in the field of luminescent materials.4–8 Yu et al. fabricated nanocrystalline YVO4:A (A = Eu3+, Dy3+, Sm3+, Er3+) phosphor films and found that the doped RE ions (A) showed their characteristic emission in crystalline YVO4 phosphor films because of an efficient energy transfer from vanadate groups to RE ions.9 In general, REVO4 has the following excellent photoluminescence performances: strong UV-light absorption, high stability during high-temperature treating, appropriate fluorescent life, and excellent color purity, which makes REVO4 a novel luminescent material that is widely used in the fields of lighting, laser, and display.10–12 Tymiński et al. successfully synthesized rare-earth vanadates of the form REVO4 (RE = Y, La, Ga, and Lu) doped by Yb3+/Ho3+, Yb3+/Er3+, or Yb3+/Tm3+ lanthanide ions using the sol–gel method. They observed that Ln3+ co-doped vanadate matrices exhibited a strong up-conversion luminescence, following effective excitation by NIR radiation. The up-conversion mechanism was proposed as the energy-transfer processes between Yb3+ ions and emitting ions.6
Despite the abovementioned unique spectroscopic features, REVO4 still has some critical drawbacks which limit their broader application as photoluminescence materials. For example, REVO4 with wide band gap can only be excited by UV-light or near UV-light; the photoluminescence intensity of REVO4 is relatively weaker in comparison with commercial luminescent materials; the limited chemical stability of vanadates against redox reactions restricts their use in fluorescent tubes. To overcome these problems, the construction of REVO4-based solid solutions is the only available strategy. In 1967, Aia synthesized a series of REV1−xPxO4 solid solutions and found that dilution with phosphate leads to a considerable enhancement of the vanadate fluorescence, which occurs in a broad band.13 Recently, Filho et al. prepared REVO4–REPO4 heterostructures by colloidal precipitation approach, and observed that the final material displays efficient emissions in the red, green, and blue regions under VUV, UV, and NIR excitations.7 It is worth noting that Blin et al. synthesized Eu1−xBixVO4 solid solution with a zircon-type structure via a solid-state reaction in 1996.14 Owing to the same crystal structure and similar ionic radii, EuVO4–BiVO4 binary system could form a continuous solid solution with a tunable band gap that could be excited by different LED chips. Furthermore, Eu atoms could be partially substituted by Bi atoms to enhance the crystal field, resulting in efficient energy transfer.
In fact, the luminescent properties of Bi have gained increasing attention recently owing to its lone pair electronic configuration of 6 s0, multiple valence states (from positive to negative) and species (from single ion to ion clusters).15–17 Zheng et al. observed that the Ba2B2O9Cl:Bi crystal is capable of producing luminescence in a super-broad spectral range from 600 to 1200 nm with a lifetime longer than 1 ms, due to the cascade transitions from 3P2 and 3P1 to 3P0, once the ion of Bi+ is stabilized and built into the compound.15
In our previous studies, we attempted to improve the photoluminescence performance of REVO4 by constructing RExBi1−xVO4 nanocrystal solid solutions: continuous EuxBi1−xVO4, YxBi0.95−xVO4:0.05Dy3+, and GaxBi0.95−xVO4:0.05Eu3+ nanocrystals with monophasic zircon-type structures were successfully synthesized, and they showed strong red-light emission at 619 nm, yellow-light emission at 574 nm, and red-light emission at 619 nm, respectively, under both near UV-light and visible-light excitation.18–20 In these experiments, we adopted co-precipitation and hydrothermal combined synthesis method, which can avoid high temperatures and the time consuming process of conventional solid-state reaction. However, the photoluminescence performances of these RExBi1−xVO4 nanocrystal solid solutions belong to down-conversion luminescence. Moreover, the corresponding underlying mechanism has not been completely understood. In our other previous studies, we employed density functional theory (DFT) to explore the relationship between the electronic structure and the luminescence properties of some luminescent materials and obtained some useful evidence. Based on this understanding, we further synthesized YbxBi1−xVO4 nanocrystal solid solutions as up-conversion luminescent materials and systematically explored the underlying mechanism of photoluminescence of RExBi1−xVO4 solid solution, which has the potential to provide some new considerations for REVO4-based luminescent materials.
2. Experimental and computational methods
In general, the method of preparing a solid solution is the solid state reaction method. However, the solid state reaction method requires a long time for synthesis and high temperatures for calcination, which makes it difficult to obtain samples with single crystal phase. For example, using the solid state reaction method with high calcination temperature (up to 850 °C) and long synthesis time (up to 1.5 weeks), Blin et al. prepared a Eu1−xBixVO4 solid solution with a biphasic mixture of the tetragonal phase and a monoclinic phase in the range of 0.75 < x < 0.9.14 In our previous studies, we adopted a new synthesis strategy that is combined with co-precipitation and hydrothermal methods with low reaction temperature and short synthesis time to successfully prepare continuous Eu1−xBixVO4, Y1−xBixVO4, and Ga1−xBixVO4 solid solutions with monophasic zircon-type structure.18–20 In the preparation of luminescent materials, co-precipitation method has the following advantages: low reaction temperature, facile and fast operation, and ease of mass production. Furthermore, it can directly produce high purity powders with uniform chemical composition, good-dispersion and small particles. In the current experiments, the precursor of RE1−xBixVO4 was prepared by the co-precipitation method with ammonia as the precipitating agent to ensure that the samples have a continuous zircon crystal structure. Hydrothermal reaction is carried out in a closed liquid environment at high pressure and high temperature. It can make the insoluble precursor fully dissolved, forming the growth basics for the following reactions and completing the reaction process. In the present experiments, RE1−xBixVO4 precursors, prepared by the co-precipitation method, were further introduced into the hydrothermal reaction system to complete the formation of continuous solid solutions. By adjusting the ratio of raw materials and hydrothermal conditions, a series of continuous solid solution powders with single crystal structures were finally obtained to achieve the desired fluorescence enhancement performance.2.1 Reagents and materials
Ammonium vanadate [NH4VO3], bismuth nitrate [Bi(NO3)3·5H2O], rare earth oxide [RE2O3], ammonia solution [NH3·H2O], ethanol, and concentrated nitric acid [HNO3] were supplied by Aladdin (Shanghai, China). Deionized water was obtained from a laboratory purification system. All the solvents and reagents were analytical or 4N grade.2.2 Preparation of samples
According to the designated solid-solution proportions, raw materials were weighed. As a result of the stronger self-concentration quenching of Tm3+,21 the doping concentration of Tm3+ was limited to 2 mol% in the present study.First, RE2O3 was converted to the corresponding nitrates [RE(NO3)3·6H2O] by dissolving them in concentrated nitric acid. Then, the samples were prepared in the following steps: (1) RE(NO3)3·6H2O and Bi(NO3)3·5H2O were mixed with deionized water while stirring continuously to obtain 50 mL solution (4 mol L−1); (2) simultaneously, 0.01 mol of NH4VO3 was added to deionized water and dissolved with stirring at room temperature to obtain a 50 mL solution (4 mol L−1); (3) then, the above two solutions were mixed with continuous stirring for 20 minutes; (4) the most important step was the dropwise addition (in a uniform rate) of 4 mol L−1 ammonia to the above mixed solution. The entire process had to be operated on the thermostat magnetic stirrer. The clear and pale-yellow precipitate was slowly separated out during the pouring and stirring process. (5) When the pH value of the solution reached 9, further addition of ammonia was immediately stopped, while the stirring was continued for 30 minutes. (6) The suspension was transferred into a 100 mL Teflon-lined stainless steel autoclave and the hydrothermal treatment was carried out at 180 °C for 2 h. (7) After taking it out from electronic oven, the stainless steel autoclave was naturally cooled down to the room temperature. (8) After removing the clear supernatant solution, the pale-yellow precipitate was alternatively washed and centrifuged with deionized water and ethanol for three times. (9) The paste-like precipitate obtained from the above step was transferred into a clean culture dish and then, placed inside a blast drying oven to dry at 80 °C for 24 h. (10) Finally, the dried powder was further ground into a superfine powder using an agate mortar, to obtain the desired luminescent material sample.
2.3 Characterization
The crystal structures of luminescent material samples were characterized by an X-ray diffractometer (XRD, Cu-Kα: λ = 1.542 Å, D8 Advance, German). Transmission electron microscope (TEM) images were obtained from JEOl 2100 transmission electron microscope operated at an acceleration voltage of 200 kV. The optical properties of absorption were measured using an ultraviolet-visible diffuse reflectance spectrophotometer (UV-vis DR, Hitachi U-4100, Japan). Photoluminescence spectra including emission and excitation spectra were obtained using a Hitachi F-7000 spectrophotometer equipped with InGaAs as the detector with both continuous (150 W, Hitachi F7000, Japan) and pulsed xenon lamps. All the measurements were performed at room temperature.2.4 DFT calculations
In the present study, theoretical calculations were performed using the periodic density functional theory package of Cambridge Serial Total Energy Package (CASTEP) codes.22 The core electrons were treated with the ultrasoft pseudopotential. The exchange–correlation effects of valence electrons were described through the generalized gradient approximation (GGA), within the Perdew–Burke–Ernzerhof (PBE) function.23 In order to obtain an accurate electronic structure, the method of GGA + U (Ueff = U − J = 8.5 eV for the f-orbital of RE) was adopted in order to overcome the well-known shortcoming of GGA.24 The Monkhorst–Pack scheme K-points grid sampling was set as 2 × 2 × 3 for the irreducible Brillouin zone. An energy cutoff of 420 eV was used for expanding the Kohn–Sham wave functions. The minimization algorithm chosen was the Broyden–Fletcher–Goldfarb–Shanno (BFGS) scheme.25 Its convergence criteria were set as follows: the force on the atoms were less than 0.01 eV Å−1, the stress on the atoms were lower than 0.02 GPa, the atomic displacement was less than 5 × 10⁻⁴ Å, and the energy change per atom was less than 5 × 10⁻⁶ eV. Based on the optimized crystal structure, the electronic structures were then calculated.In the case of RE1−xBixVO4 solid solutions, the conventional cell was adopted, in which half of the RE atoms were replaced by Bi atoms, resulting in the ordered RE0.5Bi0.5VO4 solid solution crystal structure. In the case of RE-doped RE1−xBixVO4 solid solution, 2 × 2 × 2 supercell of RE0.5Bi0.5VO4 solid solution crystal structure was adopted, in which one of the Bi atoms was replaced by a RE atom.
3. Results and discussion
3.1 Structure and morphology
Assurance of the invariable crystal structure is of great importance for the compound solid solution. Fig. 1 depicts the XRD patterns of YbxBi1−xVO4 samples with typical solid solubility that was prepared by the abovementioned method. All the powder samples have a pure crystal phase and show an excellent match with the tetragonal structure of usual zircon-type of BiVO4 (PDF card no. 014-0133) or YbVO4 (PDF card no. 017-0338).26,27 Furthermore, other peaks related to the second phase or impurities could not be found in all XRD patterns. Thus, the RE cations (Yb3+ or Tm3+) occupy the lattice sites of Bi3+, but are not inserted into the vacancies of BiVO4 lattice. In particular, as the Yb content was increased, the position of the main diffraction peak continuously shifted from 24.37° to 25.53°, but the XRD patterns did not change during the entire process. The ionic radii of Yb3+ and Bi3+ ions (in which coordination number is 8) are 0.99 and 1.17 Å, respectively. Larger Bi3+ ions are gradually replaced by smaller Yb3+ ions, which lead to the continuous reduction of corresponding distance between crystal planes. Thus, according to the Bragg reflection formula, diffraction peaks shift toward the large angle. In other words, during the entire process of continues replacement of Bi3+ by Yb3+, the crystal structure is not distorted, and the variation of lattice constants could obey the law of Vegard (which will be proved using our ongoing DFT studies). These results indicate that the synthesis strategy combined with co-precipitation and hydrothermal methods can conveniently and successfully prepare YbxBi1−xVO4 solid solutions with a continuous monophasic zircon-type crystal structure.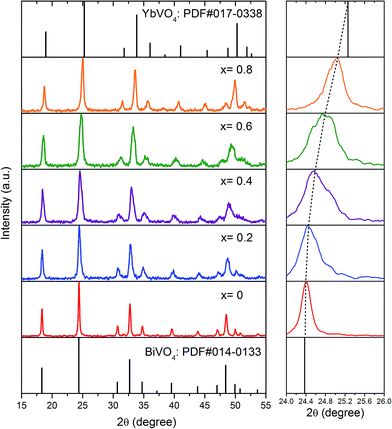 | ||
| Fig. 1 XRD patterns of YbxBi0.98−xVO4: 2 mol% Tm3+ solid solution with different Yb concentrations, the shifting of main diffraction peak is also provided. | ||
The morphology of Yb0.2Bi0.78VO4: 2 mol% Tm3+ (x = 0.2), as the typical sample, is clearly demonstrated by the TEM image (Fig. 2(a)). The small bundle-like nanorods with diameters in the range of 30–60 nm can be observed. The morphologies of YbxBi1−xVO4 nanocrystals are not noticeably changed in the present study owing to the comparable size of the ionic radius of Yb3+ that occupies the lattice site of Bi3+ in the crystal. The HRTEM image in Fig. 2(b) further confirmed that the sample has zircon-type crystal structure. This is because the spacing of the lattice fringes, which is clear and independent, are all 0.34 nm and is well consistent with the (200) plane of zircon-type crystal structure. To confirm the ratio of elements in the sample, the corresponding energy dispersive X-ray spectroscopy (EDS) spectra are provided in Fig. 2(c). The strong peaks related to V, Bi, O, Yb, and Tm are clearly observed. It should be noted that the strongest peak is ascribed to the copper micrometer-grids. No other impurities can be found in the spectra, implying that the samples have a pure chemical composition. Furthermore, the relative atomic percentages of Bi, Yb, and Tm are well consistent with the stoichiometric ratio of the as-designed solid solution. Therefore, summarizing the above experimental observations, the XRD spectrum (diffraction peak is smooth, and no impurity peak is present), HRTEM images (clear lattice stripes and entirely consistent with the ideal crystal structure parameters), and EDS map (the distribution of elements well conforms to the stoichiometric ratio and there are no impurities), it can be safely concluded that Yb3+ and Tm3+ ions successfully occupied the lattice site of Bi3+ and all the elements are uniformly distributed in the nanorods.
3.2 Optical properties and photoluminescence performances
The UV-visible light absorption spectra of YbxBi0.98−xVO4: 2 mol% Tm3+ samples with typical solid solubility are illustrated in Fig. 3. The most important feature is that there is a steep absorption edge between those of pure BiVO4 (∼500 nm) and YbVO4 (∼400 nm). As the Yb concentration increases, the absorption edge gradually blue-shifts. In general, the group [VO4]3− exists as a tetrahedron that possess Td symmetry in the lattice of vanadate. At this situation of crystal field, the electrons can be excited by the incident light, transferring from O-2p states to V-3d states. According to the polarization theory, when the polarizability (or the electron cloud deformation) of anions in tetrahedron is smaller, a higher energy is required for the electron transition. Moreover, the polarizability (or the electron cloud deformation) of O2− anion is not only impacted by the V5+ cation in the tetrahedron, but also influenced by other cations (Bi3+, Yb3+, and Tm3+) outside the tetrahedron. In the present study, the ionic radii of Yb3+ (0.99 Å) and Tm3+ (0.99 Å) are smaller than that of Bi3+ (1.17 Å), and the electronegativity of Yb3+ (∼1.1) and Tm3+ (1.25) are smaller than that of Bi3+ (1.90). Thus, when more Bi3+ cations are replaced by Yb3+ or Tm3+ cations, the polarizability (or the electron cloud deformation) of O2− anion gradually becomes smaller, resulting in the blue-shifting of the absorption edge in the range of 400–600 nm (Fig. 3). In order to profoundly understand these variations, their electronic structure should be explored, which will be discussed in the following subsection. As shown in Fig. 3, in addition to the main absorption band below 600 nm, there are three other absorption bands that are centered at 692, 792, and 980 nm. Moreover, their absorptions gradually increase with the increase in Yb composition. These absorption bands could be associated with the typical f–f transitions of Yb3+ and Tm3+, corresponding to the 3H6 → 3F3 of Tm3+, 3H6 → 3F4 of Tm3+, and 2F7/2 → 2F5/2 of Yb3+.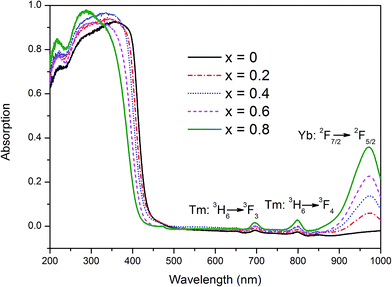 | ||
| Fig. 3 UV-visible absorption spectra of YbxBi0.98−xVO4: 2 mol% Tm3+ solid solution with different Yb concentrations. | ||
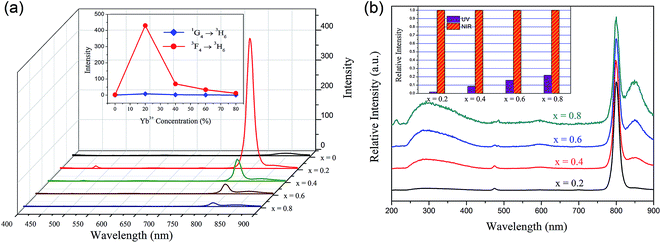
Fig. 4(a) illustrates the room temperature emission spectra of YbxBi0.98−xVO4: 2 mol% Tm3+ samples in visible-light region exited by 980 nm irradiation, in which the composition of Yb is set as follows: x = 0, 0.2, 0.4, 0.6, and 0.8. There is a distinct narrow emission band centered at 792 nm, which is attributed to the f–f transition of Tm3+ (3F4 → 3H6). Another small emission band centered at 474 nm could be observed, which is attributed to the f–f transition of Tm3+ (1G4 → 3H6). The inset in Fig. 4(a) shows the effect of the Yb3+ ion concentration on the blue light emission (474 nm) and near-infrared (792 nm) up-conversion fluorescence emission intensity. As mentioned above, with the gradual increase of Yb3+ ion concentration and the concentration of Tm3+ fixed at 2 mol%, the blue emission and the near-infrared emission exhibit the same trend in variation and the optimal concentration of Yb3+ ion is 20 mol%. This result suggests that there is an optimal concentration of Yb3+ in the YbxBi0.98−xVO4: 2 mol% Tm3+ solid solution. When the concentration of Yb3+ is lower than this optimum, increasing the amount of Yb3+ could enhance the up-conversion process. The reason for the above phenomenon can be summarized as follows: the increase of Yb3+ ion concentration leads to decrease in the distance between Tm3+ and Yb3+, which effectively promotes the energy transfer between the activated ions (Yb3+) and the sensitization ions (Tm3+). However, when the concentration of Yb3+ is higher than this optimum, the excess Yb3+ will induce self-concentration quenching, resulting in the decrease of up-conversion efficiency. It can be concluded from the up-conversion emission spectra (Fig. 4(a)) that in the matrix of the YbxBi1−xVO4 solid solution, the combination of Tm3+ and Yb3+ ions can up-convert the lower incident infrared light (980 nm) to strong near-infrared (NIR) (792 nm) and the relatively weak blue light (474 nm) emission through the energy transfer from Yb3+ ions to Tm3+ ions. The optical transmission window of the human muscle tissues is in the range of 650–1300 nm, thus the prepared Yb0.2Bi0.78VO4: 2 mol% Tm3+ phosphor that emits ∼800 nm near-infrared light could exhibit deeper penetration and detection distance in human muscle tissues and could be applied in biological labeling and imaging.
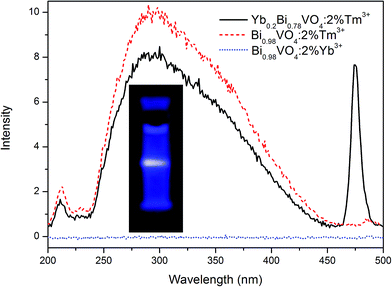
In general, the phonon energy of the oxide is higher than that of common fluoride; hence, obtaining the up-conversion ultraviolet light emission in the oxide is rarely reported. In the present study, we observed an interesting phenomenon: there is a wide UV-light emission band from 250 to 450 nm, in which the main peak is located at 300 nm as shown in Fig. 4(b). In fact, the intensity of the UV-light emission is relatively weak, so the spectra are normalized in Fig. 4(b) and the relative intensity of UV-light and NIR-light emissions are provided in the inset. With the increasing Yb3+ concentration, the comparative intensity of the UV-light emission continuously increases. For Tm3+ ions, the UV-light emission contributed by f–f transition of 1D2 → 3H6 is a narrow band centered at 360 nm. Based on the spectral characteristics (i.e. wide and asymmetric) of this emission peak, we speculated it to be ascribed to the light emission of [VO4]3− group. In order to further explore the origin of this NIR-to-UV up-conversion, the photoluminescence of the three samples (Yb0.2Bi0.78VO4: 2 mol% Tm3+, Bi0.98VO4: 2 mol% Tm3+, and Bi0.98VO4: 2 mol% Yb3+) excited by 980 nm are compared in Fig. 5. In the case of Bi0.98VO4: 2 mol% Yb3+ sample, the NIR-to-UV up-conversion photoluminescence is not observed. However, the intensity of NIR-to-UV up-conversion photoluminescence is stronger than that of the Yb0.2Bi0.78VO4: 2 mol% Tm3+ sample. Thus, it may be concluded that the NIR-to-UV up-conversion originates only from the energy transfer from Tm3+ ions to [VO4]3− groups, and in the YbxBi0.98−xVO4: 2 mol% Tm3+ solid solution samples, Tm3+ ions act as the intermediate for the energy transfer from Yb3+ ions to [VO4]3− groups. Because the intensity of UV-light emission is comparable with that of blue-light emission centered at 474 nm, blue-UV-light emission of Yb0.2Bi0.78VO4: 2 mol% Tm3+ sample could be observed by the naked eye in the present study as shown in the photograph in Fig. 5. These results indicate that the continuous monophasic YbxBi0.98−xVO4: 2 mol% Tm3+ solid solution can achieve the NIR-to-UV up-conversion photoluminescence, which is very important in the field of biological applications.
In order to further characterize the photoluminescence properties of YbxBi0.98−xVO4: 2 mol% Tm3+ solid solutions, the representative decay curves and time-resolved emission spectra of samples were investigated as shown in Fig. 6. These experimental data are well fitted by the double-exponential function: I(t) = I0 + A1![[thin space (1/6-em)]](https://www.rsc.org/images/entities/char_2009.gif) exp[−(t − t0)/τ1] + A2
exp[−(t − t0)/τ1] + A2![[thin space (1/6-em)]](https://www.rsc.org/images/entities/char_2009.gif) exp[−(t − t0)/τ2] and the average decay time could be estimated by the following formula:
exp[−(t − t0)/τ2] and the average decay time could be estimated by the following formula: ![[small tau, Greek, macron]](https://www.rsc.org/images/entities/i_char_e0d4.gif) = (A1τ12 + A2τ22)/(A1τ1 + A2τ2).28 In the case of Bi0.98VO4: 2 mol% Tm3+ sample, the lifetime of 3F4 level (detected at 792 nm) of Tm3+ is determined to be 86.2 ps. As the Yb3+ concentration increases, this lifetime decreases due to the gradually increasing interaction between Yb3+ and Tm3+. Thus, the charge transfer could be significantly enhanced, which finally leads to the increased luminesce intensity of the YbxBi0.98−xVO4: 2 mol% Tm3+ solid solutions.
= (A1τ12 + A2τ22)/(A1τ1 + A2τ2).28 In the case of Bi0.98VO4: 2 mol% Tm3+ sample, the lifetime of 3F4 level (detected at 792 nm) of Tm3+ is determined to be 86.2 ps. As the Yb3+ concentration increases, this lifetime decreases due to the gradually increasing interaction between Yb3+ and Tm3+. Thus, the charge transfer could be significantly enhanced, which finally leads to the increased luminesce intensity of the YbxBi0.98−xVO4: 2 mol% Tm3+ solid solutions.
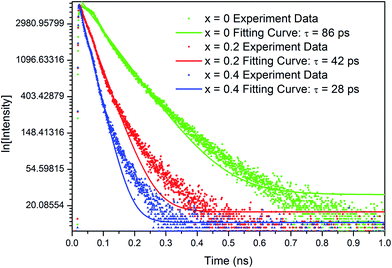 | ||
| Fig. 6 The representative decay curves and time-resolved emission spectra of YbxBi0.98−xVO4: 2 mol% Tm3+ solid solution with different Yb concentrations under diode laser excitation of 980 nm. | ||
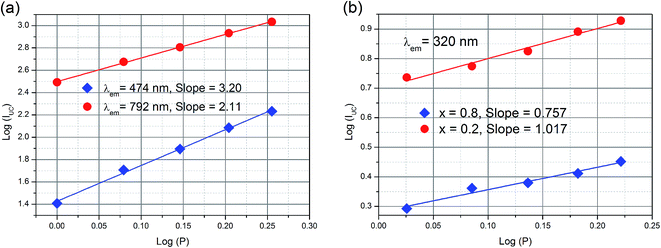
To deeply understand the photoluminescence process of the YbxBi0.98−xVO4: 2 mol% Tm3+ solid solutions, the variation relationship between the excitation power and the up-conversion photoluminescence intensity was measured (Fig. 7). Changing the pump power and the detection of the corresponding photoluminescence intensity are important means for the characterization of up-conversion materials, which can provide significant evidences for the populations of energy levels of activated ions and the sensitization ions. The photoluminescence intensity of up-conversion emission (IUC) and the pump power (P) is satisfied by the following relation: IUC ∝ Pn, in which the exponential “n” represents the number of photons needed to be distributed to the excited state. In fact, “n” is not an integral value because the excitation of electrons from a lower energy level to a higher energy level is not a full resonance absorption process since the phonons always simultaneously assist the energy absorption process and the non-irradiative relaxation also occurs between the energy levels. As shown in the fitting curves in Fig. 7, the slopes are related to the exponential “n”. According to these results, the up-conversion process of 3F4 → 3H6 (792 nm) is a double-photon process, and that of 1G4 → 3H6 (472 nm) is a triple-photon process. The up-conversion process of [VO4]3− group is a single-photon process.
3.3 Electronic structure and mechanism
DFT calculations are helpful to better understand the experimental results based on an accurate electronic structure. In the present study, four zircon-type crystal models (i.e. BiVO4, YbVO4, Yb0.5Bi0.5VO4, and Tm-doped Yb0.5Bi0.5VO4) have been used for calculations and comparisons. The calculated lattice parameters of pure zircon-type BiVO4 are listed as follows: a = b = 7.0998 Å, c = 6.2803 Å. Moreover, the calculated lattice parameters of pure zircon-type YbVO4 are listed as follows: a = b = 7.0093 Å, c = 6.1925 Å. These calculated latter parameters are well-consistent with experimental measurements,27 suggesting that the calculation method adopted in the present study is reliable. In the case of Yb0.5Bi0.5VO4 solid solution model, the calculated lattice parameters are listed as follows: a = b = 7.0190 Å, c = 6.2425 Å. In this model, the variation of lattice parameters is well-consistent with above experimental measurements as shown in Fig. 1. Due to the different valence states and ionic radius, Tm3+ ion-doping will distort the Yb0.5Bi0.5VO4 crystal lattice. In the case of Tm-doped Yb0.5Bi0.5VO4, the calculated lattice parameters are listed as follows: a = b = 7.0408 Å, c = 6.2646 Å. It was found that the lattice distortion caused by Tm3+ ion-doping is very small and it exhibits a trend of lattice expansion. In the XRD measurements (as shown in Fig. 1), the main patterns do not occur significantly offset and are moving toward the small angle. Therefore, the experimental measurements agree with the theoretical calculations in the present study, which indicates that the results produced from DFT calculations could be accepted.The calculated electronic structures (including band structure and density of states) of different models are illustrated in Fig. 8. The band gap energy (between the valence band maximum (VBM), and the conduction band minimum (CBM)) of pure zircon-type BiVO4 and YbVO4 are 2.434 and 3.086 eV, respectively, which are in agreement with experimental measurements. Both the tops of valence bands (VB) are primarily composed of the O-2p states, while both the bottoms of conduction bands (CB) are primarily composed of the hybridized states between O-2p states and V-3d states. For pure YbVO4, the Yb-4f states contribute to the composition of the bottom of the VB. In the case of Yb0.5Bi0.5VO4 model, the band gap increased to 2.568 eV, in comparison to pure BiVO4. Compared to pure BiVO4 or YbVO4, the only difference in the composition of VB and CB is the contribution of Yb-states at the top of the VB. Furthermore, a few unoccupied states could be found at the top of the VB when Yb was induced into the lattice sites of zircon-type BiVO4. The band gap energy of Tm-doped Yb0.5Bi0.5VO4 slightly decreased to 2.528 eV in comparison to Yb0.5Bi0.5VO4. Comparing these results, we can see that the Tm3+ doping has only a slight influence on the band gap energy of the YbxBi1−xVO4 solid solution. These calculated results confirm the observed measurements of UV-vis diffuse reflectance spectroscopy as shown in Fig. 3. In the case of Tm-doped Yb0.5Bi0.5VO4, there are two isolated impurity energy bands in the band gap: one impurity band is located at the top of the VB, which is composed of the hybridized states between O-2p, Bi-6s, and V-3d states, and the other impurity band is located at the bottom of the CB, which is composed of the hybridized states between O-2p, V-3d, and Tm-5d states. These two isolated impurity bands belong to shallow states that can trap holes or electrons from VB or CB. Thus, the efficiency of energy transfer could be enhanced due to the match of energy positions with the energy band of [VO4]3−.
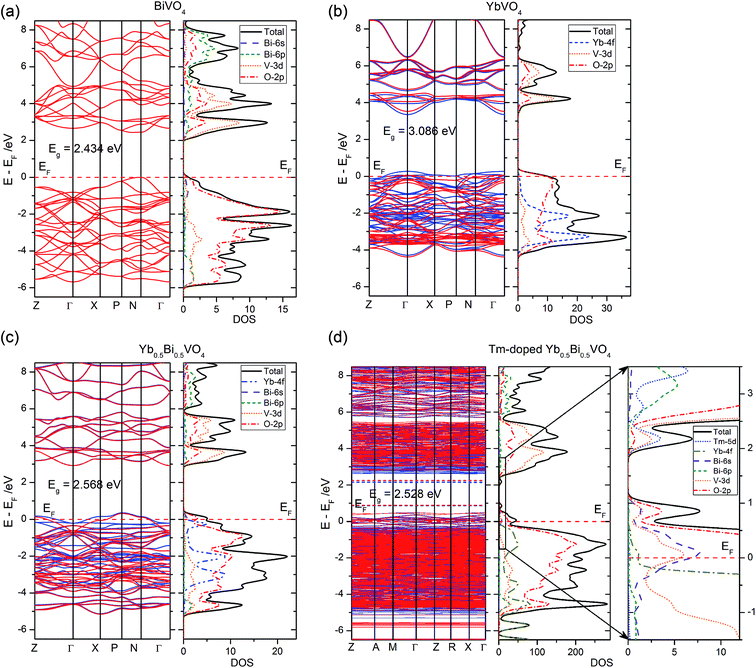 | ||
| Fig. 8 Band structure and density of states of (a) BiVO4, (b) YbVO4, (c) Yb0.5Bi0.5VO4, and (d) Tm-doped Yb0.5Bi0.5VO4 with zircon-type structure. | ||
Combining the above experimental characterizations and DFT calculations, the underlying mechanism for the up-conversion process of YbxBi0.98−xBiVO4: 2 mol% Tm3+ nanocrystals is depicted in Fig. 9. Following a 980 nm excitation, the electrons on the ground state (i.e. 2F7/2 of Yb3+ and 3H6 of Tm3+) are excited to the higher energy levels (2F5/2 of Yb3+ and 3H5 of Tm3+). The excited electrons on the 2F5/2 level of Yb3+ will absorb another photon, and get transferred to the 3H4 level of Tm3+ through charge transfer (CT). On the one hand, the excited electrons on the 3H5 level of Tm3+ can further absorb another photon, and get transferred to the 3F4 level of Tm3+. Then, the excited electrons on the 3F4 level of Tm3+ can transfer back to the ground state of 3H6 of Tm3+ and emit NIR-light with a wavelength of 792 nm. On the other hand, the excited electrons on the 3F4 level of Tm3+ can further absorb a third photon, and get transferred to the 1G4 level of Tm3+. Finally, the excited electron of the 1G4 level of Tm3+ can transfer back to the ground state of 3H6 of Tm3+ and emit blue-light with a wavelength of 474 nm. Owing to the closeness of the energy positions of 2F5/2 of Yb3+, 3H5 of Tm3+, and the bottom of CB of [VO4]3−, the probability of energy transfer (ET) and charge transfer (CT) will be greatly enhanced, resulting in transfer of some excited electrons from 2F5/2 of Yb3+ to 3H5 of Tm3+, followed by a transfer to the bottom of CB of [VO4]3−. In this single-photon process, the 3H5 of Tm3+ acts as the intermediate between 2F5/2 of Yb3+ and the bottom of the CB of [VO4]3−. Finally, the excited electrons on the bottom of the CB of [VO4]3− transfer back to the VB and emit UV-light with a wavelength in the range of 250–450 nm.
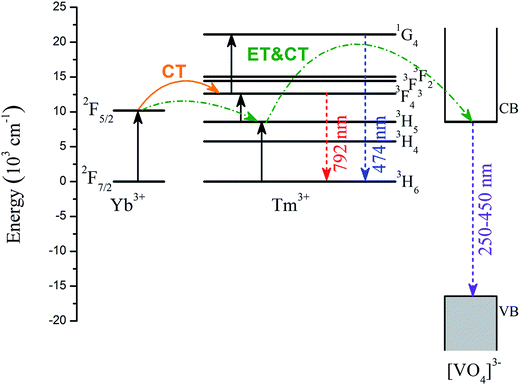 | ||
| Fig. 9 Energy level diagram of Tm3+, Yb3+, and [VO4]3− group, and the proposed up-conversion mechanism. | ||
4. Conclusions
In the present study, Yb3+ ions were introduced into the BiVO4 matrix to form a YbxBi1−xVO4 solid solution. By changing the solid solubility, the effects of BiVO4 matrix on the up-conversion photoluminescence properties of rare earth ions were further studied. Through a synthesis strategy combined with a hydrothermal method and a chemical co-precipitation method, a YbxBi1−xVO4 solid solution with continuous monophasic structure was successfully obtained. The experimental characterization indicates that the nanocrystals exhibit good dispersion, uniform size in the range of 30–60 nm, high crystallinity, and bundle-like nanorod morphology. The YbxBi0.98−xVO4: 2 mol% Tm3+ solid solutions present NIR up-conversion emission (∼792 nm) under 980 nm irradiation, implying their potential applications in the field of biotechnology. Moreover, blue-UV-light emission can be observed by the naked eye in the present study, which is composed by narrow blue light (∼474 nm) emission and a wide UV-light (250–450 nm) emission. Thus, by doping a small amount of Tm3+, YbxBi1−xVO4 solid solution can achieve a broad up-conversion photoluminescence from UV-light to NIR-light. Combined with DFT calculations, the underlying mechanism of experimental observations has been explained. The ∼792 nm emission occurs due to a double-photon process, the ∼474 nm emission occurs due to a triple-photon process, and the 250–450 nm emission occurs due to a single-photon process. In the final up-conversion process, the existence of Tm3+ is the essential factor. In particular, the NIR-to-UV up-conversion photoluminescence of YbxBi0.98−xVO4: 2 mol% Tm3+ solid solution is a very interesting and worthy phenomenon to for further studies. Thus, designing compound solid solutions may provide a new avenue for controllable up-conversion efficiency in the semiconductor nanocrystal and also, a novel insight into the rational tuning up-conversion process for application of biological labeling and imaging.Conflicts of interest
There are no conflicts to declare.Acknowledgements
The authors would like to acknowledge financial support from the National Natural Science Foundation of China (Grant No. 21473082, and 21263006), and 18th Yunnan Province Young Academic and Technical Leaders Reserve Talent Project (Grant No. 2015HB015).References
- S. F. Wuister, C. de Mello Donega and A. Meijerink, Phys. Chem. Chem. Phys., 2004, 6, 1633 RSC.
- G. Hungerford, F. Hussain, G. R. Patzke and M. Green, Phys. Chem. Chem. Phys., 2010, 12, 7266 RSC.
- N. Pradhan and D. D. Sarma, J. Phys. Chem. Lett., 2011, 2, 2818 CrossRef CAS.
- A. Newport, J. Silver and A. Vecht, J. Electrochem. Soc., 2000, 147, 3944 CrossRef CAS.
- S. Takeshita, H. Ogata, T. Isobe, T. Sawayama and S. Niikura, J. Electrochem. Soc., 2010, 157, J74 CrossRef CAS.
- A. Tymiński, T. Grzyb and S. Lis, J. Am. Ceram. Soc., 2016, 99, 3300 CrossRef.
- P. C. de Sousa Filho, T. Gacoin, J.-P. Boilot, R. I. Walton and O. A. Serra, J. Phys. Chem. C, 2015, 119, 24062 CAS.
- Z.-L. Wang, J. H. Hao and H. L. W. Chan, J. Mater. Chem., 2010, 20, 3178 RSC.
- M. Yu, J. Lin, Z. Wang, J. Fu, S. Wang, H. J. Zhang and Y. C. Han, Chem. Mater., 2002, 14, 2224 CrossRef CAS.
- J. Yang, Q. Yue, G.-D. Li, J.-J. Cao, G.-H. Li and J.-S. Chen, Inorg. Chem., 2006, 45, 2857 CrossRef CAS PubMed.
- F. Zhang, J. Li, J. Shan, L. Xu and D. Zhao, Chem.–Eur. J., 2009, 15, 11010 CrossRef CAS PubMed.
- M. Nyk, R. Kumar, T. Y. Ohulchanskyy, E. J. Bergey and P. N. Prasad, Nano Lett., 2008, 8, 3834 CrossRef CAS PubMed.
- M. A. Aia, J. Electrochem. Soc., 1967, 114, 367 CrossRef CAS.
- J. L. Blin, A. Lorriaux-Rubbens, F. Wallart and J. P. Wignacourt, J. Mater. Chem., 1996, 6, 385 RSC.
- J. Zheng, L. Tan, L. Wang, M. Peng and S. Xu, Opt. Express, 2016, 24, 2830 CrossRef CAS PubMed.
- J. Li, K. Collar, W. Jiao, W. Kong, T. F. Kuech, S. E. Babcock and A. Brown, Appl. Phys. Lett., 2016, 108, 232102 CrossRef.
- Z.-F. Huang, L. Pan, J.-J. Zou, X. Zhang and L. Wang, Nanoscale, 2014, 6, 14044 RSC.
- J. Yi, Z. Zhao, Y. A. Wang, D. Zhou, C. Ma, Y. Cao and J. Qiu, Mater. Res. Bull., 2014, 57, 306 CrossRef CAS.
- J. Yi, Y. A. Wang, D. Zhou and J. Qiu, Chin. Opt. Lett., 2014, 12, 091601 CrossRef.
- J. Yi, J.-B. Qiu, Y.-A. Wang and D.-C. Zhou, Chin. Phys. B, 2014, 23, 104224 CrossRef.
- F. W. Ostermayer, J. P. van der Ziel, H. M. Marcos, L. G. Van Uitert and J. E. Geusic, Phys. Rev. B: Condens. Matter Mater. Phys., 1971, 3, 2698 CrossRef.
- S. J. Clark, M. D. Segall, C. J. Pickard, P. J. Hasnip, M. J. Probert, K. Refson and M. C. Payne, Z. Kristallogr., 2005, 220, 567 CAS.
- J. P. Perdew, K. Burke and M. Ernzerhof, Phys. Rev. Lett., 1996, 77, 3865 CrossRef CAS PubMed.
- V. I. Anisimov, J. Zaanen and O. K. Andersen, Phys. Rev. B: Condens. Matter Mater. Phys., 1991, 44, 943 CrossRef CAS.
- B. G. Pfrommer, M. Câté, S. G. Louie and M. L. Cohen, J. Comput. Phys., 1997, 131, 233 CrossRef CAS.
- A. K. Bhattacharya, K. K. Mallick and A. Hartridge, Mater. Lett., 1997, 30, 7 CrossRef CAS.
- B. C. Chakoumakos, M. M. Abraham and L. A. Boatner, J. Solid State Chem., 1994, 109, 197 CrossRef CAS.
- W. J.-G. Zhang Xiang-Yu, X. C. Long, P. Yuan, H. Z. Yang, D. Jian, C. Lin and G. D. Li, Acta Phys. Sin. Ch. Ed., 2016, 65, 204205 Search PubMed.
Footnote |
| † The authors have equal contribution to this article. |
| This journal is © The Royal Society of Chemistry 2018 |


