 Open Access Article
Creative Commons Attribution 3.0 Unported Licence
Boosting efficiency and stability using zirconia nanosphere-held carbon for proton exchange membrane fuel cells
P. Dhanasekarana,
Sharon R. Williamsb,
D. Kalpana*a and
Santoshkumar D. Bhat *a
*a
aCSIR-Central Electrochemical Research Institute (CECRI), CSIR-Madras Complex, Chennai 600 113, Tamil Nadu, India. E-mail: sdbhatcecri@gmail.com; drkalpanaa@gmail.com; Fax: +91-44-22542456; Tel: +91-44-22544564
bDepartment of Nuclear Physics, University of Madras, Chennai, Tamil Nadu, India
First published on 20th December 2017
Abstract
The synthesis of a zirconia-held carbon supported Pt electrocatalyst increases the fuel cell performance in polymer electrolyte fuel cells. The pure tetragonal phase of the zirconia–carbon composite is synthesized using a low temperature method. The optimum composition of zirconia–carbon exhibits a maximum peak power density of 1.12 W cm−2 with a metal (Pt) loading of 150 μg cm−2. This also improves long time durability and retains 70% of its initial activity even after 6000 potential cycles between 1 to 1.6 V vs. a dynamic hydrogen electrode.
1. Introduction
The oxygen reduction reaction (ORR) process is critical in polymer electrolyte fuel cells (PEFCs) and to better it, catalyst design with efficiency and long term durability is a vital requirement. Even though the theoretical efficiency of PEFCs is as high as 80% at 298 K, the practical efficiencies have been in the range of 50–60%.1–3 This is mainly due to the stringent operating conditions of the cell, activation, ohmic and mass transport losses involved in it. In the current scenario, desirable high efficiency and stability of the PEFCs are met by a metal/metal oxide-carbon based electrocatalyst. According to the previous reports, Pt on carbon shows higher fuel cell performance but lower long-term durability. This is mainly due to the carbon corrosion followed by Pt agglomeration and dissolution.3–5 To overcome the same, metal–metal oxide/carbon or metal/metal oxide-carbon composite are explored which retains Pt metal particles and reduces the carbon corrosion resulting in enhanced power output and long term durability in PEFC.6–8In this aspect, zirconia is considered as a material to have excellent mechanical properties, outstanding thermal stability, better corrosion resistance, good chemical stability, proton conductivity and has been widely used in many applications.9,10 According to Liu et al., their Pt4ZrO2/C electrocatalyst improved high temperature fuel cell performance and has a higher corrosion resistance than Pt/C.11,12 Bai et al., reported that the molar ratio of Pt and ZrO2 1![[thin space (1/6-em)]](https://www.rsc.org/images/entities/char_2009.gif) :
:![[thin space (1/6-em)]](https://www.rsc.org/images/entities/char_2009.gif) 4 (Pt–ZrO2/carbon) electrocatalyst enhanced the ethanol electro-oxidation reaction than that of Pt/C.13 Similarly, Cheng et al., explored that Pt encapsulated in a zirconia nanocage by area selective atomic layer deposition, indicated very high stability and activity towards ORR. Pt–ZrO2/carbon shows nine times more stability than Pt/C and this improvement of ORR activity was mainly due to the synergetic effect of Pt and ZrO2.14
4 (Pt–ZrO2/carbon) electrocatalyst enhanced the ethanol electro-oxidation reaction than that of Pt/C.13 Similarly, Cheng et al., explored that Pt encapsulated in a zirconia nanocage by area selective atomic layer deposition, indicated very high stability and activity towards ORR. Pt–ZrO2/carbon shows nine times more stability than Pt/C and this improvement of ORR activity was mainly due to the synergetic effect of Pt and ZrO2.14
In the present studies, we report optimum levels of carbon held in tetragonal ZrO2-phase (Zr–C) nanospheres supported Pt can greatly improve the fuel cell performance and platinum stability. To the best of our knowledge, in-depth study of Pt on lower amount of carbon embraced with ZrO2 electrocatalyst for cell mode system and long-term durability has not been reported in the literature. In this study, we have described the low temperature method for the synthesis of high-purity ZrO2 nanoparticles having tetragonal phase followed by compositing different ratios of carbon to it. Finally, Pt is deposited on various ratios of carbon with ZrO2. The structural studies, morphologies, oxidation states and elemental compositions of synthesized electrocatslysts were investigated by various characterizations.
2. Experimental section
Carbon held ZrO2 nanospheres by low temperature method
In brief, 3 ml of zirconium isopropoxide was added drop-wise in to 60 ml of 1![[thin space (1/6-em)]](https://www.rsc.org/images/entities/char_2009.gif) :
:![[thin space (1/6-em)]](https://www.rsc.org/images/entities/char_2009.gif) 1 ratio of ethanol
1 ratio of ethanol![[thin space (1/6-em)]](https://www.rsc.org/images/entities/char_2009.gif) :
:![[thin space (1/6-em)]](https://www.rsc.org/images/entities/char_2009.gif) water mixture followed by stirring for 1 h at below 5 °C. 100 mg of Vulcan carbon was dispersed ultrasonically in 5 ml of water and added to the mixture and stirred for 24 h in an ice bath. The precipitate was washed with Millipore water and dried at 100 °C for 12 h. Then, the sample was calcined at 500 °C for 2 h under nitrogen atmosphere in order to obtain carbon–ZrO2 composites and was marked as Zr–C 1. Similarly, the carbon weight was varied from 0, 200, 300 and 600 mg while keeping the amount of zirconium isopropoxide as a constant and the samples were marked as ZrO2, Zr–C 2, Zr–C 3 and Zr–C 4, respectively.
water mixture followed by stirring for 1 h at below 5 °C. 100 mg of Vulcan carbon was dispersed ultrasonically in 5 ml of water and added to the mixture and stirred for 24 h in an ice bath. The precipitate was washed with Millipore water and dried at 100 °C for 12 h. Then, the sample was calcined at 500 °C for 2 h under nitrogen atmosphere in order to obtain carbon–ZrO2 composites and was marked as Zr–C 1. Similarly, the carbon weight was varied from 0, 200, 300 and 600 mg while keeping the amount of zirconium isopropoxide as a constant and the samples were marked as ZrO2, Zr–C 2, Zr–C 3 and Zr–C 4, respectively.
40 wt% Pt deposited on carbon held zirconia by polyol method
In brief, 120 mg of Zr–C 1 was dispersed in 1![[thin space (1/6-em)]](https://www.rsc.org/images/entities/char_2009.gif) :
:![[thin space (1/6-em)]](https://www.rsc.org/images/entities/char_2009.gif) 4 ratio of water
4 ratio of water![[thin space (1/6-em)]](https://www.rsc.org/images/entities/char_2009.gif) :
:![[thin space (1/6-em)]](https://www.rsc.org/images/entities/char_2009.gif) ethylene glycol and stirred for 12 h. The required amount of H2PtCl6·6H2O was dissolved in 1
ethylene glycol and stirred for 12 h. The required amount of H2PtCl6·6H2O was dissolved in 1![[thin space (1/6-em)]](https://www.rsc.org/images/entities/char_2009.gif) :
:![[thin space (1/6-em)]](https://www.rsc.org/images/entities/char_2009.gif) 3 ratio of water
3 ratio of water![[thin space (1/6-em)]](https://www.rsc.org/images/entities/char_2009.gif) :
:![[thin space (1/6-em)]](https://www.rsc.org/images/entities/char_2009.gif) ethylene glycol and added dropwise to the above mixture and stirred for 12 h. The pH was adjusted to 13 by adding NaOH and the temperature was maintained at 150 °C for 6 h. The obtained sample was filtered and repeatedly washed with Millipore water and dried at 100 °C for 12 h. Pt deposited on Zr–C 1 is represented as Pt/Zr–C 1. Similarly, Pt was deposited by above method on ZrO2, Zr–C 2, Zr–C 3 and Zr–C 4 was marked as Pt/ZrO2, Pt/Zr–C 2, Pt/Zr–C 3 and Pt/Zr–C 4 respectively.
ethylene glycol and added dropwise to the above mixture and stirred for 12 h. The pH was adjusted to 13 by adding NaOH and the temperature was maintained at 150 °C for 6 h. The obtained sample was filtered and repeatedly washed with Millipore water and dried at 100 °C for 12 h. Pt deposited on Zr–C 1 is represented as Pt/Zr–C 1. Similarly, Pt was deposited by above method on ZrO2, Zr–C 2, Zr–C 3 and Zr–C 4 was marked as Pt/ZrO2, Pt/Zr–C 2, Pt/Zr–C 3 and Pt/Zr–C 4 respectively.
Materials and electrochemical characterization
X-ray diffraction (XRD) patterns were recorded between 10 and 80° using BRUKER-binary V3. High resolution transmission electron microscopy (HR-TEM) images were taken on Technai-20 G2 and STEM images were recorded using HAADF detector. Field emission scanning electron spectroscopy (FE-SEM) images were examined from JEOL-7001. X-ray photoelectron spectroscopy (XPS) was measured on Omicron nanotechnology instrument. CO2 emission was observed using CO2 sensor (Vaisala CO2 sensor). The elemental compositions were calculated by ICP-OES (PERKIN ELMER OPTIMA 5300 DV). The percentage of carbon was studied by CHNS analyser using Elementar Vario EL III.Electrochemical characterization
The electrochemical studies were accompanied using three electrode electrochemical cell arrangements. A saturated calomel electrode (SCE) and Pt mesh were used as reference and counter electrode, respectively. 2 mg of synthesized electrocatalyst was ultrasonically dispersied with 1.5 ml of water and 5 wt% of Nafion ionomer solution to obtain the ink. The required amount of ink was uniformly spread on the glassy carbon (GC) electrode. The Pt metal loading on the surface of polished GC disk is maintained about 40 μgPt cm−2. Cyclic voltammetry (CV) measurements were carried out between 0 to 1 V with respect to reversible hydrogen electrode (RHE) at a sweep rate of 20 mV s−1 in de-aerated 0.1 M HClO4 electrolyte. Linear sweep voltammogram (LSV) experiments were carried out using rotating disk electrode at a scan rate of 10 mV s−1. The experiments were conducted on Autolab PGSTAT-30 at room temperature at 25 °C. The stability test was carried out by potential between 0.6 and 1.2 V vs. RHE with scan rate of 40 mV s−1.The membrane electrode assembly (MEA) fabrication and performance evaluation
In brief, the required amount of synthesized electrocatalyst dispersed in water (200 μl) and Nafion (7 wt% for anode and 30 wt% for cathode) was added followed by IPA and sonicated for 45 min. The catalysts were coated on to the commercial carbon paper (DC-35 with GDL thickness of 20 μm) to form the catalyst layers (Pt/C for anode) and (various electrocatalysts for cathode) with a Pt loading of 0.15 ± 0.01 mg cm−2. MEA was prepared by hot-pressing the Nafion 211 membrane between electrodes, bearing synthesized electrocatalyst (Pt/Zr–C) as cathode and commercial Pt/C as an anode at 60 kg cm−2 and 130 °C for 2 min. MEAs were assessed for electrochemical performance with 25 cm2 fuel cell setup procured from M/s Fuel Cell Technologies Inc., USA. The steady-state polarization were recorded at 65 °C under H2:O2 condition under 100% relative humidity (RH) at both side and test was carried out FCT 150 S procured from Bio-Logic science instrument, France. Accelerated stress test (AST) was carried out in the potential range between 1 and 1.6 V vs. dynamic hydrogen electrode (DHE) at scan rate of 500 mV s−1. The cell temperature was maintained at 75 °C with fully humidified condition for both anode and cathode, respectively.3. Results and discussion
The X-ray diffraction patterns of ZrO2 and Zr–C show sharp “Z” peaks which are reflections with tetragonal ZrO2 framework lattice plane, in good agreement with JCPDS (88-1007) are shown in Fig. 1. Similarly, “C” peak at 24.8° is attributed to (002) diffraction plane, confirms that Vulcan carbon has an intermediate structure between amorphous and graphitic nature represented as turbostratic structure.15 In the XRD patterns of Pt deposited on C, ZrO2 and Zr–C, the peaks at 39.9, 46.4 and 67.8° correspond to (111), (200) and (220) planes respectively and this confirms that Pt is in the metallic state with face-centered cubic structure (JCPDS # 87-0647) as shown in Fig. 1. The average particle size of Pt for Pt deposited ZrO2, Zr–C 1, Zr–C 2, Zr–C 3, Zr–C 4 and C are observed as 5.8, 5.2, 5.0, 4.7, 4.2 and 3.5 ± 0.2 nm which is calculated from peak at 39.9° using the Scherer's formula.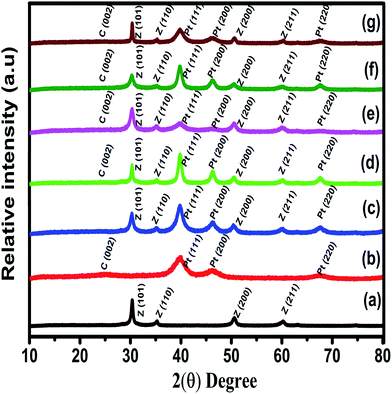 | ||
| Fig. 1 Powder XRD pattern of (a) ZrO2, (b) Pt/C, (c) Pt/ZrO2, (d) Pt/Zr–C 1, (e) Pt/Zr–C 2, (f) Pt/Zr–C 3 and (g) Pt/Zr–C 4 electrocatalysts. | ||
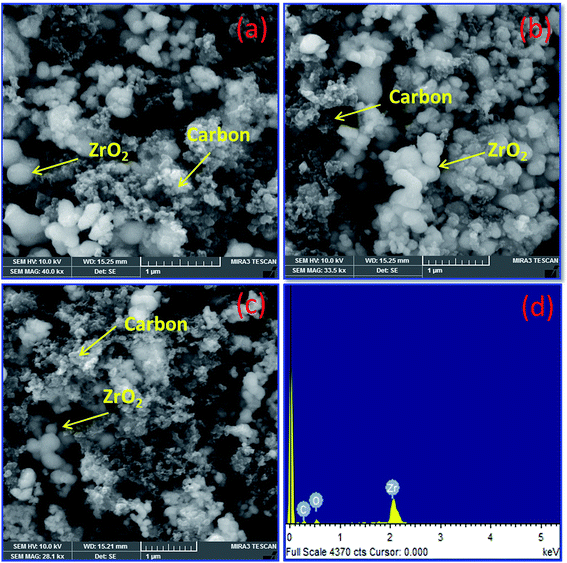
Fig. 2(a–d) depicts FE-SEM and EDX images for various percentage of carbon nanoparticles held with ZrO2 nanospheres synthesized by the low temperature method followed by heat treatment at 500 °C. Fig. 2 shows that both carbon and ZrO2 consist of nanospheres morphology. The EDX results indicate that the Pt composition comprises 39–41 wt%. In addition to that, the percentage of carbon and Pt are calculated from EDX, CHNS, and ICP-OES as represented in Table 1. A higher magnified TEM image of Pt on carbon (commercial Pt/C) is shown in Fig. 3(a). The Pt metal nanoparticles are distributed uniformly on the carbon. Similarly the lower magnified image and particle size histogram also clearly show that, Pt nanoparticles are well distributed on carbon and the majority of particle size are found to be 1–3 nm as shown in Fig. 3(b and c). Fig. 3(d) shows a higher magnified TEM micrograph of Pt deposited on Zr–C 3. The carbon nanoparticles are embraced in zirconia and the overall Pt metal nanoparticles are fairly distributed on Zr–C 3. In addition, Fig. 3(e and f) reveal that, in the lower magnified region Pt nanoparticles are well distributed on Zr–C and the maximum number of particle size are found to be 5–6 nm. Similarly, for Zr–C 4, there is a increased Pt distributution with decreased particle size as shown in Fig. 3(g–i). In addition, STEM image for Pt deposited on Zr–C 3 are represented in Fig. 4. The overall and individual elemental mapping also clearly show the distribution of carbon over the ZrO2 and also Pt metal nanoparticles are fairly distributed on Zr–C 3 framework.
| Sample ID | Heat treated method 600 °C/3 h | EDX C (wt%) | CHNS analysis C (±1%) | ICPOESa Pt wt% (±2%) | |
|---|---|---|---|---|---|
| Initial weight | Final weight | ||||
| a ICP-OES carried out for Pt deposited on carbon, ZrO2, Zr–C materials. | |||||
| Carbon | 20 mg | 0 mg | 95–96 | 60 | 39 |
| ZrO2 | 20 mg | 19.8 mg | 0 | 0 | 41 |
| Zr–C 1 | 20 mg | 18.0 mg | 10–12 | 9–10 | — |
| Zr–C 2 | 20 mg | 16.1 mg | 18–20 | 14–15 | 39 |
| Zr–C 3 | 20 mg | 13.5 mg | 25–28 | 19–20 | 39 |
| Zr–C 4 | 20 mg | 10.2 mg | 40–43 | 28–30 | 40 |
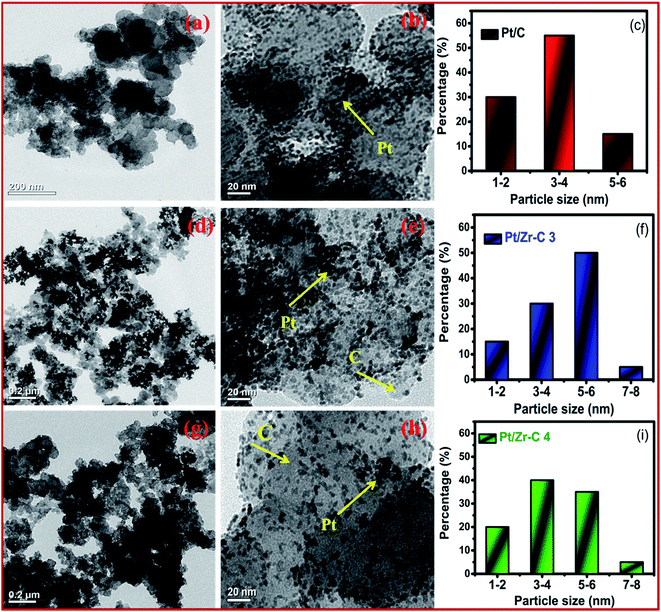 | ||
| Fig. 3 TEM image of higher and lower magnified region and particles size histogram for (a–c) Pt/C, (d–f) Pt/Zr–C 3 and (g–i) Pt/Zr–C 4 electrocatalyst. | ||
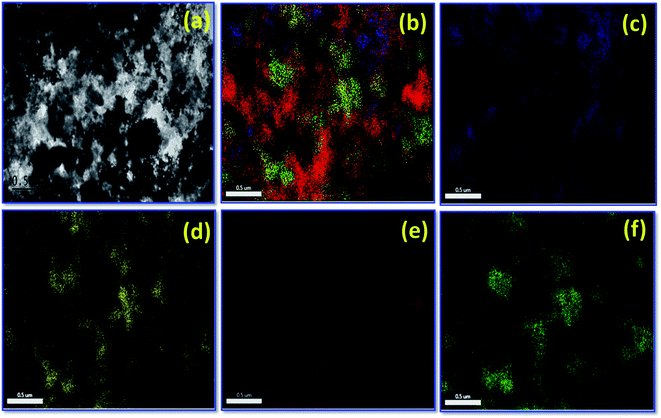 | ||
| Fig. 4 HR-TEM image for (a) Pt/Zr–C 3, (b) S-TEM overall mapping for Pt/Zr–C 3, (c–f) individual elemental mapping, (c) carbon, (d) oxygen, (e) platinum and (f) zirconium. | ||
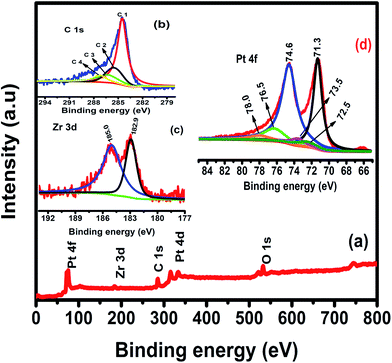
To confirm the chemical oxidation state of Pt/Zr–C 3 electrocatalyst, XPS measurement was carried out. XPS survey spectrum for Pt/Zr–C 3 in Fig. 5(a) shows the predominant peaks of Pt, Zr, C, O and no other impurities are detected. De-convoluted carbon 1s peak in Fig. 5(b) shows the four binding energy peaks such as 284.6 (C1), 285.3 (C2), 286.5 (C3) and 287.7 (C4) eV that are attributed to the graphitic (C–C) or sp2 hybridized carbon from carbon tapes, hydroxyl groups (C–OH), phenol/ether (C–O) or carbonated species and carbonyl/quinone groups or Zr–O–C formation, respectively which is in good agreement with literature reports.16–19 Fig. 5(c) shows the de-convoluted peak of Zr 3d 5/2 and 3/2 at 182.9 and 185 eV corresponding to Zr (+4) oxidation state of ZrO2 framework.20,21 Fig. 5(d) shows the Pt 4f core level peaks of Pt/Zr–C 3, the solid peaks at 71.3 and 74.6 eV are ascribed to Pt 4f7/2 and 4f5/2 which indicates the Pt in metallic state. Similarly, a minor doublet peak at 72.5 and 76.5 eV and the smaller peak at 73.5 and 78.0 eV are expected to be in Pt (+2) and (+4) oxidation states respectively.
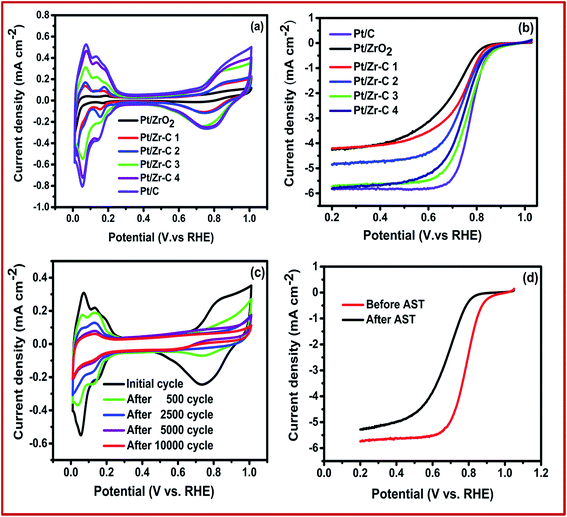
ORR activity and catalyst stability were studied by using conventional three electrode configuration. Fig. 6(a) shows the CV curve for commercial and synthesized electrocatalyst in N2 saturated electrolyte solution at room temperature. Pt electrochemical surface area (ECSA) was calculated from CV in the region from 0.05 to 0.35 V for Pt/C, Pt/ZrO2, Pt/Zr–C 1, Pt/Zr–C 2, Pt/Zr–C 3 and Pt/Zr–C 4 to be 65, 18, 24, 32, 45, 59 m2 g−1 respectively. Fig. 6(b) shows the LSV curve for Pt deposited on C, ZrO2 and Zr–C electrocatalyst in O2 saturated electrolyte solution at 1600 rpm. The onset potential of Pt deposited on Zr–C 3 and Zr–C 4 shows 0.9 V which is almost similar to Pt/C. Besides, the mass and specific activity of Pt/C is observed to be 0.725 μA μgPt−1 and 0.0064 mA cm−2 PtECSA at 0.85 V. Whereas, the optimum composition of Zr–C 3 supported Pt electrocatalyst shows the mass and specific activity of 0.875 μA μgPt−1 and 0.01 mA cm−2 PtECSA, which is higher than that of other electrocatalyst. In addition, the electrocatalyst durability was conducted by potential cycling between 0.6 and 1.2 V in a N2-saturated 0.1 M HClO4 solution at a scan rate of 40 mV s−1. To calculate the ECSA at regular intervals, CV was recorded from 0 to 1 V vs. RHE at scan rate of 20 mV s−1. Fig. 6(c) shows the CV at different intervals during the AST for Pt/Zr–C 3. Fig. 6(c) shows that for Pt/Zr–C 3 after 2500 cycles, the ECSA dropped from 45 to 35 m2 g−1 and after 10![[thin space (1/6-em)]](https://www.rsc.org/images/entities/char_2009.gif) 000 potential cycles it is observed to be 22 m2 g−1.
000 potential cycles it is observed to be 22 m2 g−1.
The three electrode system experimental results confirm that, the Pt deposited on Zr–C 3 electrocatalyst has higher onset potential and specific activity than other synthesized electrocatalyst. In addition, a limiting current density of 5.8 mA cm−2 at 1600 rpm is observed for Pt/C, which is in good agreement with theoretical value.22 However, slight variation in limiting current density for Pt/Zr–C 3 is mainly due to the larger size of Pt particles and agglomeration as shown in Fig. 6(b). Our previous studies reported that, the initial ECSA of Pt/C is observed as 65 m2 g−1 which is decreased to 20 m2 g−1 after 2500 AST cycles between 0.6 and 1.2 V and further rapidly reduced to 5 m2 g−1 after 10![[thin space (1/6-em)]](https://www.rsc.org/images/entities/char_2009.gif) 000 AST cycles. Similarly, the initial onset potential for ORR of Pt/C moved from 0.9 V to 0.7 V after 10
000 AST cycles. Similarly, the initial onset potential for ORR of Pt/C moved from 0.9 V to 0.7 V after 10![[thin space (1/6-em)]](https://www.rsc.org/images/entities/char_2009.gif) 000 cycles and the maximum limiting current density has come down to 2.8 mA cm−2 from 5.8 mA cm−2.23 The loss in ECSA and ORR activity for Pt/C during AST, may be due to carbon corrosion and Pt dissolution which is in good agreement with the various literature reports.4,5,24,25 Whereas, for Pt on Zr–C 3 electrocatalyst retains 48% of initial ECSA even after 10
000 cycles and the maximum limiting current density has come down to 2.8 mA cm−2 from 5.8 mA cm−2.23 The loss in ECSA and ORR activity for Pt/C during AST, may be due to carbon corrosion and Pt dissolution which is in good agreement with the various literature reports.4,5,24,25 Whereas, for Pt on Zr–C 3 electrocatalyst retains 48% of initial ECSA even after 10![[thin space (1/6-em)]](https://www.rsc.org/images/entities/char_2009.gif) 000 AST cycles as seen from Fig. 6(c). Similarly, LSV plots for Pt/Zr–C 3 electrocatalysts before and after AST in O2-saturated 0.1 M HClO4 solution at a rotation rate of 1600 rpm are shown in Fig. 6(d). The initial onset potential shifted from 0.9 to 0.83 V after 10
000 AST cycles as seen from Fig. 6(c). Similarly, LSV plots for Pt/Zr–C 3 electrocatalysts before and after AST in O2-saturated 0.1 M HClO4 solution at a rotation rate of 1600 rpm are shown in Fig. 6(d). The initial onset potential shifted from 0.9 to 0.83 V after 10![[thin space (1/6-em)]](https://www.rsc.org/images/entities/char_2009.gif) 000 cycles and limiting current densities change slightly in the ORR activity as shown in Fig. 6(d).
000 cycles and limiting current densities change slightly in the ORR activity as shown in Fig. 6(d).
In order to determine the effect of the ZrO2 mass fraction towards fuel cell performance, fuel cells assembled with Pt/C, Pt/ZrO2, Pt/Zr–C 1, Pt/Zr–C 2, Pt/Zr–C 3 and Pt/Zr–C 4 cathode electrodes were examined at 100% RH with cell operating temperature at 65 °C. Fig. 7(a) shows the corresponding I–V and power density curve. PEFC with 30 wt% of carbon held with ZrO2 supported Pt (Pt/Zr–C 3) delivers a higher current density of 1.15 A cm−2 at 0.6 V and a peak power density of 1.12 W cm−2 compared to 0.8 W cm−2 for Pt/C. Fig. 7(b) shows the cell mode cyclic voltammogram of Pt/C and synthesized electrocatalysts. Fig. 7(c) shows that the effect of relative humidity for PEFCs with anode and cathode varied from 30 to 100% with the cell temperature maintained at 65 °C. At 100% humidity at the cathode, a maximum current density of 1.15 A cm−2 at 0.6 V is observed. It is to be noted that cell performance at above 50% RH is not drastically decreased or changed. This results confirm that ZrO2–carbon composite framework has better water retention property in three phase boundary maintaining the fuel cell performance. Fig. 7(d) shows the effect of applying back pressure for Pt/Zr–C 3 cathode electrocatalyst during the test. The metal loading (0.15 mg cm−2) and relative humidity (100%) is fixed for both anode and cathode, respectively. While applying back pressure from 0 to 1.5 bar, the peak power density of PEFC comprising Pt/Zr–C 3 cathode electrocatalyst increased from 1.15 to 2.2 A cm−2 at 0.6 V.
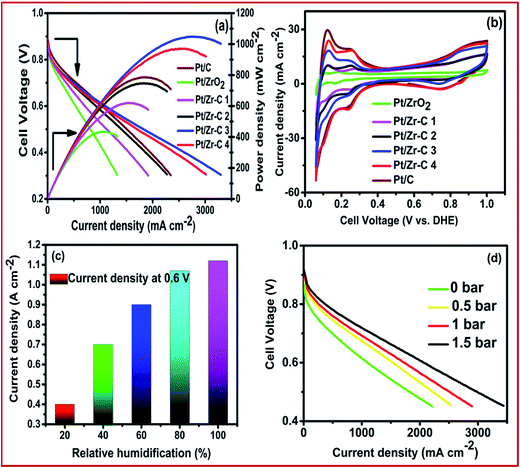 | ||
| Fig. 7 (a) Steady state cell polarization (b) cyclic voltammetry, (c) effect of relative humidity and (d) effect of back pressure for cathode electrocatalysts. | ||
The fuel cell electrocatalyst stability of synthesized electrocatalyst is studied by cycling from the potential range of 1 to 1.6 V vs. DHE. As per the DOE protocol, there is a requirement of 50% of initial activity of the catalyst to be retained while cycling between 1 and 1.5 V up to 6000 cycles. In the present study, electrochemical stability and cell performance of Pt deposited on carbon (commercial), Zr–C 1, Zr–C 3 and Zr–C 4 were studied by potential cycling between 1 and 1.6 V vs. DHE with a scan rate of 500 mV s−1. During the accelerated stress test (AST) cycles, hydrogen gas (200 ml min−1) was passed into the anode and high purity nitrogen gas (70 ml min−1) was passed in to the cathode while 100% RH was maintained with a cell temperature of 75 °C. The gas flow rates were controlled by digital mass flow controllers. The steady state polarizations and cyclic voltammetry (CV, from 0.05 to 1 vs. DHE) were recorded at regular intervals. Fig. 8(a) shows the I–V for commercial Pt deposited on carbon. Before AST, a current density of 1.025 A cm−2 at 0.6 V is observed for Pt/C. After 1000 and 3000 AST cycles, the initial cell performance dropped drastically and is observed to be 0.57 and 0.29 A cm−2 respectively. Fig. 8(b) shows Pt/Zr–C 1 with minimal amount of carbon, the current density slightly reduced from 0.70 to 0.5 A cm−2 even after 6000 potential cycles. Fig. 8(c) for Pt/Zr–C 3 with optimum percentage shows a current density of 1.15 A cm−2 at 0.6 V before AST, however after 6000 AST cycles, current density is retained to 0.82 A cm−2. Similarly, Fig. 8(d) for Pt/Zr–C 4 with higher carbon content, the current density was observed during the AST from 1.07 to 0.60 A cm−2 after 3000 potential cycles.
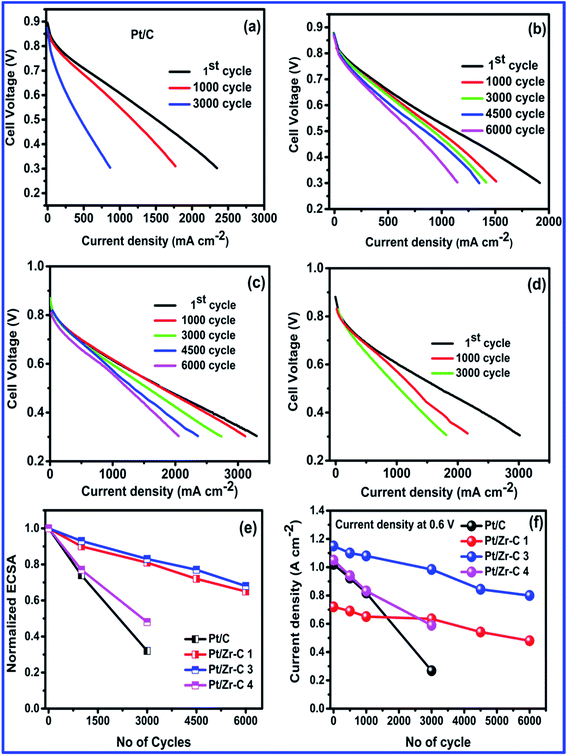 | ||
| Fig. 8 AST cycling between 1 and 1.6 V, (a–d) before and after AST for Pt/C, Pt/Zr–C 1, Pt/Zr–C 3 and Pt/Zr–C 4, (e) normalized ECSA and (f) current density vs. number of cycles. | ||
The normalized ECSA and current density for Pt/C and synthesized electrocatalysts in relation to AST cycles is given in Fig. 8(e and f). ECSA decreased for both Pt/C and carbon rich Zr–C 4 supported Pt after 3000 cycles. However, the optimum level of carbon inter-connected with ZrO2 (Zr–C 1 and Zr–C 3) retains 70% of initial ECSA even after 6000 cycles. Similarly, I–V curves also clearly show that Pt/Zr–C 1 and Pt/Zr–C 3 retain 70% of the initial fuel cell performance even after 6000 cycles, whereas the performance of Pt/C and Pt/Zr–C 4 is reduced by up to 50% from the initial value after 3000 cycles.
During AST, 1000–1500 ppm of CO2 emission was observed for Pt/C at the cathode outlet, which clearly indicated that carbon corrosion happens at a potential higher than 1 V. For Pt/Zr–C 3, only 150–300 ppm of CO2 emission was observed. This may be due to corrosion of carbon which is not held in ZrO2. Similarly, the CO2 emission for carbon rich Zr–C 4 was 1000–1200 ppm and for the composite with lower amount of carbon (Zr–C 1), the emission was 100–200 ppm. In addition, inductively coupled plasma optical emission spectroscopy studies (ICP-OES) were conducted on the by-product (water) derived from the cathode outlet of the sample for which AST was carried out. ICP-OES results show that Pt dissolution for Pt/C, Pt/Zr–C 1, Pt/Zr–C 3 and Pt/Zr–C 4 are 0.83, 0.42, 0.5 and 0.66 mg L−1, respectively.
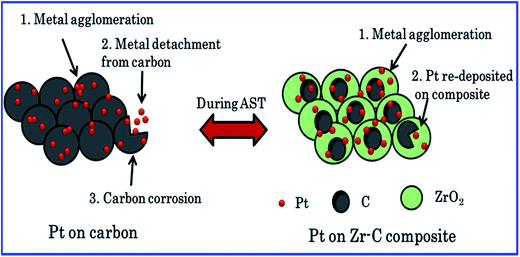
The fuel cell experimental results also clearly show that the carbon held with ZrO2 materials enhances the fuel cell performance and retained the Pt ECSA and long-term durability in PEFCs. Zirconia could prevent the Pt nanoparticles agglomeration, migration and also reduce the carbon corrosion. According to ICP-OES result, Pt diffusion of dissolved Pt species on carbon increased, whereas Pt dissolution decreased while increasing the mass fraction of ZrO2 in relation to carbon. Scheme 1 illustrate the Pt/C and Pt/Zr–C 3 electrocatalysts degradation process during AST. For Pt deposited on carbon fuel cell performance was rapidly decreased during AST due to (1) increased carbon corrosion confirmed from CO2 emission, (2) agglomeration of Pt particle, (3) dissolution of Pt particles confirmed from ICP-OES which is in good agreement with literatures.3,4,21,24 Whereas, for Pt on optimum level of carbon composite with ZrO2 (Pt/Zr–C 3) during the AST shows that 70% of initial performance is retained due to (1) reduced carbon corrosion (confirmed from CO2 emission) as compared to Pt/C, (2) stabilized Pt nanoparticles, (3) re-deposition of Pt nanoparticles on the ZrO2:C composite during the AST (minimal Pt dissolution loss is observed as compared to Pt/C confirmed from ICP-OES). It is evident that Zr–C 3 supported Pt has higher durability and is found to be more stable than Pt/C.
We report the stability and long-term durability of Pt deposited on Zr–C electrocatalysts and the optimum level of carbon held with ZrO2 nanospheres (Pt/Zr–C 3) retains more than 70% of initial fuel cell performance and ECSA even after 6000 cycles between 1 and 1.6 V. As envisaged, optimum level of Vulcan XC 72 carbon composite with ZrO2, shows increasing fuel cell performance than Pt/C by improved electron transfer. As inferred, optimum level of carbon makes ideal electrical pathway with reduced ZrO2 resistance and further enhanced the triple phase boundary with more engaging Pt nanoparticles. It is to be noted that optimizing the carbon content in ZrO2 is critical as excess carbon may partially cover the active sites and prevent the oxygen transfer.26–31 The experimental results also clearly shows that Pt deposited on metal oxide-carbon composite (ZrO2–C) is more suitable to improve strong interaction between Pt–ZrO2–C and effectively prevent the Pt agglomeration, dissolution and carbon corrosion, retaining long term stability of PEFCs. Thus, optimum levels of carbon held with ZrO2 supported Pt proves to be stable under detrimental conditions such as higher potentials (1 to 1.6 V) and low RH. Future studies are in the direction towards 100 cm2 active area membrane electrode assemblies with 3 cell stack durability from indigenous cell fixture design using Zr–C 3 supported Pt electrocatalyst.
4. Conclusions
Pure tetragonal phase ZrO2 nanospheres held carbon was synthesized by low temperature method. ZrO2 held carbon supported Pt as cathode electrocatalyst has enhanced the fuel cell performance. Suitable optimization of carbon held with ZrO2 supported Pt improves the long-term durability even after 6000 potential cycles between 1 and 1.6 V. The AST results have shown that Pt on Zr–C composite has more stability than Pt deposited on carbon. Physical and electrochemical characterization results, confirmed that an optimum level of carbon held ZrO2 supported Pt is a more promising alternative cathode electrocatalyst for PEFCs.Conflicts of interest
There are no conflicts to declare.Acknowledgements
SDB is thankful for a CSIR-YSA research grant (DU-MLP-0090) and PD thanks CSIR for the funding through Research Associateship.References
- S. P. S. Badwal, S. S. Giddey, C. Munnings, A. I. Bhatt and A. F. Hollenkamp, Front. Chem., 2014, 2, 1–28 CrossRef CAS PubMed.
- U. S. Department of Energy, Energy Efficiency and Fuel Cell Technologies, in Comparison of Fuel Cell Technologies, 2011 March Search PubMed.
- J. Larminie and A. Dicks, Fuel cell systems explained, Wiley, England, 2003 Search PubMed.
- E. Antolini, Appl. Catal., B, 2009, 88, 1–24 CrossRef CAS.
- E. Antolini, J. Mater. Sci., 2003, 38, 2995–3005 CrossRef CAS.
- Z. Zhang, J. Liu, J. Gu, L. Su and L. Cheng, Energy Environ. Sci., 2014, 7, 2535–2558 CAS.
- P. Dhanasekaran, S. V. Selvaganesh and S. D. Bhat, J. Power Sources, 2016, 304, 360–372 CrossRef CAS.
- H. Lu, N. Cheng, T. Peng, M. Pan and S. Mu, J. Mater. Chem., 2012, 22, 1135–1141 RSC.
- L. Li and W. Wang, Solid State Commun., 2003, 127, 639–643 CrossRef CAS.
- J. Lu, J. B. Zang, S. X. Shan, H. Huang and H. Wang, Nano Lett., 2008, 8, 4070–4074 CrossRef CAS PubMed.
- G. Liu, H. Zhang, H. Zhong, J. Hu, D. Xu and Z. Shao, Electrochim. Acta, 2006, 51, 5710–5714 CrossRef CAS.
- G. Liu, H. Zhang and Y. Ma, Mater. Sci. Forum, 2007, 561, 1589–1592 CrossRef.
- Y. Bai, J. Wu, J. Xi, J. Wang, W. Zhu, L. Chen and X. Qiu, Electrochem. Commun., 2005, 7, 1087–1090 CrossRef CAS.
- N. Cheng, M. N. Banis, J. Liu, A. Riese, X. Li, R. Li, S. Ye, S. Knights and X. Sun, Adv. Mater., 2014, 27, 277–281 CrossRef PubMed.
- M. J. Lazaro, L. Calvillo, V. Celorrio, J. I. Pardo, S. Perathoner and R. Moliner, Study and application of carbon black vulcan XC-72R in polymeric electrolyte fuel cells, Nova Science Publishers, Inc, 2011, ch 2 Search PubMed.
- S. M. Senthil Kumar, J. S. Herrero, S. Irusta and K. Scott, J. Electroanal. Chem., 2010, 647, 211–221 CrossRef CAS.
- Q. Xiao and L. Ouyang, Chem. Eng. J., 2009, 148, 248–253 CrossRef CAS.
- P. Dhanasekaran, S. V. Selvagenesh and S. D. Bhat, New J. Chem., 2017, 41, 13012–13026 RSC.
- M. Balaceanu, M. Braic, V. Braic, A. Vladescu and C. C. Negrila, J. Optoelectron. Adv. Mater., 2005, 7, 2557–2560 CAS.
- S. N. Basahel, T. T. Ali, M. Mokhtar and K. Narasimharao, Nanoscale Res. Lett., 2015, 10(73), 1–13 CAS.
- C. D. Wagner, W. M. Riggs, L. E. Davis, L. F. Moulder and D. Briggs, Handbook of X-ray photoelectron spectroscopy, Perkin Elmer Corporation, USA, 1979 Search PubMed.
- K. J. Mayrhofer, D. Strmenik, B. B. Blizanac, V. Stamenkovic, M. Arenzand and N. M. Markovic, Electrochim. Acta, 2008, 53, 3181–3188 CrossRef CAS.
- P. Dhanasekaran, S. V. Selvaganesh and S. D. Bhat, New J. Chem., 2017, 41, 2987–2996 RSC.
- S. K. Zevevic, J. S. Wainright, M. H. Litt, S. L. Gojkovic and R. F. Savinell, J. Electrochem. Soc., 1997, 144, 2973–2982 CrossRef.
- J. Speder, A. Zana, I. Spanos, J. J. Kirkensgaard, K. Mortensen, M. Hanzlik and M. Arenz, J. Power Sources, 2017, 261, 14–22 CrossRef.
- H. N. Yang, W. H. Lee, B. S. Choi, Y. D. Ko, S. C. Yi and W. J. Kim, Energy, 2017, 120, 12–19 CrossRef CAS.
- S. Chung, M. Choun, B. Jeong, J. Lee and J. Lee, J. Energy Chem., 2016, 25, 258–264 CrossRef.
- Y. Ji, Y. Cho, Y. Jeon, C. Lee, D. Park and Y. Shul, Appl. Catal., B, 2017, 204, 421–429 CrossRef CAS.
- R. Wang, K. Wang, H. Wang, Q. Wang, J. Key, V. Linkov and S. Ji, Int. J. Hydrogen Energy, 2013, 38, 5783–5788 CrossRef CAS.
- T. Mittermeier, P. Madkikar, X. Wang, H. A. Gasteiger and M. Piana, J. Electrochem. Soc., 2016, 163, F1543–F1552 CrossRef CAS.
- N. Cheng, J. Liu, M. N. Banis, D. Geng, R. Li, S. Ye, S. Knights and X. Sun, Int. J. Hydrogen Energy, 2014, 39, 15967–15974 CrossRef CAS.
| This journal is © The Royal Society of Chemistry 2018 |

