
 Open Access Article
 This Open Access Article is licensed under a Creative Commons Attribution-Non Commercial 3.0 Unported Licence
Highly improved visible-light-induced photocatalytic performance over BiOI/Ag2CO3 heterojunctions†
Nan Wanga,
Lei Shi *a,
Lizhu Yaoa,
Caiyun Lua,
Yan Shia and
Jianmin Sun*b
*a,
Lizhu Yaoa,
Caiyun Lua,
Yan Shia and
Jianmin Sun*b
aCollege of Chemistry, Chemical Engineering and Environmental Engineering, Liaoning Shihua University, Fushun 113001, China. E-mail: shilei_hit@qq.com; Tel: +86-18340316558
bState Key Laboratory of Urban Water Resource and Environment, MIIT Key Laboratory of Critical Materials Technology for New Energy Conversion and Storage, School of Chemistry and Chemical Engineering, Harbin Institute of Technology, Harbin 150080, China. E-mail: sunjm@hit.edu.cn
First published on 2nd January 2018
Abstract
A novel BiOI/Ag2CO3 composite was synthesized through the co-precipitation method and well characterized by X-ray diffraction, Fourier transform infrared spectroscopy, X-ray photoelectron spectroscopy, scanning electron microscopy, transmission electron microscopy, energy dispersive X-ray spectroscopy, UV-vis diffuse reflectance spectroscopy and photoluminescence spectroscopy. Its photocatalytic activity was evaluated for degrading various pollutants (rhodamine B, methylene blue, methyl orange) and phenol aqueous solution. Experimental results indicated that Ag2CO3 nanoparticles anchored on the BiOI sheet surface promoted the enhanced photocatalytic activity. Moreover, when the mass ratio of BiOI in BiOI/Ag2CO3 composites was 20%, the as-prepared BiOI/Ag2CO3 (20 wt%) composite exhibited the optimal photocatalytic activity for degrading rhodamine B; its rate constant was approximately 6.75 and 4.3 times higher than the separate BiOI and Ag2CO3. The enhanced photocatalytic performance could be attributed to the heterojunctions between BiOI and Ag2CO3. Furthermore, the possible mechanism for photodegradation over the BiOI/Ag2CO3 composite is proposed.
1. Introduction
Semiconductor photocatalysis has received a great deal of attention because it represents a promising alternative technology for efficient utilization of solar energy to solve energy and environmental problems.1 Among all kinds of semiconductor photocatalysts, TiO2 has been the most widely investigated due to its low cost, non-toxicity, strong oxidizing activity and high chemical stability. Nevertheless, the large band gap and the inefficient separation of photoinduced hole–electron pairs result in its unsatisfactory photocatalytic performance.2 Accordingly, to take full advantage of solar energy, it is essential to exploit effective and sustainable photocatalysts with visible-light-induced photocatalytic capability.Recently, Ag-based photocatalysts, including Ag2O,3 Ag3PO4,4,5 AgX (X = Cl, Br, I),6–8 AgVO3,9 Ag2CrO4,10 and Ag2WO4,11 have been regarded as promising photocatalysts. Among them, Ag2CO3 has exhibited highly efficient photocatalytic property for decomposing methylene blue, rhodamine B and methyl orange dyes.12,13 However, due to self-photocorrosion, Ag2CO3 possesses weak activity after recycling.14,15 Hence, it is urgent to develop some method to improve the stability of Ag2CO3.
A group of efficient visible-light-driven photocatalysts, BiOX (X = Cl, Br, and I), has shown superb visible light activity for energy conversion and environmental remediation, attributed to particular physicochemical properties.16–18 Among the BiOX catalysts, BiOI presents the lowest band gap (1.7–1.9 eV), revealing excellent visible-light responsiveness and photocatalytic capacity.19 However, high recombination of photogenerated electron–hole pairs restricts its photocatalytic performance. Previous reports implied that heterojunctional structure could promote the separation of photogenerated electrons and holes.20–22 Hence, it is possible that the coordination of BiOI and Ag2CO3 might produce better photocatalytic activity than pure BiOI or Ag2CO3. However, there are few works focusing on the preparation and photocatalytic performance of BiOI/Ag2CO3 composites.
In this work, we successfully synthesized BiOI/Ag2CO3 heterojunction at room temperature. The obtained BiOI/Ag2CO3 composites were well characterized by XRD, FTIR, XPS, SEM, TEM, ESX, UV-vis DRS and PL. Various pollutants, such as rhodamine B (RhB), methylene blue (MB), methyl orange (MO) and phenol, were selected as model molecules to investigate the photocatalytic ability of the resultant BiOI/Ag2CO3 composite. Experimental results indicated that as-prepared BiOI/Ag2CO3 composite exhibited clearly enhanced photocatalytic activity for degrading various pollutants compared with pure Ag2CO3 and BiOI, which could be attributed to the heterojunction between BiOI and Ag2CO3. In addition, the BiOI/Ag2CO3 composite retained excellent photostability; the activity decreased slightly after five recycles. Moreover, the possible mechanism for the enhancement of the photocatalytic activity over the BiOI/Ag2CO3 composite is also proposed.
2. Experimental section
2.1 Synthesis of BiOI/Ag2CO3 photocatalysts
All the reagents were supplied from Sinopharm Chemical Reagent Co. Ltd, China. Deionized water was used throughout the study.The preparation of BiOI was as follows: 1.212 g of Bi(NO3)3·5H2O was added into 40 mL deionized H2O. After stirring for 1 h, 20 mL of H2O containing 0.415 g KI was dropped slowly into the above mixed solution. The resultant solution was vigorously stirred for 1 h at room temperature. Finally, the obtained products were collected by filtration, then washed with water and absolute alcohol thoroughly, and dried at 60 °C.
A series of BiOI/Ag2CO3 composites were produced through the co-precipitation method. In a typical experimental process, 0.340 g AgNO3 was dissolved in 30 mL of deionized H2O, then a certain amount of BiOI was added into the above solution. After stirring for 20 min, 10 mL of deionized water containing 0.106 g of Na2CO3 was dropped slowly into the suspension solution. After continuous stirring for 1 h, the suspension was filtered, washed with water and absolute alcohol, and dried at 35 °C. According to the mass ratio of BiOI in the BiOI/Ag2CO3 composite, the as-made samples were denoted as BiOI/Ag2CO3 (10 wt%), BiOI/Ag2CO3 (20 wt%) and BiOI/Ag2CO3 (50 wt%). The pure Ag2CO3 was synthesized in the same way without the addition of BiOI.
2.2 Characterizations
The X-ray diffraction (XRD) patterns were obtained on a Bruker D8 Advance X-ray powder diffractometer with Cu Kα radiation (40 kV, 30 mA) for phase identification. Fourier transform infrared spectra (FTIR) were recorded on Thermo Fisher Scientific IS10. The X-ray photoelectron spectroscopy (XPS) analysis was performed using the Thermo Fisher Scientific Escalab 250. The scanning electron microscopy (SEM) images were taken using a HITACHI SU8010 scanning electron microscope. The transmission electron microscope (TEM) was carried out via JEM-2100F with energy dispersive X-ray spectroscopy (EDX). The UV-vis diffuse reflectance spectra (DRS) were recorded using an Agilent Cary 5000 UV-vis spectrometer. The photoluminescence spectra (PL) were collected by PerkinElmer LS55 spectrometer with the excitation wavelength of 220 nm. Transient photocurrent response of the samples was detected using an electrochemical system (CHI760, China) with three-electrode quartz cells. The counter electrode was Pt wires, and a saturated calomel electrode was used as the reference electrode. The working electrode was the sample films (BiOI, Ag2CO3 and BiOI/Ag2CO3 (20 wt%) composite) coated on ITO glass. The light source was a 300 W Xe lamp with 400 nm filter to exclude the UV light, and 0.1 M Na2SO4 was used as the electrolyte.2.3 Photocatalytic testing for pollutant degradation
The photocatalytic activity of the as-made BiOI/Ag2CO3 composites was evaluated in degrading RhB, MB, MO and phenol under visible light. A 300 W Xe lamp with a 400 nm cutoff filter was applied as the visible-light source. 50 mg sample was dispersed into 50 mL of 5 mg L−1 pollutant and stirred in the dark for 1 h to reach the adsorption–desorption equilibrium. Then, 4 mL of solution was collected every given time interval under irradiation, and the catalyst was removed by centrifugation (12![[thin space (1/6-em)]](https://www.rsc.org/images/entities/char_2009.gif) 000 rpm, 5 min). The concentration of RhB, MB, and MO was detected via UV-vis spectrophotometer at the wavelength of 552, 664 and 464 nm. The concentration of phenol was detected through colorimetric method using 4-aminoantipyrine as the colour-developing agent at 510 nm.23
000 rpm, 5 min). The concentration of RhB, MB, and MO was detected via UV-vis spectrophotometer at the wavelength of 552, 664 and 464 nm. The concentration of phenol was detected through colorimetric method using 4-aminoantipyrine as the colour-developing agent at 510 nm.23
3. Results and discussion
3.1 The structure and property characterizations of BiOI/Ag2CO3 composite
Fig. 1 gives the XRD patterns of resultant BiOI, Ag2CO3 and BiOI/Ag2CO3 (20 wt%) composite. Sharp and high diffraction peaks were observed in all samples, indicating that all the resultant samples were well crystallized. For BiOI, the four main diffraction peaks appeared at 29.8°, 31.9°, 45.6° and 55.4°, which are good agreement with the (012), (110), (020) and (122) diffraction planes of the tetragonal phase of BiOI (JCPDS no. 10-0445).24 Ag2CO3 presented obvious diffraction peaks at 20.7°, 32.8°, 33.8°, 37.2° and 39.8°. These diffraction peaks could be indexed to the crystallite planes of (110), (−101), (−130), (200) and (031) of monoclinic Ag2CO3 (JCPDS no. 26-0339).25 Obviously, both BiOI and Ag2CO3 were found in the BiOI/Ag2CO3 (20 wt%) composite. No impurity peaks were observed, implying the high purity of the composite.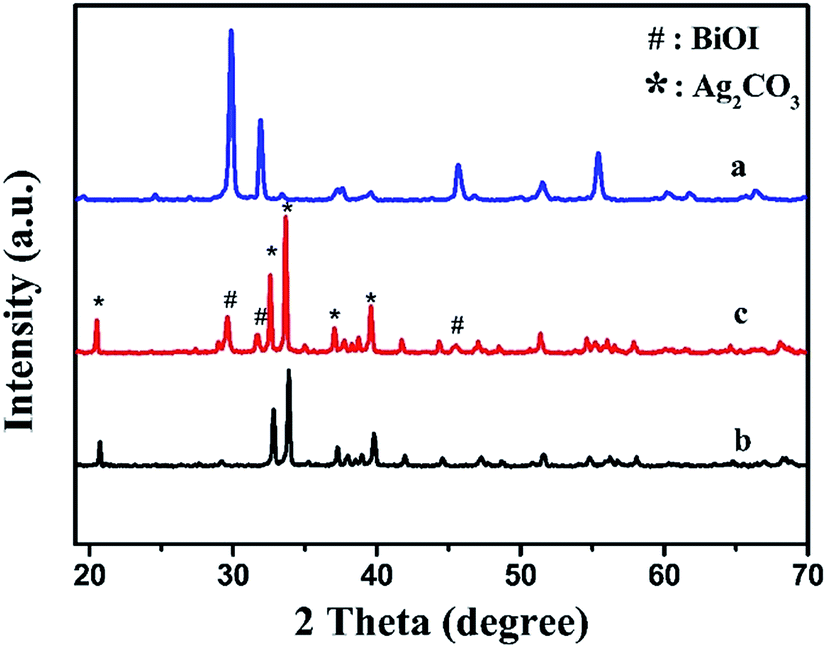 | ||
| Fig. 1 XRD patterns of various samples. (a) BiOI, (b) Ag2CO3 and (c) BiOI/Ag2CO3 (20 wt%) composite. | ||
The FTIR spectra of pure BiOI, Ag2CO3 and BiOI/Ag2CO3 (20 wt%) composite are shown in Fig. 2. Clearly, Ag2CO3 and BiOI/Ag2CO3 (20 wt%) composite presented similar stretching vibrations and bending vibrations. The peaks at 1449, 1382, 883 and 705 cm−1 were assigned to the characteristic peaks of carbonate ion.26 Compared with bare Ag2CO3, a new peak near 487 cm−1 could be observed in the BiOI/Ag2CO3 (20 wt%) composite. This peak was assigned to the absorption peak of Bi–O,24 which also further revealed that BiOI was successfully composed with Ag2CO3.
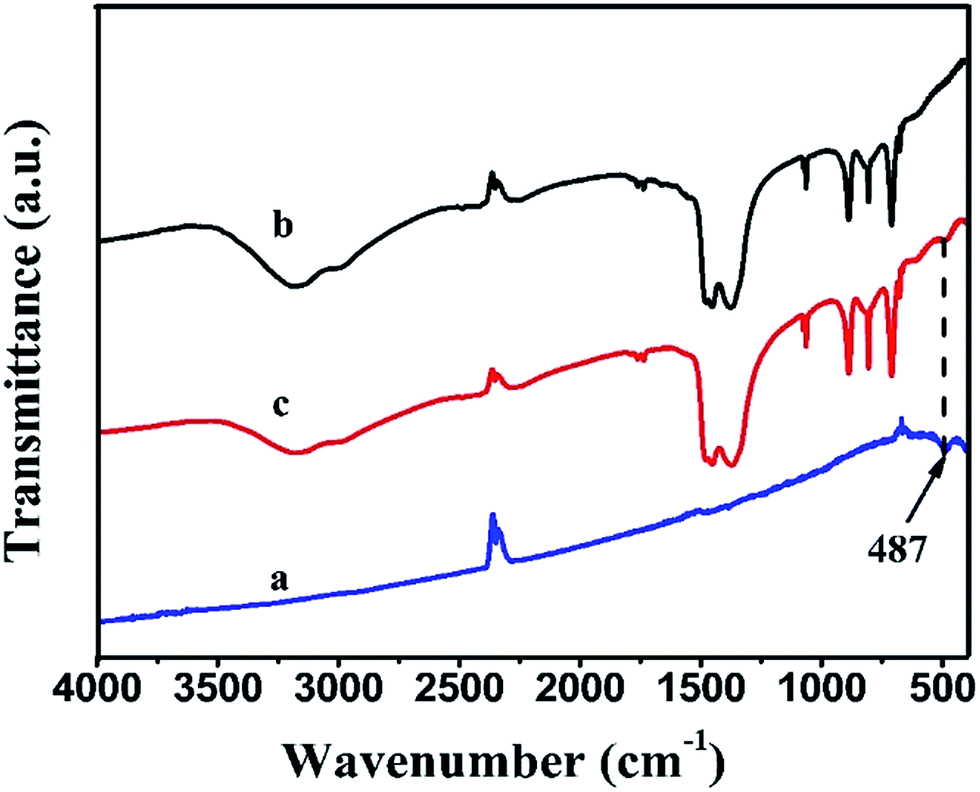 | ||
| Fig. 2 FTIR spectra of (a) BiOI, (b) Ag2CO3 and (c) BiOI/Ag2CO3 (20 wt%) composite. | ||
The elemental composition and state of BiOI/Ag2CO3 (20 wt%) composite were analyzed using XPS. In Fig. 3A, the survey spectra demonstrate that the composite contains Ag, C, O, Bi and I elements, proving that the sample is composed of Ag2CO3 and BiOI. Fig. 3B shows that the peaks of Ag 3d are observed at 367.8 and 373.8 eV, ascribed to Ag ions of Ag2CO3.27 C 1s peak was deconvoluted into three peaks at 284.6, 286.5 and 288.4 eV in Fig. 3C. The peak at 284.6 eV is attributed to the C–C and/or adventitious carbon; the peaks at 286.5 and 288.4 eV correspond to the carbonate ion in the sample.28 The wide XPS of O 1s peak (Fig. 3D) could be divided into three peaks; the peak at 530.7 eV corresponds to Bi–O,29 the peaks at 532.3 and 533.3 eV are respectively attributed to the crystal lattice oxygen of Ag2CO3 and surface absorbed oxygen species.30 The peaks at binding energies of 164.1 and 158.8 eV (Fig. 3E) belong to Bi 4f5/2 and Bi 4f7/2 of Bi3+ ions.31 For I 3d in Fig. 3F, the two peaks located at 619.4 eV and 630.8 eV are associated with I 3d5/2 and I 3d3/2, respectively.32
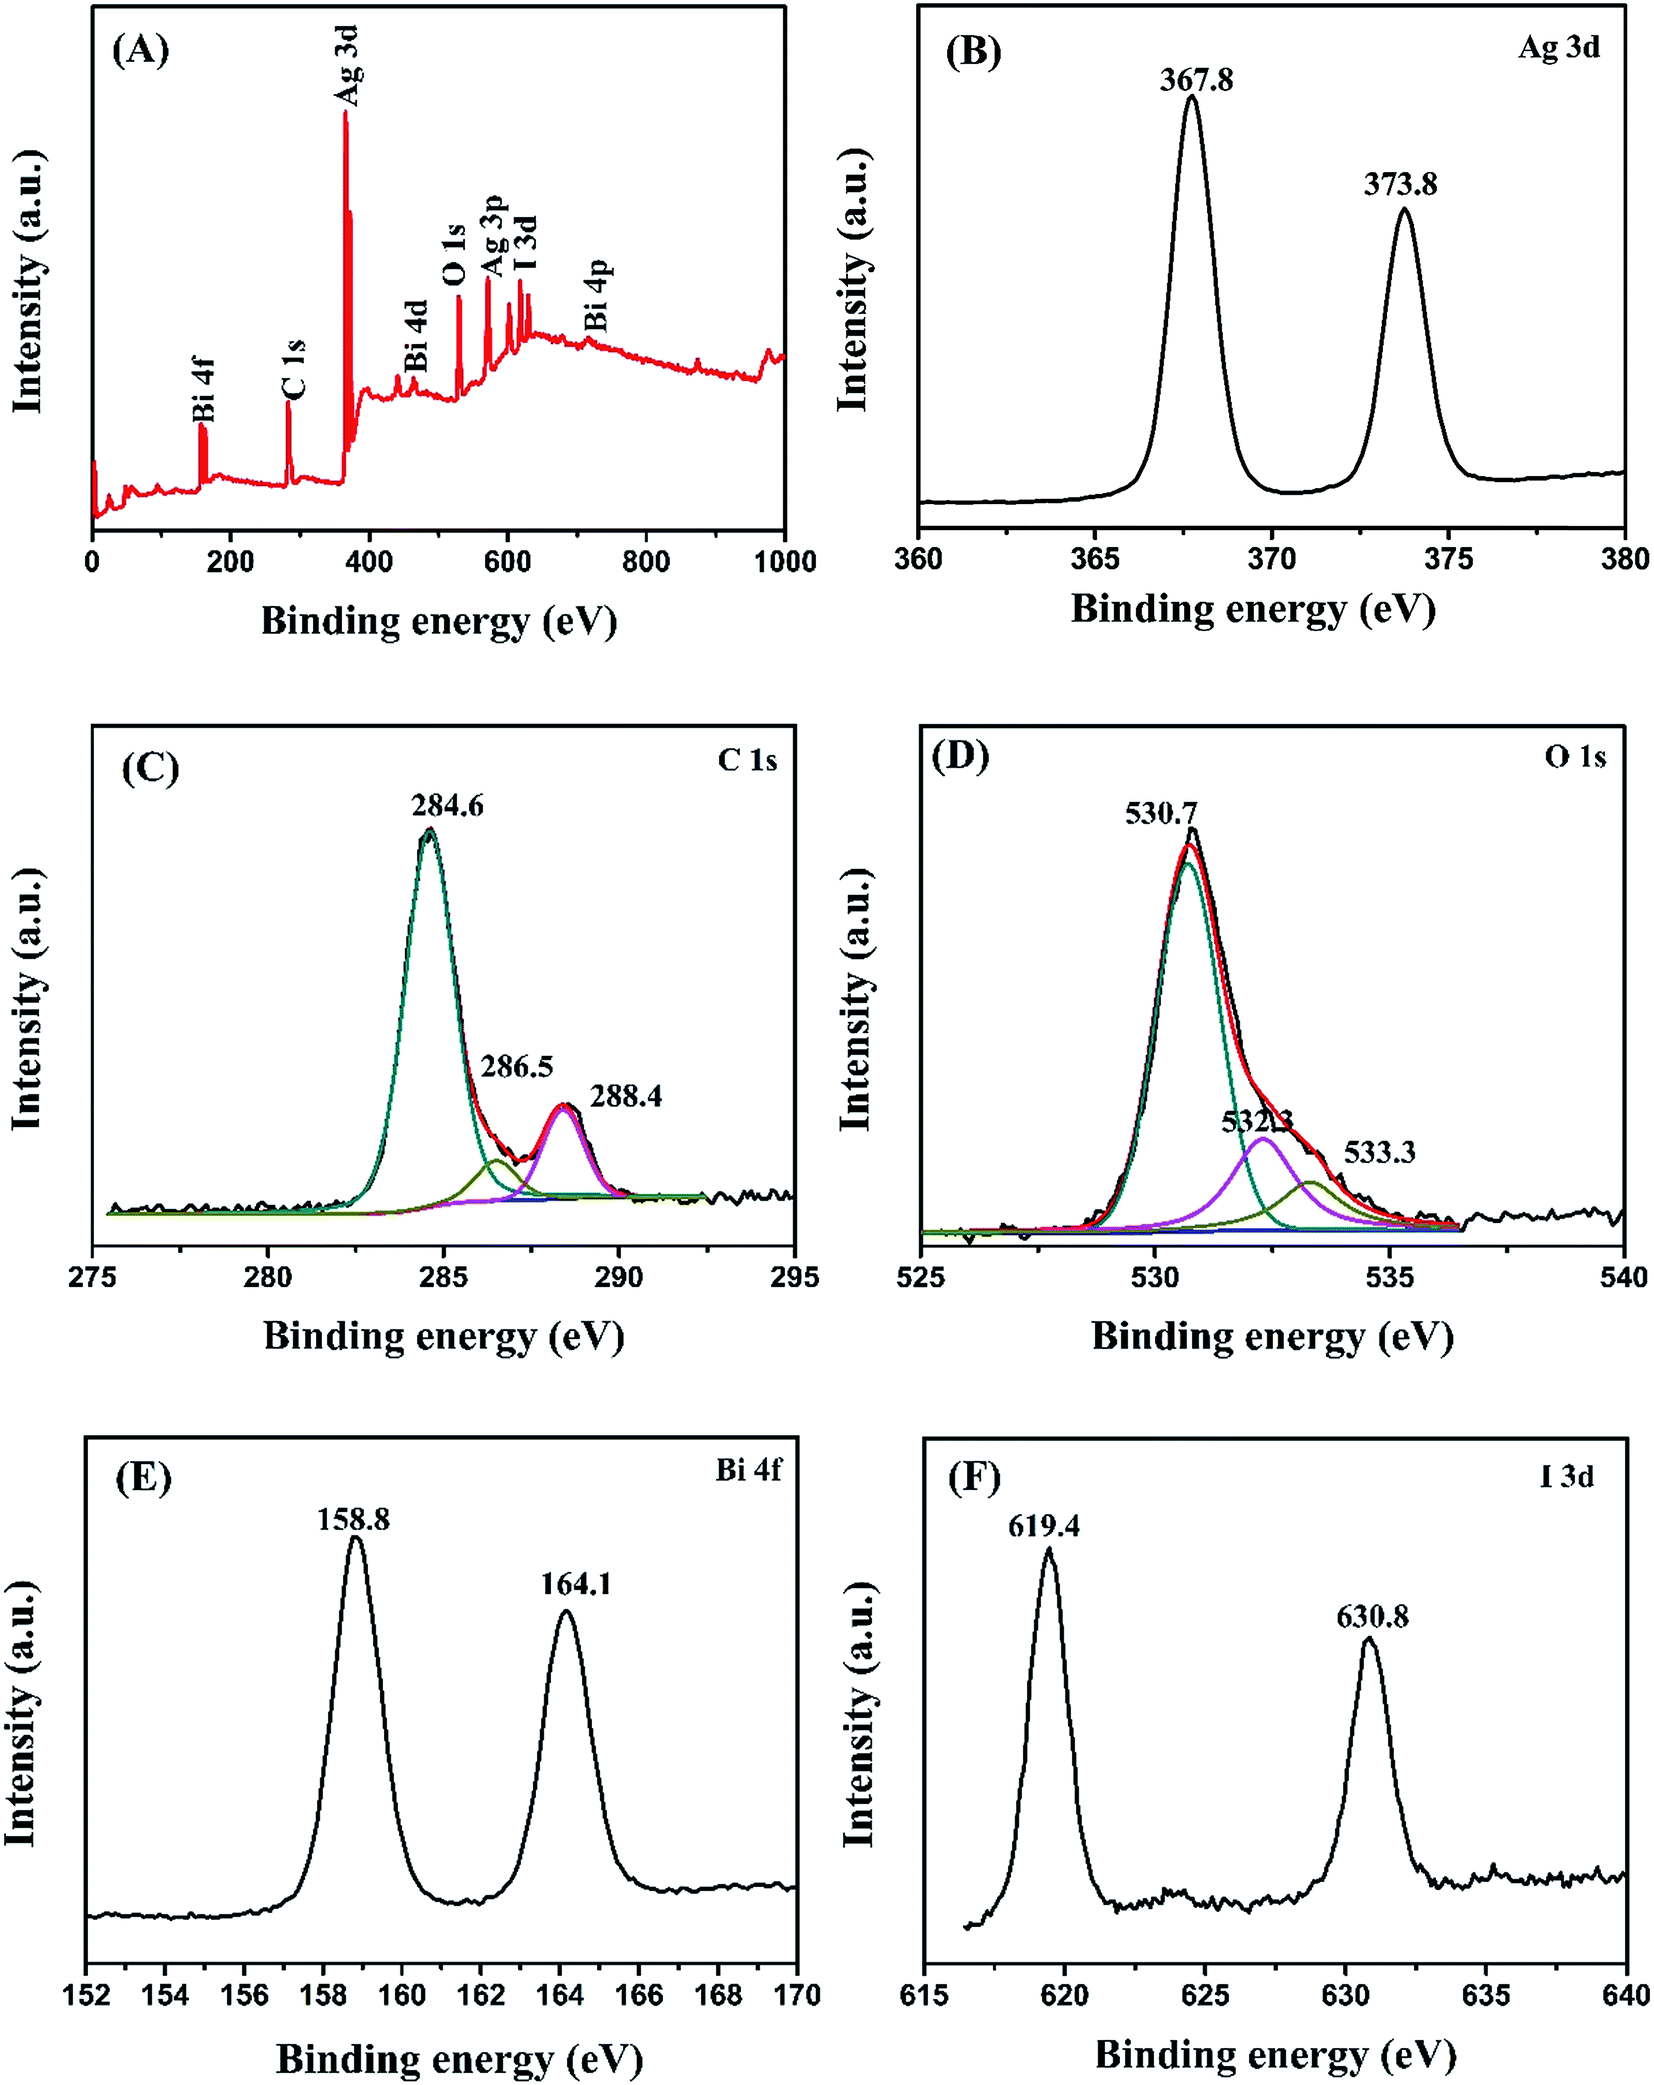 | ||
| Fig. 3 XPS of BiOI/Ag2CO3 (20 wt%) composite. (A) Survey spectra, (B) Ag 3d, (C) C 1s, (D) O 1s, (E) Bi 4f and (F) I 3d. | ||
For observation of the morphology of as-prepared samples, firstly, SEM images of pure Ag2CO3, BiOI and BiOI/Ag2CO3 (20 wt%) composite are provided in Fig. 4. A large number of Ag2CO3 particles with irregularity were observed (Fig. 4A), and the size of Ag2CO3 particles is between 0.2–1 μm. Pure BiOI is composed of abundant sheets with micron size (Fig. 4B). For as-prepared BiOI/Ag2CO3 (20 wt%) composite in Fig. 4C, Ag2CO3 nanoparticles with 20–200 nm are attached on the surface of BiOI (labeled by red circles). Further information about the microstructure of the resultant samples was supplied from the TEM and HRTEM images. Clearly, the obtained results were similar to the SEM results. Ag2CO3 still exhibited ruleless structure and was aggregated, and BiOI presented sheet structure with the size of 1–3 μm. From the TEM image of BiOI/Ag2CO3 (20 wt%) (Fig. 4F), Ag2CO3 nanoparticles adhered to the surface of the BiOI sheet, significantly decreasing the size of Ag2CO3 compared with pure Ag2CO3. HRTEM image (Fig. 4G) shows that the Ag2CO3 nanoparticles tightly loaded on the BiOI sheet surface. The lattice fringe spacings of 0.280 and 0.199 nm respectively corresponded to the (110) and (020) planes of tetragonal BiOI, and those at 0.264 and 0.226 nm are due to the (−130) and (031) planes of the monoclinic Ag2CO3, respectively. Obviously, this result indicates that the heterojunctions between Ag2CO3 and BiOI have formed, and that there was a clear interface contact between Ag2CO3 and BiOI, which might contribute to facilitating the photogenerated electron transfer between Ag2CO3 and BiOI, thus leading to the improved photocatalytic property. Moreover, the EDX spectrum of the BiOI/Ag2CO3 (20 wt%) composite is also shown in Fig. 4H. The composite contains only C, O, Bi, Ag and I elements, except for element of Cu from the supports. The above results agree well with the XRD, FTIR and XPS results.
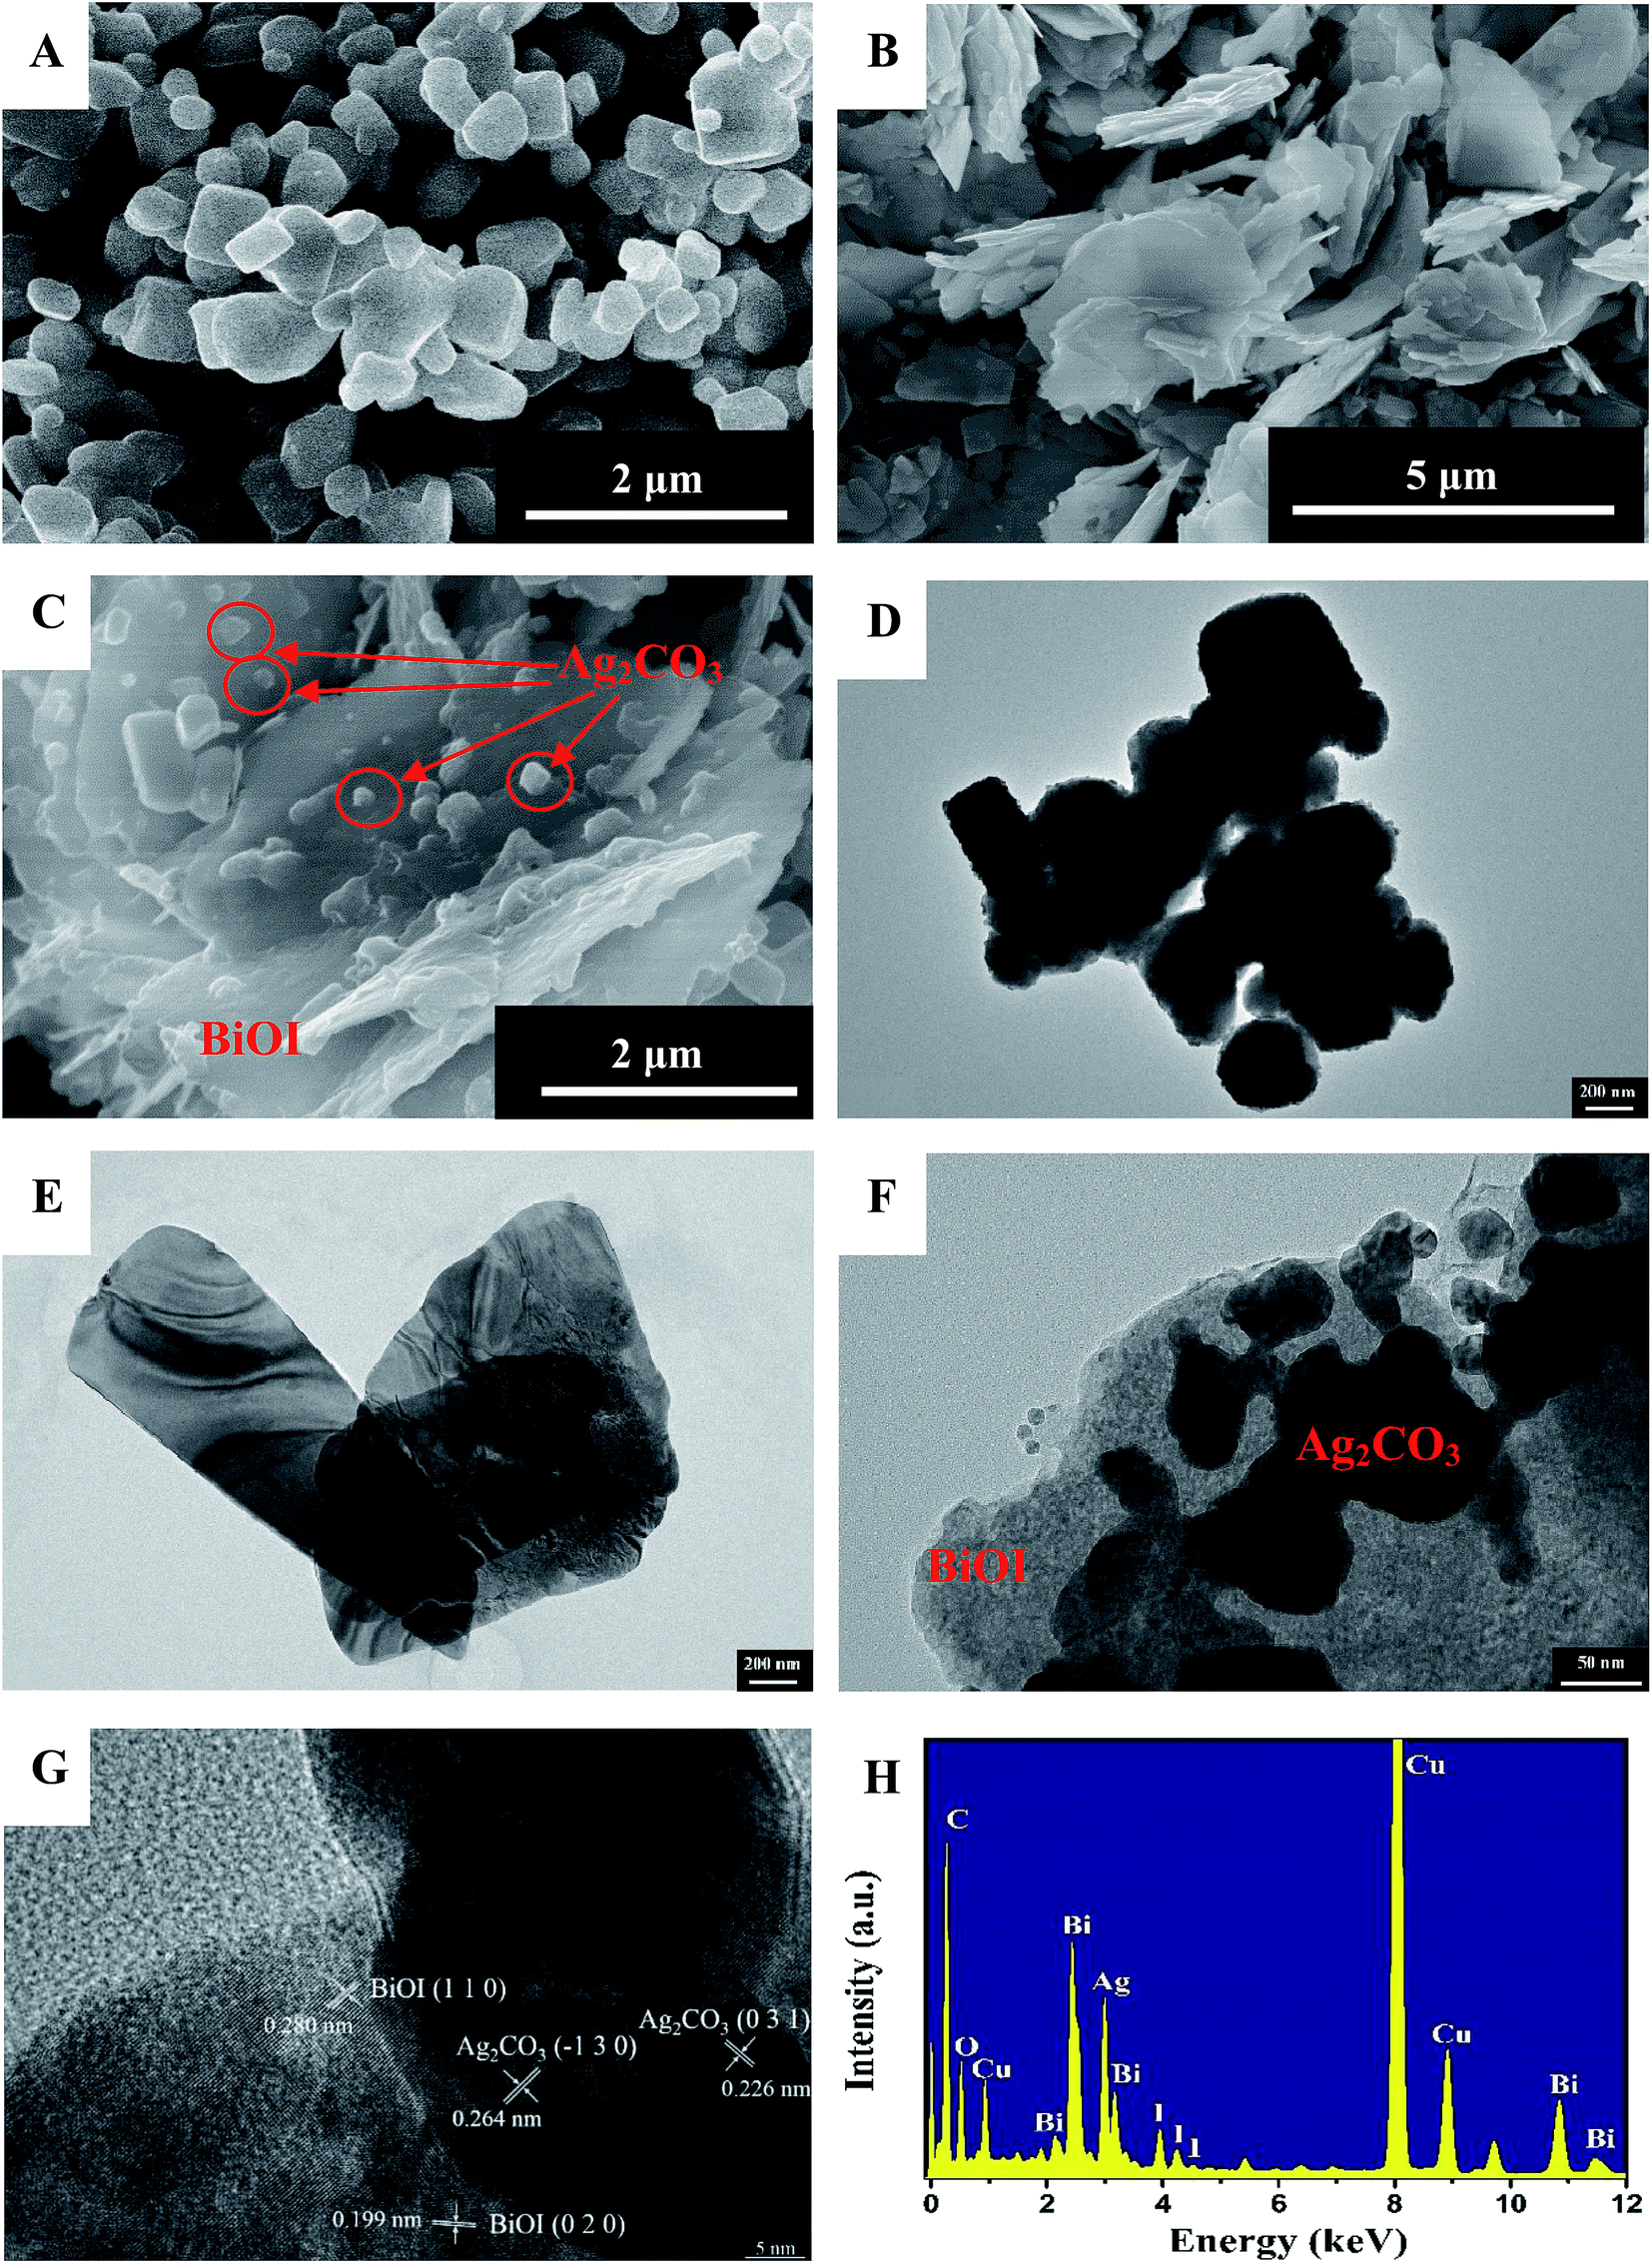 | ||
| Fig. 4 The SEM images of (A) pure Ag2CO3, (B) BiOI and (C) BiOI/Ag2CO3 (20 wt%) composite; the TEM images of (D) pure Ag2CO3, (E) BiOI, (F) BiOI/Ag2CO3 (20 wt%) composite; (G) the HRTEM image and (H) EDX spectrum of BiOI/Ag2CO3 (20 wt%) composite. | ||
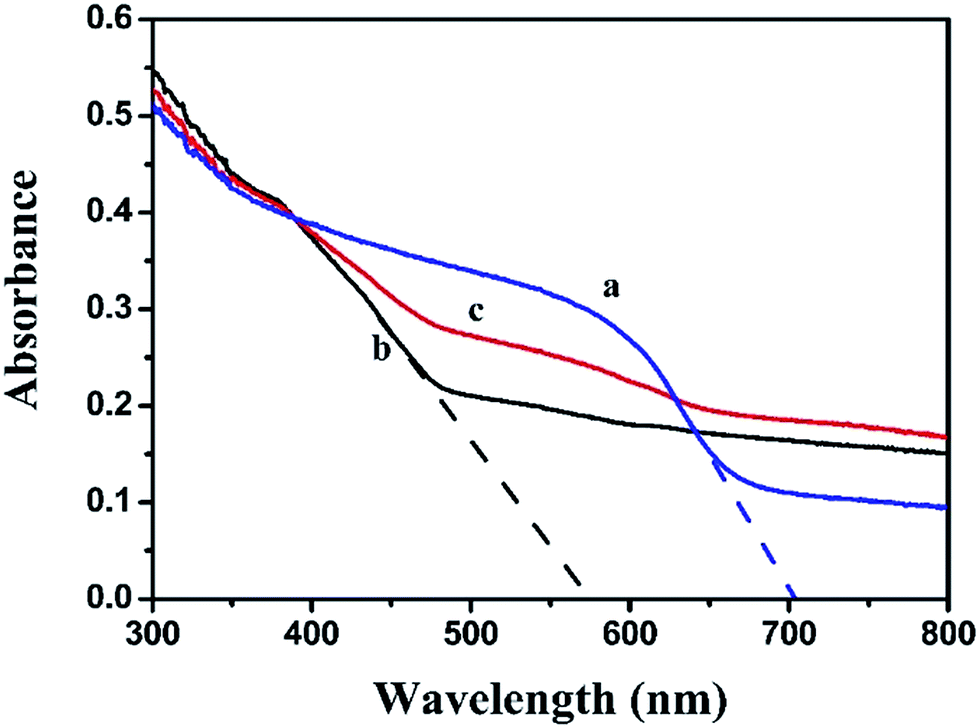
The light harvest was investigated by UV-vis DRS (Fig. 5). Obviously, the absorption band edge of Ag2CO3 was estimated to be 574 nm, suggesting that Ag2CO3 exhibited good photo-absorption from UV region to visible light. The absorption band edge of BiOI was around 703 nm, presenting that BiOI had strong and broad absorption in the visible light region. After BiOI was combined with Ag2CO3, the BiOI/Ag2CO3 (20 wt%) composite showed enhanced photoharvest compared with pure Ag2CO3. Furthermore, the band gap energy of as-prepared samples could be calculated through the equation Eg = 1240/λ (where λ is the absorption edge and Eg is the corresponding band gap). Correspondingly, the band gaps of BiOI and Ag2CO3 were estimated to about 1.76 eV and 2.16 eV.
 | ||
| Fig. 5 UV-vis diffuse reflectance spectra of (a) BiOI, (b) Ag2CO3 and (c) BiOI/Ag2CO3 (20 wt%) composite. | ||
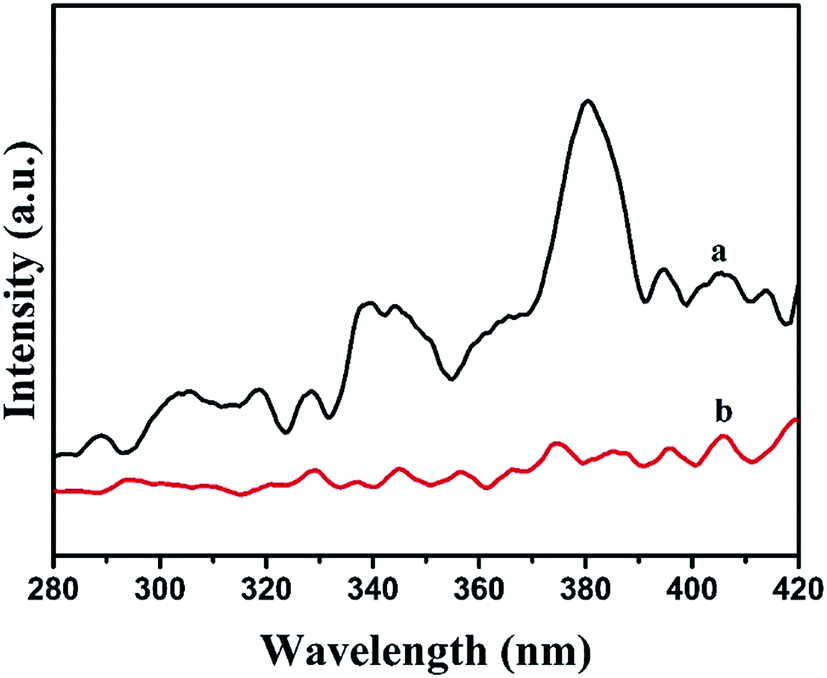
Photoluminescence spectra emission originates from the recombination of photogenerated electron–hole pairs; thus, PL might reveal the transfer and recombination processes of the photoinduced charge carrier.33 Generally, a lower PL intensity denotes a higher separation probability of photogenerated charge carrier.34,35 Fig. 6 displays the PL spectra of BiOI and BiOI/Ag2CO3 (20 wt%) with the excitation wavelength of 220 nm. Pure BiOI exhibited higher emission intensity than BiOI/Ag2CO3 (20 wt%) composite, indicating that the coordination of BiOI and Ag2CO3 could promote the separation of photogenerated electrons and holes, and it is anticipated to contribute to the improved photocatalytic activity.
 | ||
| Fig. 6 Photoluminescence spectra of (a) BiOI and (b) BiOI/Ag2CO3 (20 wt%). | ||
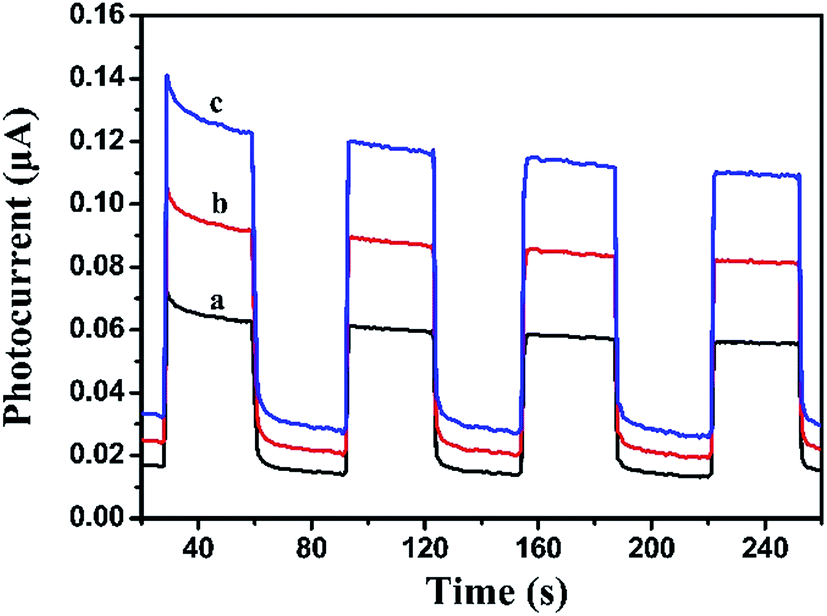
Photocurrent measurement is an efficient way to evaluate the separation efficiency of photocharges. Generally, higher photocurrent intensity means better separation efficiency of photocharges. As shown in Fig. 7, visible light irradiation could induce the BiOI, Ag2CO3 and BiOI/Ag2CO3 (20 wt%) composite to generate photocurrent signals. BiOI/Ag2CO3 (20 wt%) composite possessed stronger photocurrent intensity than pure BiOI and Ag2CO3, suggesting that the former exhibited better separation efficiency for photogenerated electron–hole pairs, which was consistent with photoluminescence measurement results.
 | ||
| Fig. 7 Transient photocurrent property of (a) BiOI, (b) Ag2CO3 and (c) BiOI/Ag2CO3 (20 wt%) composite. | ||
3.2 Photocatalytic activity and stability
The photocatalytic activity of pure BiOI, Ag2CO3 and BiOI/Ag2CO3 composite for the degradation of RhB solution was measured under visible light. Fig. 8A exhibits the concentration changes of RhB. When bare BiOI and Ag2CO3 were used as photocatalysts, about 44% and 60% of RhB decomposed in 12 min, respectively. The BiOI/Ag2CO3 composites exhibited much higher photocatalytic activity under the same conditions; comparatively, BiOI/Ag2CO3 (10 wt%) and BiOI/Ag2CO3 (50 wt%) respectively possessed 95% and 97% degradation efficiency for RhB. The BiOI/Ag2CO3 (20 wt%) composite presented the optimal photocatalytic activity, and almost 100% RhB was degraded within 12 min under visible-light irradiation. The significantly enhanced photocatalytic activity might be attributed to the following facts. Firstly, the induced BiOI played the role of photo-absorber to enlarge the photoharvest of BiOI/Ag2CO3 composites, leading to the enhanced photocatalytic degradation. Secondly, the heterojunction formed between BiOI and Ag2CO3 contributed to the electron transfer, promoting the separation of the photogenerated electrons and holes.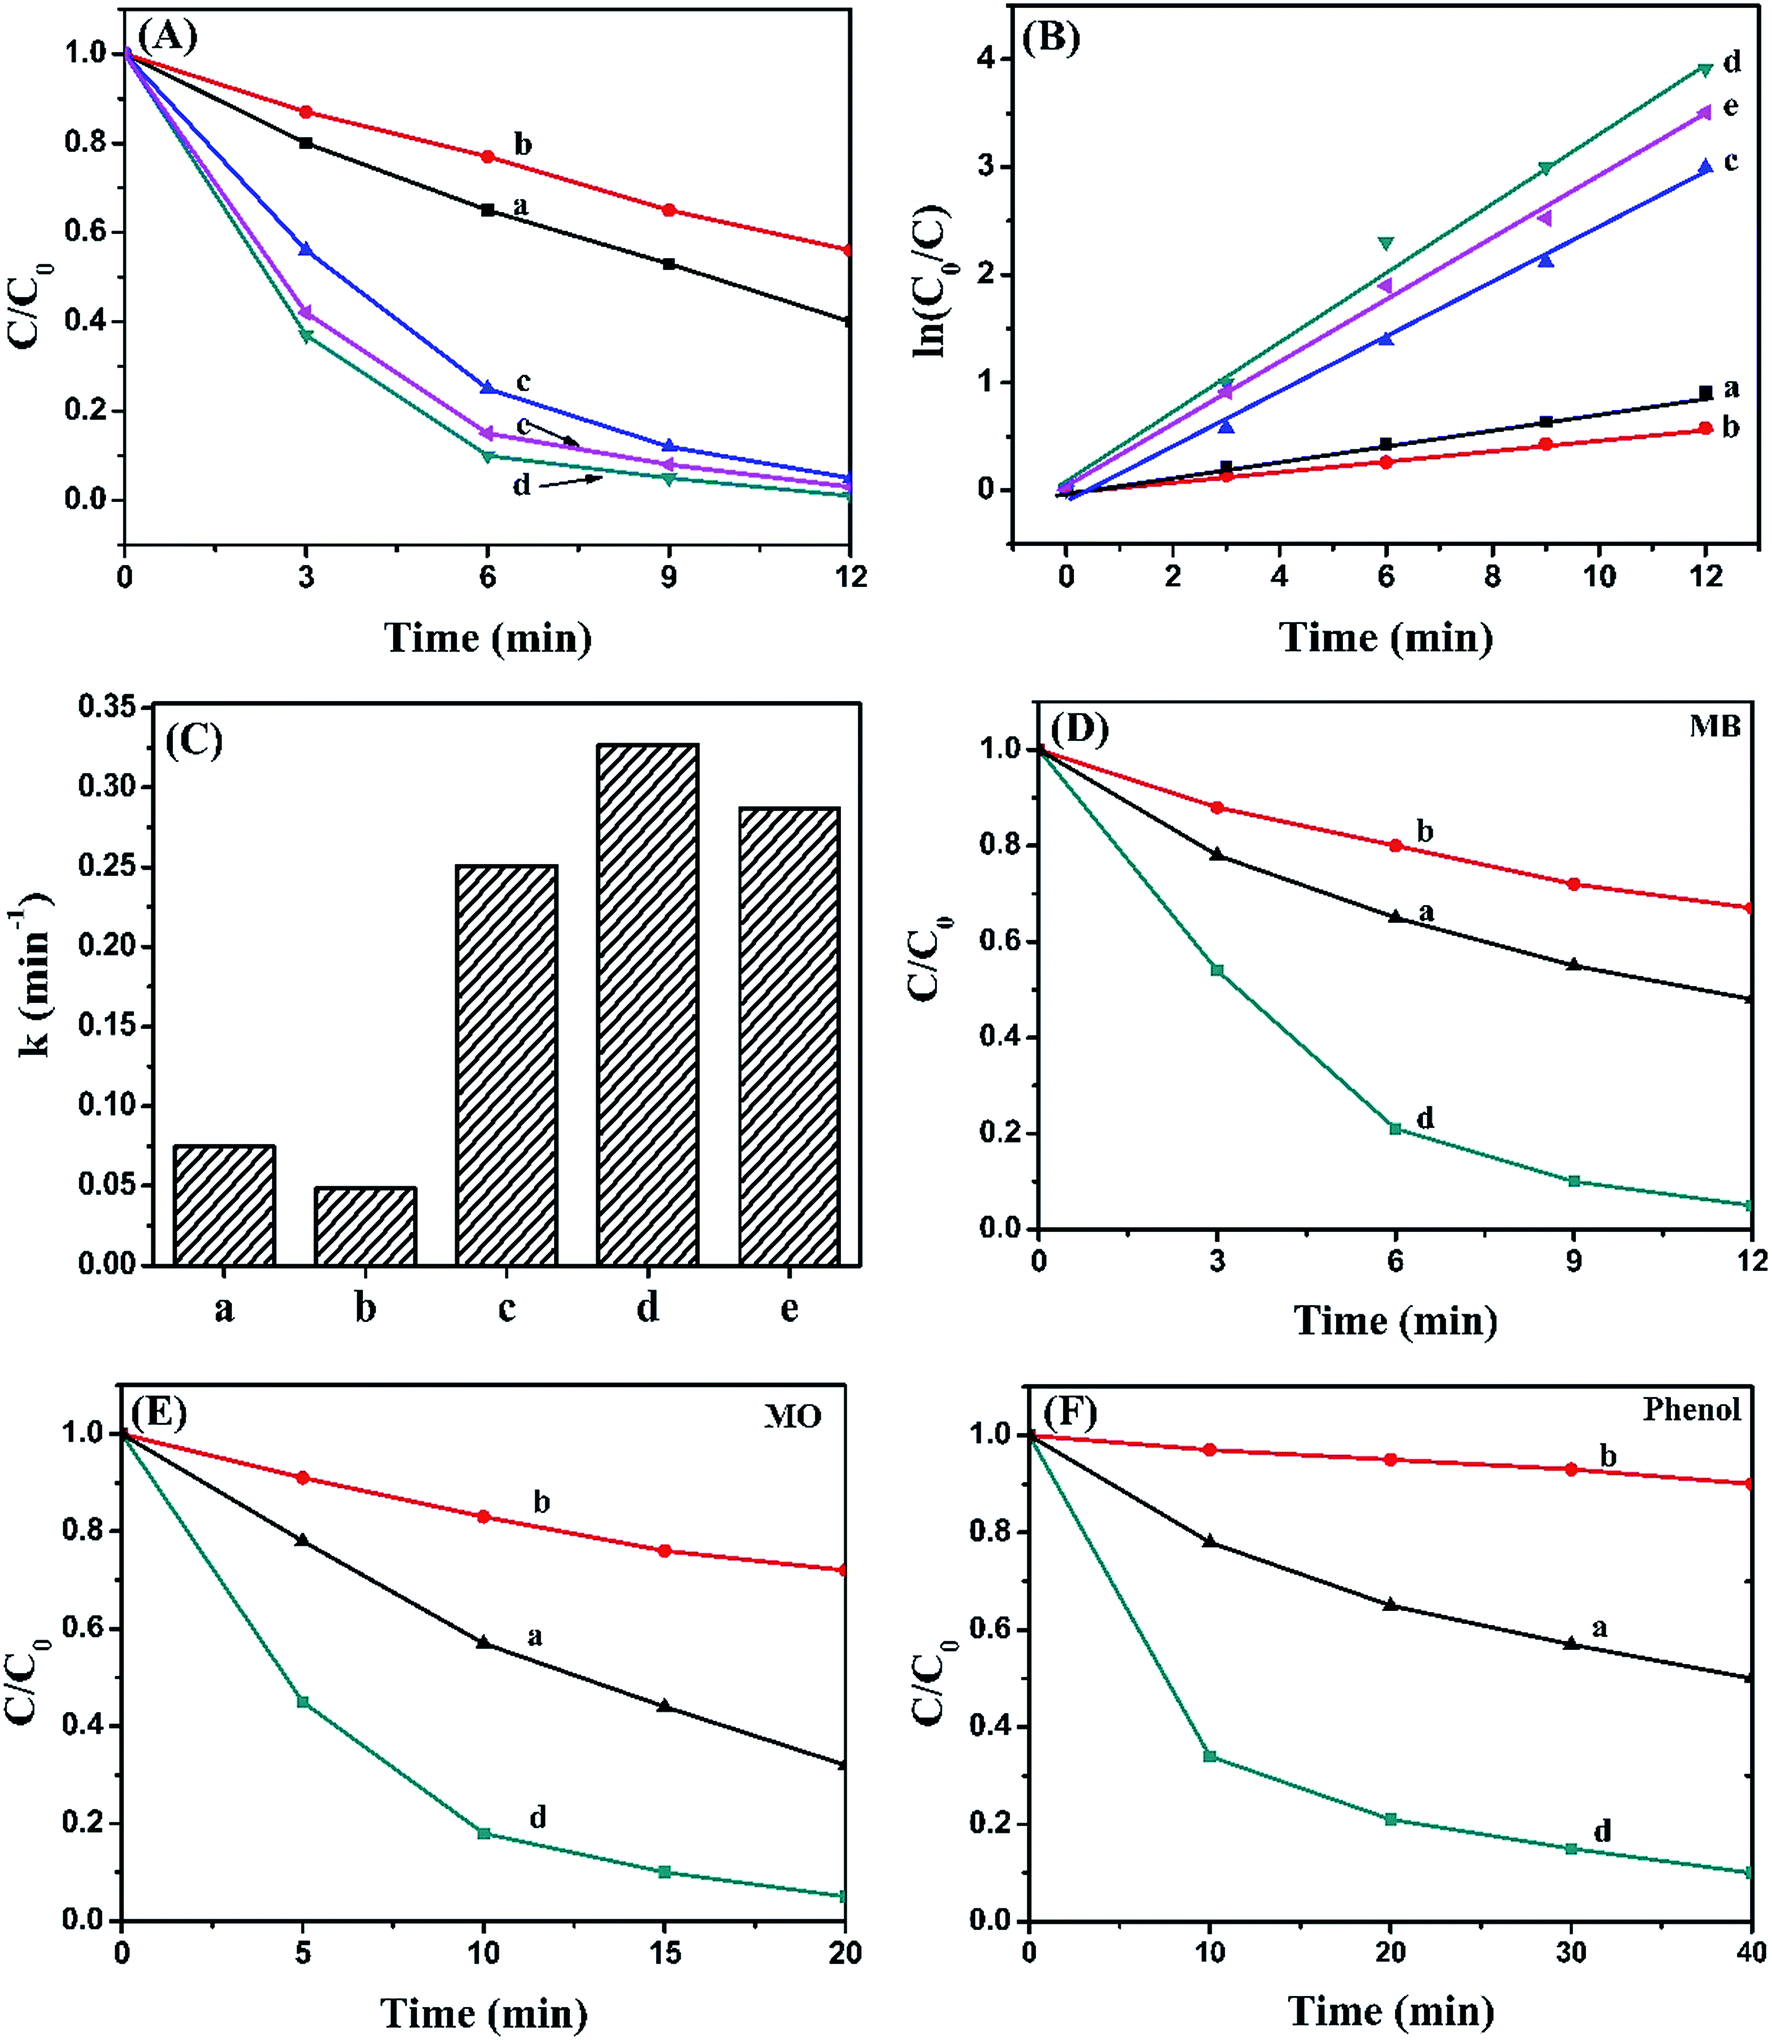 | ||
| Fig. 8 (A) The photodegradation curves of RhB; (B) first-order kinetic plots for the photodegradation of RhB and (C) the corresponding rate constants; (D) the photodegradation curves of MB; (E) the photodegradation curves of MO and (F) phenol. (a) Ag2CO3, (b) BiOI, (c) BiOI/Ag2CO3 (10 wt%), (d) BiOI/Ag2CO3 (20 wt%) and (e) BiOI/Ag2CO3 (50 wt%). | ||
Correspondingly, the RhB degradation rate constant was investigated in Fig. 8B. In general, the photocatalytic degradation of RhB fits well with a pseudo-first-order reaction within the low-concentration region, and its kinetics could be calculated as follows:
| ln(C0/C) = kt | (1) |
To determine the universality of the BiOI/Ag2CO3 catalyst for photodegrading other pollutants, the photocatalytic degradation of MB, MO and phenol solution over pure BiOI, Ag2CO3 and BiOI/Ag2CO3 (20 wt%) composite were also detected. As shown in Fig. 7D–F, BiOI/Ag2CO3 (20 wt%) composite still showed remarkably improved photocatalytic activity compared with separate BiOI and Ag2CO3. The degradation conversation of MB was 95.5% within 12 min; 96% of MO was converted within 20 min; and for phenol, 90.1% was degraded after 40 min irradiation, exhibiting the composite's universal application for photodegrading cationic and anionic dyes together with phenol pollutant.
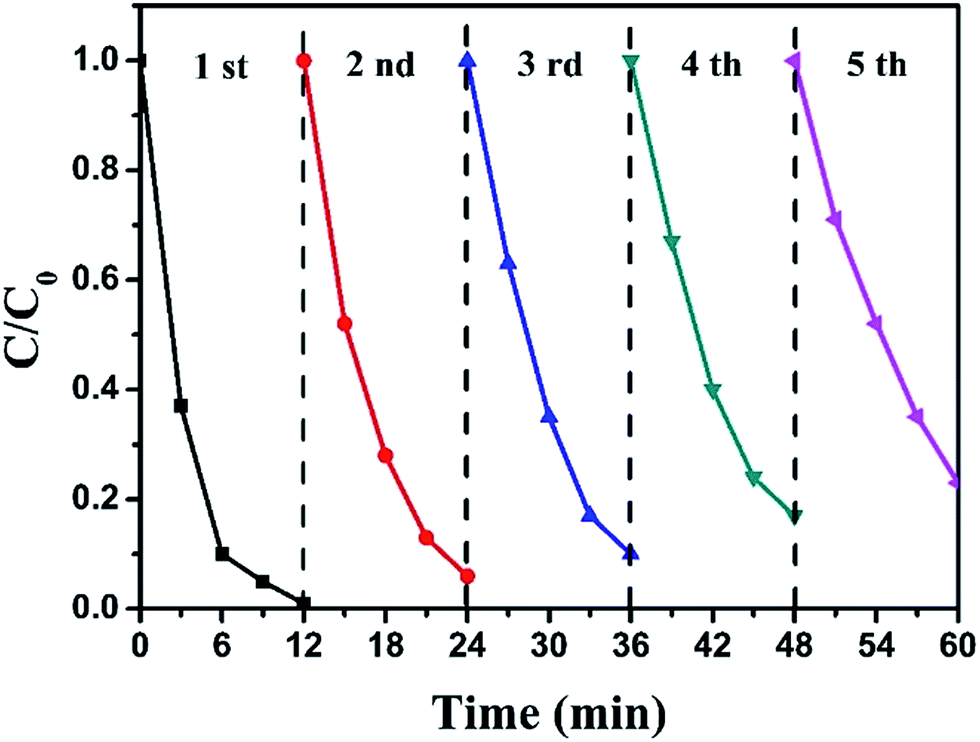
The stability of a catalyst is also a significant factor for its practical application. Hence, recycling experiments for the photocatalytic degradation of RhB over BiOI/Ag2CO3 (20 wt%) composite were performed, and results are presented in Fig. 9. After 5 recycles, the used BiOI/Ag2CO3 composite maintained 80% of the original activity over the fresh catalyst, revealing the excellent stability of BiOI/Ag2CO3 catalyst.
 | ||
| Fig. 9 Recycling experiments for photodegrading RhB over BiOI/Ag2CO3 (20 wt%) composite. | ||
In addition, the leachability test was also performed. 50 mg catalyst was added into the 50 mL distilled water, and after stirring for 2 h, the catalyst was removed by centrifugation. A certain amount of RhB was added in the filtrate to obtain 5 mg L−1 RhB solution, which was irradiated by 300 W Xe lamp, and 4 mL of the solution was collected every given time interval and detected via UV-vis spectrophotometer. The result is shown in Fig. S1.† Clearly, RhB was hardly degraded. This result indicated that BiOI/Ag2CO3 composites were not leached.
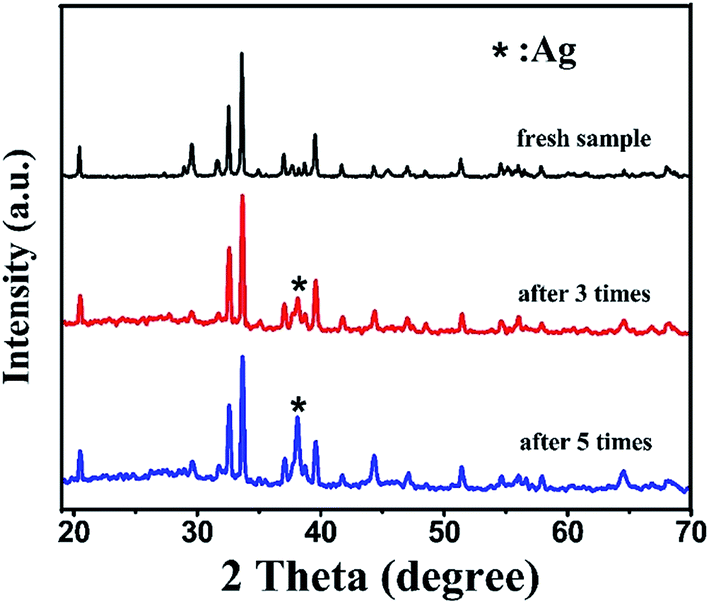
Correspondingly, Fig. 10 provides the XRD patterns of BiOI/Ag2CO3 (20 wt%) composite before and after degradation of RhB. After three catalytic runs, the Ag0 peak intensity at 38.1° appeared and intensified with the recycle runs. However, the other peaks did not change compared with the fresh catalyst. The existence of metal Ag in the spent BiOI/Ag2CO3 composite suggested that Ag2CO3 gradually changed into Ag0 during the photodegradation process. The change in chemical state of Ag species was possibly caused due to the combination of photogenerated electrons with Ag+, which made the amounts of Ag gradually increase in photocatalytic reactions.
 | ||
| Fig. 10 The XRD patterns of BiOI/Ag2CO3 (20 wt%) composite before and after reuse for photodegrading RhB. | ||
3.3 Photocatalytic mechanism detection
As we know, some active species, such as holes (h+), electrons (e−), superoxide radicals (˙O2−) and hydroxyl radicals (˙OH), are generated under light irradiation in the photodegradation process. Therefore, in order to measure the dominating reactive species during photodegradation of RhB over BiOI/Ag2CO3 composite and investigate the mechanism of the photocatalytic reaction, reactive species trapping experiments were performed. Ethylene diamine tetraacetic acid (EDTA), tert-butyl alcohol (t-BuOH) and p-benzoquinone (p-BQ) were used to quench h+, ˙OH and ˙O2−, respectively.36–41 As shown in Fig. 11, the introduction of p-BQ and EDTA caused significant reduction of activity, implying that both ˙O2− and h+ were the main active species. However, only a slight suppression of activity was found with t-BuOH adding, indicating that ˙OH radical gave a relatively small contribution to the photocatalytic reaction.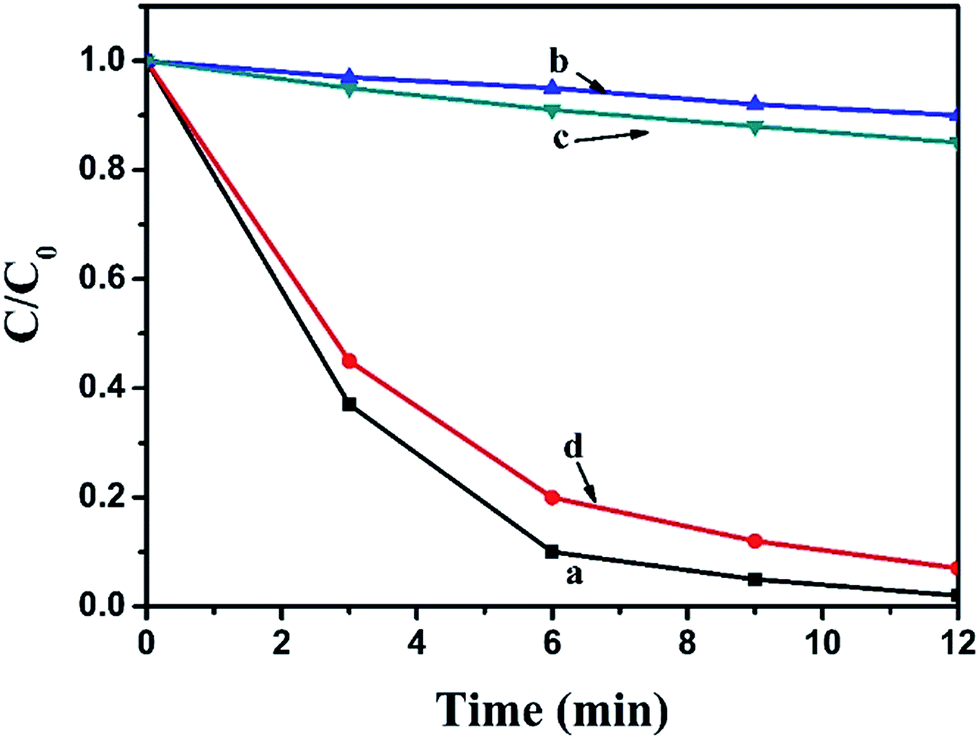 | ||
| Fig. 11 Effects of the addition of different scavengers on the degradation of RhB over BiOI/Ag2CO3 (20 wt%) composite: (a) no scavenger, (b) adding 1 mM EDTA, (c) adding 1 mM p-BQ and (d) adding 5 mM t-BuOH. | ||
In addition, the valence band (VB) and conduction band (CB) potentials of BiOI and Ag2CO3 were calculated based on the following empirical equations.42,43
| EVB = X − Ee + 0.5Eg | (2) |
| ECB = EVB − Eg | (3) |
Thus, a possible mechanism for the enhanced photocatalytic activity of BiOI/Ag2CO3 composite is proposed. Apparently, the matched band edges of BiOI (EVB = 2.32 eV, ECB = 0.56 eV) and Ag2CO3 (EVB = 2.6 eV, ECB = 0.44 eV) could not be constructed so that it was difficult promote the separation of the photoinduced carriers. Moreover, the experiments of active species indicated that ˙O2− radical played the main role in the process of degrading pollutants, but the standard redox potential of O2/˙O2− (+0.13 eV vs. SHE)46 was more positive than that of BiOI or Ag2CO3; theoretically, the electrons on the CB of BiOI or Ag2CO3 could not reduce O2 to ˙O2−. However, under visible light irradiation with energy less than 3.10 eV (λ > 400 nm) in the BiOI/Ag2CO3 system, similar to the previous reports,47–50 the VB edge of BiOI and Ag2CO3 could be boosted to a higher potential edge, respectively reaching −0.78 and −0.50 eV. Therefore, the reformed and complementary band edges for the BiOI/Ag2CO3 composite are illustrated in Fig. 12. Under visible-light irradiation, both BiOI and Ag2CO3 were excited to generate electrons (e−) and holes (h+). The e− on the CB of BiOI could inject into the CB of Ag2CO3, and Ag2CO3 is partly reduced to form Ag nanoparticles by e−; then, a part of e− could easily be captured by metal Ag through the Schottky battier. Finally, e− on the reformed CB potential could reduce the adsorbed O2 to yield ˙O2− radical, which combined with H2O to further transform to the active ˙OH species.51 This result might explain why the ˙O2− radical was the main active species. The photogenerated h+ on the VB of Ag2CO3 could transfer to the VB of BiOI and become directly involved in the degradation of pollutants because the VB levels of BiOI and Ag2CO3 are less positive than the standard redox potential of ˙OH/H2O (2.68 eV vs. SHE).52 This might explain the reason that ˙OH radical exhibited small effect on the photodegradation of RhB. Finally, the obtained main active species h+ and ˙O2− reacted with the pollutants to generate the degradation products. As a result, in the photocatalytic process, the recombination rates of the photoinduced electron–hole pairs were restricted to reach efficient charge separation, which subsequently promoted the photocatalytic efficiency.
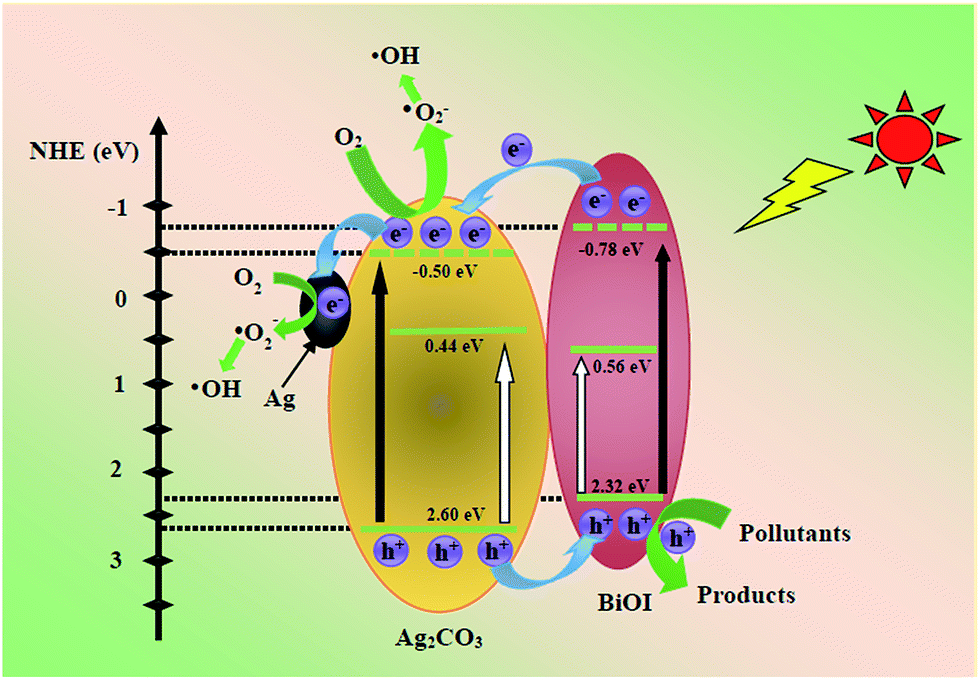 | ||
| Fig. 12 Proposed degradation mechanism of pollutants over the BiOI/Ag2CO3 composite. | ||
According to the previous literature,53–55 the intermediate and final products of RhB degradation are shown in Fig. 13. The photodegradation of RhB has four main processes, including N-deethylation, chromophore cleavage, opening-ring and mineralization. During the photodegradation process, various active intermediate species, such as ˙O2−, ˙OH, h+ and e−, are generated, which are involved in destroying RhB structure. Their oxidation or reduction activities make RhB N-deethylated, destroying the conjugated structure. With prolonged light irradiation time, the effects of active intermediate species are improved, leading to further ring-opening and mineralization of less organic matter.
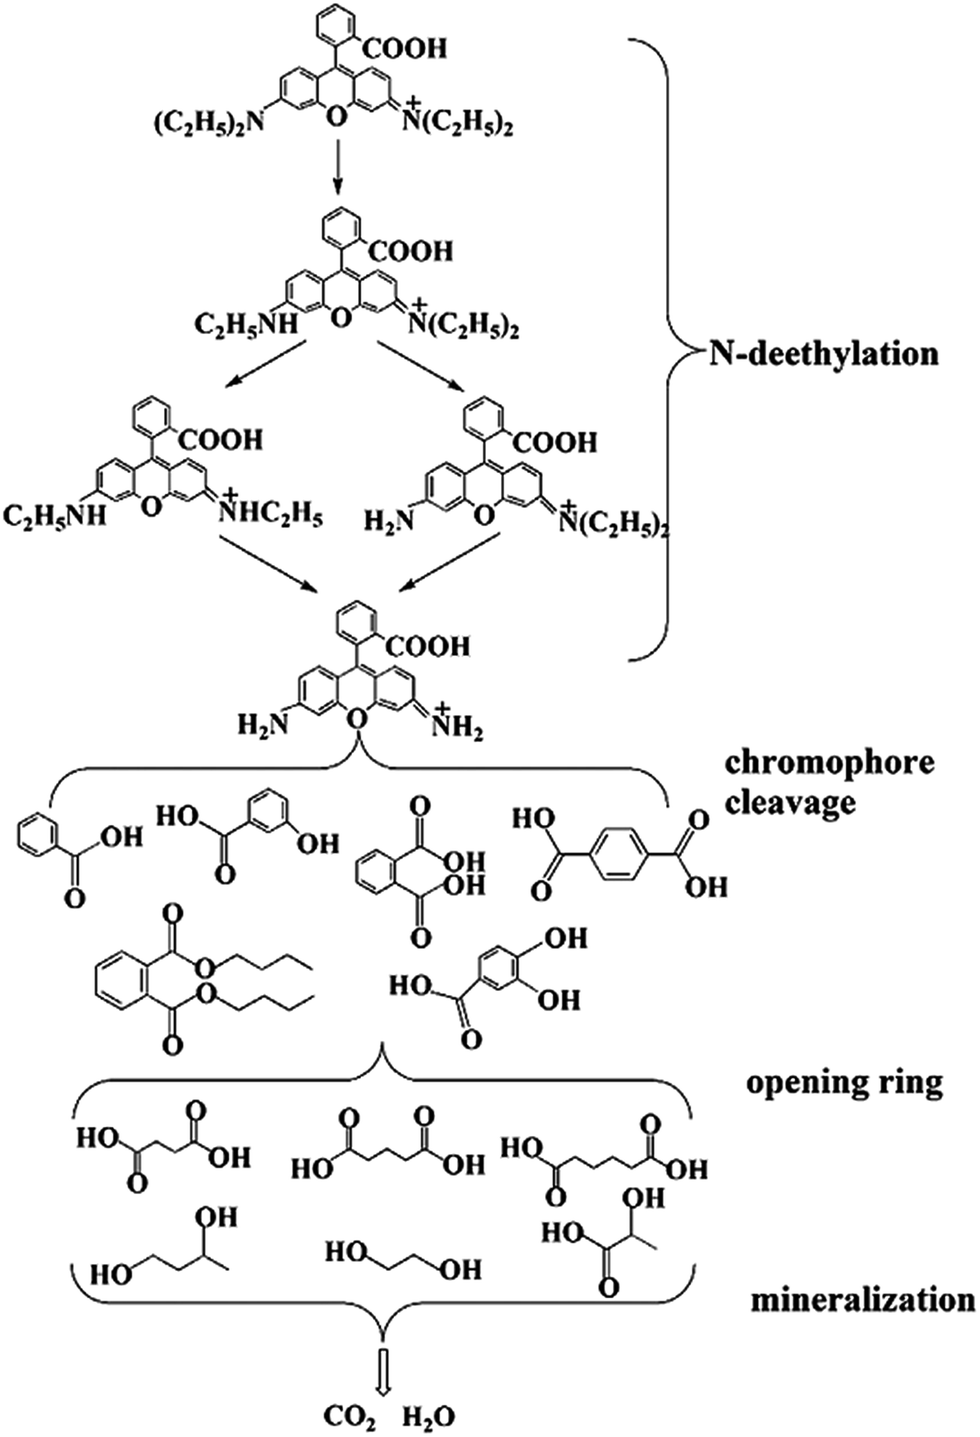 | ||
| Fig. 13 The possible degradation intermediate and the final products of RhB over BiOI/Ag2CO3 composites. | ||
4. Conclusion
In summary, the novel BiOI/Ag2CO3 catalyst has been successfully fabricated and applied to photocatalytic degradation of various pollutants. The addition of BiOI significantly enhanced the photocatalytic activity of Ag2CO3, and the BiOI/Ag2CO3 (20 wt%) composite exhibited the highest catalytic activity. Moreover, BiOI/Ag2CO3 composite reduced the serious photocorrosion of Ag2CO3 and showed excellent catalytic recycling stability. The enhanced photocatalytic activity is not only attributed to the narrow bandgap of BiOI and the extended optical response, but also to the enhanced photogenerated carrier separation on the heterogeneous interface between Ag2CO3 and BiOI. The developed heterojunction system of BiOI/Ag2CO3 composite could be extended to other silver-containing heterostructured photocatalysts with highly efficient catalytic performance for pollutant abatement.Conflicts of interest
There are no conflicts of interest to declare.Acknowledgements
We sincerely acknowledge the financial support from National Natural Science Foundation of China (21673060), Fund for Research and Development of Science and Technology in Shenzhen (No. JCYJ20160427184531017), and State Key Lab of Urban Water Resource and Environment of Harbin Institute of Technology (HIT2017DX10), talent scientific research fund of LSHU (No. 2016XJJ-080) and basic research projects of Liaoning Provincial Education Department (L2017LQN004).References
- K. Rajeshwar, N. R. d. Tacconi and C. R. Chenthamarakshan, Chem. Mater., 2001, 13, 2765–2782 CrossRef CAS.
- X. Chen and S. S. Mao, Chem. Rev., 2007, 107, 2891–2959 CrossRef CAS PubMed.
- X. Wang, S. Li, H. Yu, J. Yu and S. Liu, Chem.–Eur. J., 2011, 17, 7777–7780 CrossRef CAS PubMed.
- Y. P. Bi, S. X. Ouyang, N. Umezawa, J. Y. Cao and J. H. Ye, J. Am. Chem. Soc., 2011, 133, 6490–6492 CrossRef CAS PubMed.
- G. Chen, M. Sun, Q. Wei, Y. Zhang, B. Zhu and B. Du, J. Hazard. Mater., 2013, 244–245, 86–93 CrossRef CAS PubMed.
- A. A. Kulkarni and B. M. Bhanage, ACS Sustainable Chem. Eng., 2014, 2, 1007–1013 CrossRef CAS.
- D. Wang, Y. Duan, Q. Luo, X. Li and L. Bao, Desalination, 2011, 270, 174–180 CrossRef CAS.
- H. Yu, L. Liu, X. Wang, P. Wang, J. Yu and Y. Wang, Dalton Trans., 2012, 41, 10405–10411 RSC.
- W. Zhao, Y. Guo, Y. Faiz, W. T. Yuan, C. Sun, S. M. Wang, Y. H. Deng, Y. Zhuang, Y. Li, X. M. Wang, H. He and S. G. Yang, Appl. Catal., B, 2015, 163, 288–297 CrossRef CAS.
- D. Xu, B. Cheng, S. Cao and J. Yu, Appl. Catal., B, 2015, 164, 380–388 CrossRef CAS.
- H. H. Chen and Y. M. Xu, Appl. Surf. Sci., 2014, 319, 319–323 CrossRef CAS.
- H. J. Dong, G. Chen, J. X. Sun, C. M. Li, Y. G. Yu and D. H. Chen, Appl. Catal., B, 2013, 134, 46–54 CrossRef.
- C. Dong, K. L. Wu, X. W. Wei, X. Z. Li, L. Liu, T. H. Ding, J. Wang and Y. Ye, CrystEngComm, 2014, 16, 730–736 RSC.
- C. Xu, Y. Liu, B. Huang, H. Li, X. Qin, X. Zhang and Y. Dai, Appl. Surf. Sci., 2011, 257, 8732–8736 CrossRef CAS.
- G. Dai, J. Yu and G. Liu, J. Phys. Chem. C, 2012, 116, 15519–15524 CAS.
- B. Weng, F. Xu and J. Xu, J. Nanopart. Res., 2014, 16, 2766 CrossRef.
- L. Ye, Y. Su, X. Jin, H. Xie and C. Zhang, Environ. Sci.: Nano, 2014, 1, 90–112 RSC.
- L. Chen, R. Huang, M. Xiong, Q. Yuan, J. He, J. Jia, M. Y. Yao, S. L. Luo, C. T. Au and S. F. Yin, Inorg. Chem., 2013, 52, 11118–11125 CrossRef CAS PubMed.
- X. Xiao and W. D. Zhang, J. Mater. Chem., 2010, 20, 5866–5870 RSC.
- L. Shi, L. Liang, F. X. Wang, M. S. Liu and J. M. Sun, Dalton Trans., 2016, 45, 5815–5824 RSC.
- K. H. Reddy, S. Martha and K. M. Parida, Inorg. Chem., 2013, 32, 6390–6401 CrossRef PubMed.
- D. Kandi, S. Martha, A. Thirumurugan and K. M. Parida, J. Phys. Chem. C, 2017, 121, 4834–4849 CAS.
- X. Hong, Z. Wang, W. Cai, F. Lu, J. Zhang, Y. Yang, N. Ma and Y. Liu, Chem. Mater., 2005, 17, 1548–1552 CrossRef CAS.
- F. Chen, C. Niu, Q. Yang, X. Li and G. Zeng, Ceram. Int., 2016, 42, 2515–2525 CrossRef CAS.
- J. Luo, X. Zhou, J. Zhang and Z. Du, RSC Adv., 2015, 5, 86705–86712 RSC.
- Y. Song, J. Zhu, H. Xu, C. Wang, Y. Xu, H. Ji, K. Wang, Q. Zhang and H. Li, J. Alloys Compd., 2014, 592, 258–265 CrossRef CAS.
- H. Xu, Y. Song, Y. Song, J. Zhu, T. Zhu, C. Liu, D. Zhao, Q. Zhang and H. Li, RSC Adv., 2014, 4, 34539–34547 RSC.
- C. Dong, K. L. Wu, X. W. Wei, X. Z. Li, L. Liu, T. H. Ding, J. Wang and Y. Ye, CrystEngComm, 2014, 16, 730–736 RSC.
- F. Dong, Q. Li, Y. Zhou, Y. Sun, H. Zhang and Z. Wu, Dalton Trans., 2014, 43, 9468–9480 RSC.
- T. Li, X. Hu, C. Liu, C. Tang, X. Wang and S. Luo, J. Mol. Catal. A: Chem., 2016, 425, 124–135 CrossRef CAS.
- W. Zhang, Y. Sun, F. Dong, W. Zhang, S. Duan and Q. Zhang, Dalton Trans., 2014, 43, 12026–12036 RSC.
- C. Chang, L. Zhu, S. Wang, X. Chu and L. Yue, ACS Appl. Mater. Interfaces, 2014, 6, 5083–5093 CAS.
- Z. Zhu, Z. Lu, D. Wang, X. Tang, Y. Yan, W. Shi, Y. Wang, N. Gao, X. Yao and H. Dong, Appl. Catal., B, 2016, 182, 115–122 CrossRef CAS.
- L. Shi, L. Liang, J. Ma, Y. N. Meng, S. F. Zhong, F. X. Wang and J. M. Sun, Ceram. Int., 2014, 40, 3495–3502 CrossRef CAS.
- L. Chen, J. He, Q. Yuan, Y. Liu, C. T. Au and S. F. Yin, J. Mater. Chem. A, 2015, 3, 1096–1102 CAS.
- L. N. Song, L. Chen, J. He, P. Chen, H. K. Zeng, C. T. Au and S. F. Yin, Chem. Commun., 2017, 53, 6480–6483 RSC.
- Y. Tian, B. Chang, J. Lu, J. Fu, F. Xi and X. Dong, ACS Appl. Mater. Interfaces, 2013, 5, 7079–7085 CAS.
- Y. Yang, W. Guo, Y. Guo, Y. Zhao, X. Yuan and Y. Guo, J. Hazard. Mater., 2014, 271, 150–159 CrossRef CAS PubMed.
- P. Ma, H. Yu, Y. Yu, W. Wang, H. Wang, J. Zhang and Z. Fu, Phys. Chem. Chem. Phys., 2016, 18, 3638–3643 RSC.
- H. Lee and W. Choi, Environ. Sci. Technol., 2002, 36, 3872–3878 CrossRef CAS PubMed.
- Y. Liu, L. Chen, Q. Yuan, J. He, C. T. Au and S. F. Yin, Chem. Commun., 2016, 52, 1274–1277 RSC.
- C. Xing, Z. Wu, D. Jiang and M. Chen, J. Colloid Interface Sci., 2014, 433, 9–15 CrossRef CAS PubMed.
- L. Shi, F. X. Wang, J. Zhang and J. M. Sun, Ceram. Int., 2016, 42, 18116–18123 CrossRef CAS.
- J. Luo, X. Zhou, L. Ma and X. Xu, J. Mol. Catal. A: Chem., 2015, 410, 168–176 CrossRef CAS.
- J. Bao, S. Guo, J. Gao, T. Hu, L. Yang, C. Liu, J. Peng and C. Jiang, RSC Adv., 2015, 5, 97195–97204 RSC.
- S. Kumar, T. Surendar, A. Baruah and V. Shanker, J. Mater. Chem. A, 2013, 1, 5333–5340 CAS.
- J. Cao, B. Xu, H. Lin, B. Luo and S. Chen, Chem. Eng. J., 2012, 185–186, 91–99 CrossRef CAS.
- H. Lin, H. Ye, X. Li, J. Cao and S. Chen, Ceram. Int., 2014, 40, 9743–9750 CrossRef CAS.
- H. Li, Y. Cui, W. Hong and B. Xu, Chem. Eng. J., 2013, 228, 1110–1120 CrossRef CAS.
- S. Yao, M. Zhang, J. Di, Z. Wang, Y. Long and W. Li, Appl. Surf. Sci., 2015, 357, 1528–1535 CrossRef CAS.
- J. Ma, L. Shi, L. Yao, Z. Wang, C. Lu, W. Qi and D. Su, ChemistrySelect, 2017, 2, 8535–8540 CrossRef CAS.
- L. Shi, L. Liang, J. Ma, F. Wang and J. Sun, Catal. Sci. Technol., 2014, 4, 758–765 CAS.
- Z. He, C. Sun, S. Yang, Y. Ding, H. He and Z. Wang, J. Hazard. Mater., 2009, 162, 1477–1486 CrossRef CAS PubMed.
- T. S. Natarajan, K. Natarajan, H. C. Bajaj and R. J. Tayade, J. Nanopart. Res., 2013, 15, 1669–1687 CrossRef.
- F. Wang, Y. Chen, R. Zhu and J. Sun, Dalton Trans., 2017, 46, 11306–11317 RSC.
Footnote |
| † Electronic supplementary information (ESI) available. See DOI: 10.1039/c7ra10423e |
| This journal is © The Royal Society of Chemistry 2018 |