
 Open Access Article
 This Open Access Article is licensed under a Creative Commons Attribution-Non Commercial 3.0 Unported Licence
An electrodeposited molecularly imprinted quartz crystal microbalance sensor sensitized with AuNPs and rGO material for highly selective and sensitive detection of amantadine†
Yaguang Yun‡
ab,
Mingfei Pan‡ a,
Guozhen Fanga,
Ying Gua,
Wenjun Wena,
Rui Xuea and
Shuo Wang*a
a,
Guozhen Fanga,
Ying Gua,
Wenjun Wena,
Rui Xuea and
Shuo Wang*a
aKey Laboratory of Food Nutrition and Safety, Ministry of Education of China, Tianjin University of Science and Technology, Tianjin 300457, China. E-mail: s.wang@tust.edu.cn; Fax: +86 22 60912489; Tel: +86 22 60912489
bBaotou Light Industry Vocational Technical College, Baotou 014035, China
First published on 9th February 2018
Abstract
In the present work, a new amantadine (AM) imprinted quartz crystal microbalance (QCM) sensor sensitized by Au nanoparticles (AuNPs) and reduced graphene oxide (rGO) material was fabricated by electrodeposition in the presence of o-aminothiophenol (o-AT) by cyclic voltammetry scanning. AuNPs and graphene, with the advantages of great chemical stability, electrical conductivity, and large surface area, show exceptionally high sensitivity. The results of different modifications of the QCM sensor fabrication process were characterized using transmission electron microscopy (TEM), scanning electron microscopy (SEM), atomic force microscopy (AFM) and Raman spectroscopy. Under the optimal experimental conditions, the frequency shift of the MIP-QCM sensor showed a linear relationship with the concentration of the AM template in the range of 1.0 × 10⁻⁵ to 1.0 × 10⁻³ mmol L−1 with a limit of detection (LOD) of 5.40 × 10⁻⁶ mmol L−1. The imprinting factor for AM reached 7.1, the selectivity coefficient for the analogues rimantadine (RT), adamantine (AMT) and 1-chloroadamantane (CMT) were 7.3, 5.6, and 6.1, respectively. Here, a highly sensitive, selective and stable QCM sensor prepared via the imprinting approach is reported for the first time for detection of AM from animal-derived food samples.
Introduction
Amantadine (AM) with a stable tricyclic amine structure is generally used for the treatment of both influenza and Parkinson's disease in the clinical treatment of animals and human beings.1–3 In recent years, with the worldwide outbreak of avian influenza, the dependence of the breeding industry on AM has been enhanced significantly. The excessive use of AM leads to a series of side effects, such as drug resistance4 and neurotoxicity, including jitteriness, anxiety, nightmares and hallucinations.5 Because of the potential for cross-infection between animals and humans, many countries, including the USA and China, have banned AM as an antiviral agent in poultry farming to protect consumers.6 Nevertheless, it is possible that AM is still used illegally for the treatment of avian influenza, especially in poultry farming.7,8 Therefore, a good and effective method to detect AM residue in animal-derived foods is necessary from a food safety perspective.The detection methods based on different principles for AM such as chromatographic analysis methods,9–13 the immune method,14 and electrochemical sensors15 have been reported in the literature. Among these techniques, chromatography based on an instrumental analysis method is generally expensive and time-consuming. In the case of biological analysis detection relies heavily on the test conditions (e.g., temperature and pH) because of the poor stability of biological materials. The electrochemical method, which is based on electrical signals, has the advantages of low cost, fast response and microminiaturization and has the drawbacks of high background.
The quartz crystal microbalance (QCM) is well-suited as a transducer element for chemical sensors due to its high sensitivity to the nanogram level of mass change on the surface of the QCM resonator.16,17 QCM has been widely applied in biochemistry, environment, food, and clinic analysis as a label-less method for the direct study of bio-specific interaction processes.18–22 However, unmodified QCMs did not show any specific selectivity towards different molecules.23 Recently, various materials (chemicals and biomaterials) and methods (physically or chemically) have been used to modify the QCM surface in an effort to improve the selectivity.24 As an artificial synthetic material, molecularly imprinted polymer (MIP) has been applied widely in the field of molecular recognition, because of its high affinity and selectivity towards its target molecule. Therefore, MIP can be employed as a selective recognition element for QCM sensor. Many strategies have been researched to integrate the MIP and the transducer to produce sensors. Electrodeposition of monomers with target molecules on the electrode surface offers such integration.25 In comparison with conventional methods for preparation of MIPs, electrodeposition offers a simpler, more direct, controllable, and reproducible way to prepare the recognition film on the surface of the support.26,27 Because of the highly cross-linked characteristics of the imprinted polymer, MIP films have the disadvantage of poor adhesion and low electrochemical signal. To achieve a high sensitivity, nanomaterials with high surface-to-volume ratios and good conductivity have been introduced onto the surface of electrodes.28 In recent years, Au nanoparticles (AuNPs) and graphene (GR) have been extensively reported as surface modification materials for electrodes in the fabrication of sensors.29,30 AuNPs can enhance the conductivity of electrodes and the transfer rate of electron, and thus increased the analytical sensitivity.31,32 GR, a two-dimensional monolayer of sp2-bonded carbon atoms, has shown exceptional high sensitivity owing to its high chemical stability, electrical conductivity, and large surface area.33,34 Graphene oxide (GO) is obtained by an oxidation reaction with a GR surface. The presence of various oxygen-containing functional groups makes the material more active than untreated GR. Additionally, GR-based materials may generate synergistic effects on electrocatalytic activity, and thus enhance the sensitivity of the sensors.35–39 GR-based materials have been explored and applied in many fields.
Here, we fabricate an MIP-QCM sensor for AM detection for the first time through electrodeposited of o-AT on a gold surface as the recognition element. Gold-coated quartz crystals were employed as transducing elements in fabricating the molecularly imprinted QCM sensor. The highly sensitive nature of QCM sensor has been combined with facile imprinting technology. The material of GO and AuNPs improved the sensitivity by the increase in imprinted cavities. The proposed sensor provides a simple, facile, and cost-effective method with high sensitivity and selectivity for the direct examination of AM in animal-derived foods. The applicability of the proposed sensor for the analysis of animal-derived foods was also proved.
Experimental
Chemicals and instruments
The AM, o-AT, tetrabutylammonium perchlorate, chloroauric acid (HAuCl4) and the analogues (Fig. S1†), including rimantadine (RT) 1-chloroadamantane (CMT), and adamantine (AMT) were purchased from Sigma-Aldrich (St. Louis, MO, USA). GO was obtained from XFNANO Materials Tech Co., Ltd. (Nanjing, China). All other chemicals used in the experiments were purchased from Tianjin No. 1 Chemical Reagent Factory (Tianjin, China) unless otherwise stated and were of at least analytical grade.Stock solutions of the individual analytes were prepared by dissolving 15.1 mg of AM, 17.9 mg of RT, 17.1 mg of CMT, and 13.6 mg of AMT in 100 mL methanol and then stored at 4 °C in the dark. The desired working solution was obtained by diluting the individual stock solutions with methanol to the required concentrations. The GO was mixed with acetate buffer solution (ABS, 0.2 mol L−1, pH 5.0) at a concentration of 1.0 mg mL−1 assisted by ultrasonic agitation for 1 h and stored at 4 °C. This aqueous suspension of GO was used as a stock suspension in subsequent experiments.
All electrochemical experiments were performed using a PARSTAT 2273 electrochemical workstation (Princeton Applied Research, USA), with a conventional three-electrode system (a gold electrode, a platinum wire and a saturated calomel electrode (SCE) used as the working, counter and reference electrodes, respectively). The QCM (QCM-922, Princeton Applied Research, USA) equipped with an o-AT cut, gold/gold polished, 9 MHz quartz crystal (Seiko EG&G) was used to record the frequency change of the gold-coated quartz crystal electrode (AuE).
The surface morphology and structural information of the modified electrodes were characterized by scanning electron microscopy (SEM) (1530VP, LEO, Germany), atomic force microscopy (AFM) (SUPRA 55 Sapphire, German Carl ZESS) and transmission electron microscopy (TEM) (JEM-2010FEF, JEOL, Japan) and Raman spectroscopy (Renishaw Inc., Gloucestershire, with a 785 nm laser diode as excitation source). The HPLC-MS/MS system consisted of an LC-1200 pump and an MS 6410 detector (Agilent, USA). All separations were performed on a C18 column (2.1 mm × 150 mm, 3.5 μm; Agilent, USA) with acetonitrile/formic acid water (0.1% v/v; 20![[thin space (1/6-em)]](https://www.rsc.org/images/entities/char_2009.gif) :80, v/v) as the mobile phase at a flow rate of 0.2 mL min−1 at a column temperature of 25 °C.
:80, v/v) as the mobile phase at a flow rate of 0.2 mL min−1 at a column temperature of 25 °C.
Preparation of MIP/rGO–AuNPs/AuE
Prior to use, the bare AuE was sonicated in ethanol and then cleaned with freshly prepared “piranha” solution (30% H2O2/98% H2SO4 = 1/3, v/v) for 5 min, followed by thorough rinsing with double-distilled water. The prepared AuE was subjected to cyclic potential sweeping between −0.2 V to +1.5 V in 0.05 mol L−1 H2SO4 until a stable electrochemical response was obtained. Lastly, the AuE was dried under a flow of pure nitrogen gas and mounted onto the Teflon well for future use as a working electrode. The MIP/rGO–AuNPs/AuE was produced as follows (Scheme 1).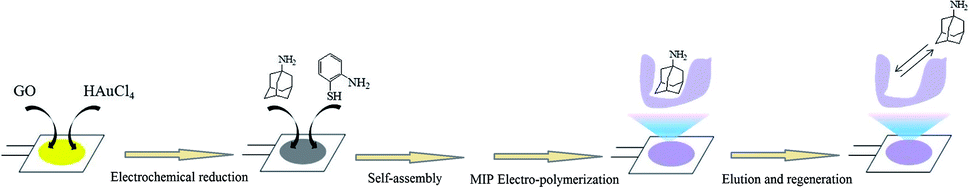 | ||
| Scheme 1 The schematic of the fabrication process of the MIP/rGO–AuNPs/AuE. | ||
First, the rGO–AuNPs/AuE was prepared via electrodeposition by CV scans for 2 cycles in the potential range from −1.5 V to +0.5 V at a scan rate of 50 mV s−1 in the GO/HAuCl4 solution (prepared by stirring 0.1 mol L−1 HAuCl4 in 1 mg mL−1 GO with a ratio of 1:100 (v/v)). After rinsing with double-distilled water and drying under nitrogen, the rGO–AuNPs/AuE was immersed in a methanol solution containing o-AT (10 mmol L−1) overnight to allow monomers to self-assemble on the rGO–AuNPs/AuE surface. Next, the MIP/rGO–AuNPs/AuE were prepared by electrodeposition using CV scans in the potential range between +0.2 V to +1.4 V at a scan rate of 50 mV s−1 for 15 cycles in the electropolymerization solution, which contained 30 mmol L−1 of o-AT, 10 mmol L−1 of AM, 5 mmol L−1 of tetrabutylammonium perchlorate and 10 mmol L−1 of HCl. The elution process was applied using 1.0 mol L−1 HCl solution in triplicate (15 min each time) to remove the AM molecules entrapped in the MIP membrane until the frequency reached its initial response. As a reference, the non-imprinted polymer (NIP)/rGO–AuNPs/AuE and MIP/AuNPs/AuE were also prepared in a similar manner, but without the template and GO, respectively.
Measurement experiments
First, a steady resonant frequency (f0, Hz) of the modified electrode was determined and recorded in 20 mL of methanol solution with magnetic stirring. The frequency (fi, Hz) for each concentration of AM was monitored. This measurement was performed in triplicate. The frequency shift Δf(fi − f0, Hz) was recorded and used in subsequent calculations. After each analysis, the AM-imprinted QCM sensor was washed to desorption for its next use.Sample preparation
Because AM is generally used for the treatment of influenza in poultry farming, three different poultry products (chicken muscle, chicken liver, and egg) were selected and bought from a local market. First, samples of each kind of product were minced (2.0 g) and were spiked with three levels of AM (40.0 μg L−1, 80.0 μg L−1, 120.0 μg L−1). They were then mixed with 10.0 mL of methanol–TCA (1%, m/v; 1/1, v/v) in a 50 mL centrifuge tube, followed by shaking with a vortex mixer for 2 min. The mixture then was ultrasonicated for 30 min and centrifuged at 10000 rpm at 4 °C. The solid phase extraction (SPE) was used for purification of the obtained supernatant.
Prior to use, the MCX cartridge (Oasis-MCX, 3 cm3, 60 mg) used for SPE was activated with methanol (6.0 mL) and double-distilled water (6.0 mL). First, the sample extraction (5 mL) was loaded with a flow rate of 1.0 mL min−1. Following this, the 2% HCl (6.0 mL) and methanol (6.0 mL) were used for elution. Second, 5.0 mL of ammonium hydroxide–methanol–isopropanol (5/80/15, v/v/v) was used to elute the AM remaining on the MCX cartridge. Third, the solvents in the eluent solution were removed with dry nitrogen. Finally, the residue was re-dissolved in methanol (1.0 mL). After filtering through a 0.22 μm nylon filter, the obtained solution was used directly for HPLC-MS/MS analysis and diluted with 20 mL of methanol for QCM analysis, respectively.
Results and discussion
Optimization of conditions for MIP film preparation
The molar ratio of the template and monomer during the electrodeposition process determines the structure and thickness of the MIP membrane and hence influences the number of anchoring sites for template molecules within the polymeric network. Various MIP membranes synthesized at different template/monomer molar ratios (1/1, 1/2, 1/3, 1/4, 1/5) were modified on rGO–AuNPs/AuE to compare by evaluating the imprinting effect. As shown in Fig. S2,† when the template/monomer molar ratios were 1/1 and 1/2, the −Δf of MIP/rGO–Au/AuE were increased. A reason for this might be that the increase in the functional monomer leads to more available binding sites on the MIP/rGO–Au/AuE and enhanced electron transport. When the molar ratio of template/monomer increased to 1/3, the −Δf of MIP/rGO–Au/AuE reached its maximum value 298.6 Hz (Fig. S2†). Interestingly, the −Δf decreased gradually when the template/monomer molar ratios were at 1/4 and 1/5. This might reflect the fact that the gradually increased monomer led to an increase in the thickness and a subsequent decrease in the conductivity of the MIP film. Thus, the molar ratio of the template/monomer was set as 1/3 for further experiments to optimize the results.The thickness of the MIP membrane is another critical factor that affects the sensitivity of the sensor, which is adjusted by the number of scan cycles during the electrodeposition procedure. In the present experiment, various MIP/rGO–Au/AuE were prepared utilizing different numbers of scan cycles (5, 10, 15, 20, 25) under the same conditions. As shown in Fig. S3,† with the increase in scan cycles, the −Δf to AM increased and reached a maximum value 294.2 Hz at 15 scan cycles. Furthermore, the −Δf decreased gradually with more scan cycles (20, 25). These results might indicate that the MIP/rGO–Au/AuE created at 15 scan cycles produced the largest number of imprinted cavities on the electrode surface and enhanced the sensitivity of the sensor. Thus, 15 cycles were selected as the optimized scan cycle to prepare an MIP membrane for further experiments.
TEM and SEM images of the AuNPs, rGO and rGO–AuNPs
The morphology of AuNPs, rGO and rGO–AuNPs were characterized visually by TEM.As shown in Fig. 1A, the AuNPs by electrodeposited existed in an aggregated form, with an average particle diameter of approximately 30 nm. As shown in the TEM figure of rGO (Fig. 1B), there was a kind of transparent curl in a folded structure, which is the typical structure of rGO. As seen in the rGO–AuNPs (Fig. 1C) material, a large number of AuNPs with a diameter of approximately 10 nm, which are smaller than the size of the single AuNPs, were uniformly distributed in a thin layer of GR, suggesting that AuNPs might have relatively strong interactions with the surface of the rGO through electrostatic or π–π stacking. The surface morphology of AuNPs, rGO and rGO–AuNPs material modified electrode was also recorded using SEM. It was clearly observed that the diameter of AuNPs was approximately 30–40 nm (Fig. 1D). Fig. 1E indicated that the GO was tightly adhered to the electrode surface. The rGO–AuNPs material modified QCM electrode showed a three-dimensional surface (Fig. 1F).
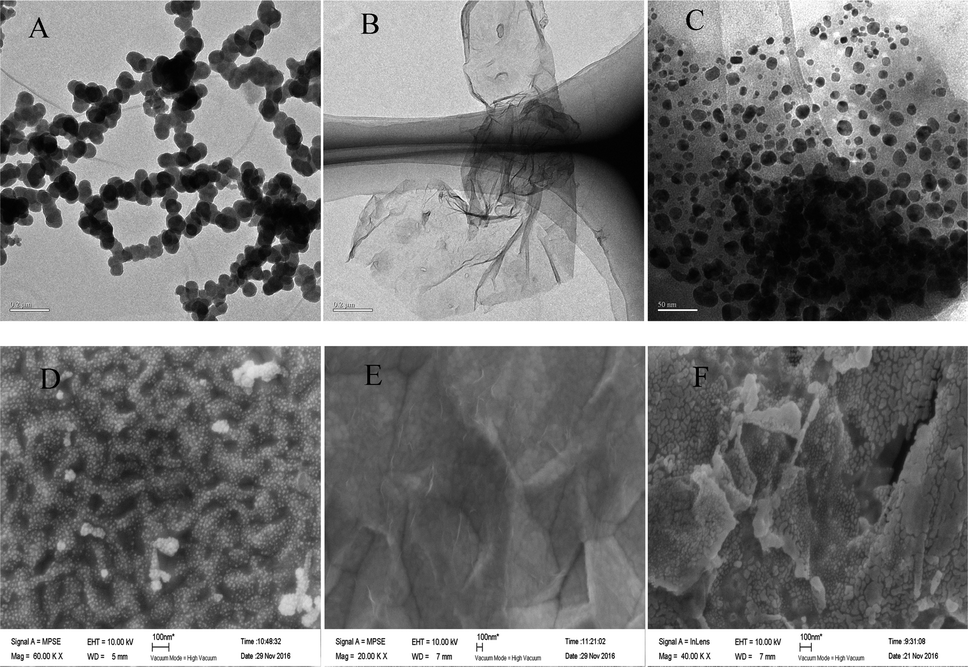 | ||
| Fig. 1 TEM images of AuNPs (A), rGO (B) and rGO–AuNPs (C). SEM images of AuNPs/AuE (D), rGO/AuE (E) and rGO–AuNPs/AuE (F). | ||
Fig. 2A shows the Raman spectra of the bare Au electrode, GO and the QCM Au electrode electrodeposited with AuNPs, rGO and rGO–AuNPs, respectively. As shown in Fig. 2A, the QCM Au electrode barely got peaks before (a) and after (b) electrodeposited with AuNPs, which provided a pure substrate for the measurement of GR. In Fig. 2A(c), the Raman spectrum of the GO, as expected, displays the main features of GR-based materials with a D peak at 1335 cm−1 and a G peak at 1563 cm−1. The G peak is related to the GR due to the bond stretching of all pairs of sp2 atoms in both rings and chains, whereas the D peak is a defect peak due to the breathing modes of sp2 atoms in rings.40,41 Raman spectrum recorded on rGO/AuE (Fig. 2A(d)) displayed the main features of rGO-based materials with a D-band at 1322 cm−1 and a G-band at 1564 cm−1 with ID/IG = 2.2, and rGO–AuNPs/AuE (Fig. 2A(e)) also contains both D and G peaks (at 1335 cm−1 and 1595 cm−1, respectively) with ID/IG = 1.7. However, the Raman spectra of rGO/AuE and rGO–AuNPs/AuE had an increased D/G intensity ratio compared to that in GO (with ID/IG = 1.3). This change suggested a decrease in the average size of the sp2 domains during the reduction of GO. And it could be explained if new graphitic domains were created, which are smaller in size, while larger in number compared to the ones presented in GO.42 The asymmetric 2D band centered at approximately 2700 cm−1 indicates GR or graphite-like structured films.43,44
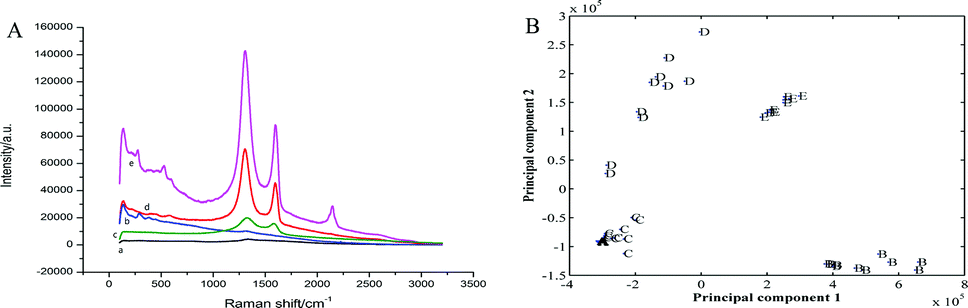 | ||
| Fig. 2 (A) Raman spectra of bare Au electrode (a), AuNPs/AuE (b), GO before (c) and after (d) deposition on to the QCM Au electrode, rGO–AuNPs/AuE (e); (B) principal component analysis (PCA) plots of different modified QCM electrode. | ||
Principal component analysis (PCA) was employed in this work to reduce multidimensional data obtained from the Raman spectra to two dimensions, while retaining the majority of the variance in the data. Fig. 2B shows PCA model obtained from Raman spectra of five sample dataset. As observed in the figure, the clusters corresponding to the five studied electrodes were visibly separated and discriminated.
Characterization of the different modified electrodes
The preparation of the modified electrodes was accomplished as discussed in the Experimental section. First, the rGO–AuNPs material was subjected to electrodeposition in the GO/HAuCl4 suspension by CV scan. This served as a medium to increase the electrode conductivity and surface area. Secondly, an SAM of o-AT molecules was formed on the surface of rGO–AuNPs/AuE through Au–S bonds between the –SH groups of o-AT molecules and the AuNPs of rGO–AuNPs. The SAM of o-AT served as an initial polymerizable monolayer to drive the electrodeposition and increase the amount of imprinted sites on the rGO–AuNPs/AuE surface. Lastly, the AM MIPs were prepared by electrodeposition using CV scan in the electro-polymerization solution.AFM was applied to characterize the morphology of QCM surfaces. Compared with MIP/AuNPs/AuE (Fig. 3A), the surface of MIP/rGO–AuNPs/AuE is rougher (Fig. 3B) indicating a higher surface area. This might be due to the introduction of rGO–AuNPs material, which increased the surface area on the MIP/rGO–AuNPs/AuE membrane and improved the number of effective imprinted sites. Fig. 3 also shows the SEM of MIP/AuNPs/AuE (Fig. 3C), MIP/rGO/AuE (Fig. 3D) and MIP/rGO–AuNPs/AuE (Fig. 3E). When MIP was electrodeposited on the modified electrodes, they showed three-dimensional network structure. Due to the large surface area of GO, MIP/rGO–AuNPs/AuE showed a rougher surface, which largely increased the specific surface area of the electrode. It was clear that the rGO–AuNPs material promoting to form a MIP membrane on the surface of the electrodes with more effective imprinted sites.
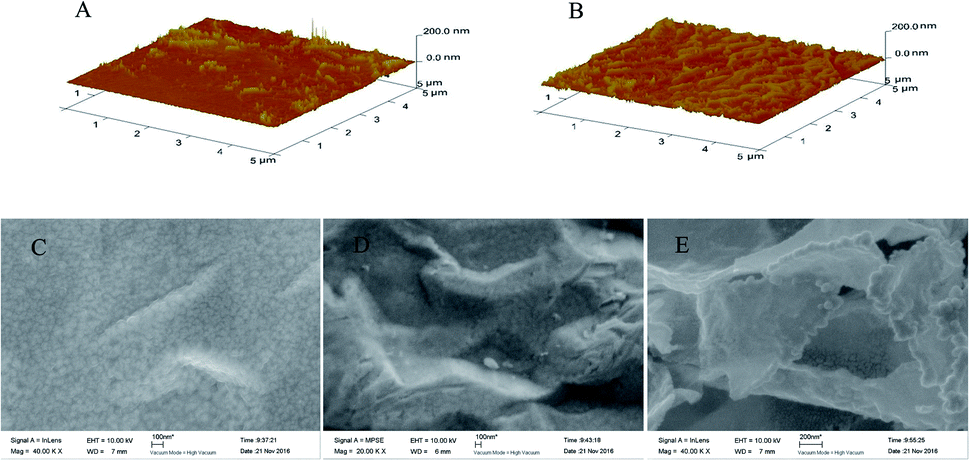 | ||
| Fig. 3 AFM images of MIP/AuNPs/AuE (A) and MIP/rGO–AuNPs/AuE (B). SEM images of MIP/AuNPs/AuE (C), MIP/rGO/AuE (D), and MIP/rGO–AuNPs/AuE (E). | ||
Electrochemical behaviour of the sensor
In this work, the CV analysis was performed to investigate the electron transmission process of various surface-modified electrodes in 1.0 mmol L−1 K3[Fe(CN)6] solution containing 0.2 mol L−1 KNO3.As shown in Fig. 4A, the rGO–AuNPs/AuE (curve b) has obtained a larger CV current response (52.43 μA) than the bare AuE (35.88 μA) (curve a). It was suggested that the rGO–AuNPs material had improved the surface and conductivity of the electrode surface, thus the probe K3[Fe(CN)6] was allowed to reach the electrode surface easily. The CV curve of MIP/rGO–AuNPs/AuE (curve c) without removing the template obtained a similar curve on the NIP modified electrode (curve f), indicating that these two kinds of modified electrodes have similar electron transfer capability. This could be attributed to the densification of the membranes on the electrode surface. After template removal, a pair of redox peaks responding to K3[Fe(CN)6] appeared again (curve d). This result suggested that due to the removal of the AM molecules from the MIP membranes, the cavities thus formed were used for the probe diffusion and therefore increased the CV current response. Curve e (25.21 μA) has shown the current response after incubating the MIP electrode in 1.0 × 10⁻³ mmol L−1 of AM, which is lower than curve d (31.43 μA), meaning the rebinding of AM has blocked the diffusion of the K3[Fe(CN)6] probe.
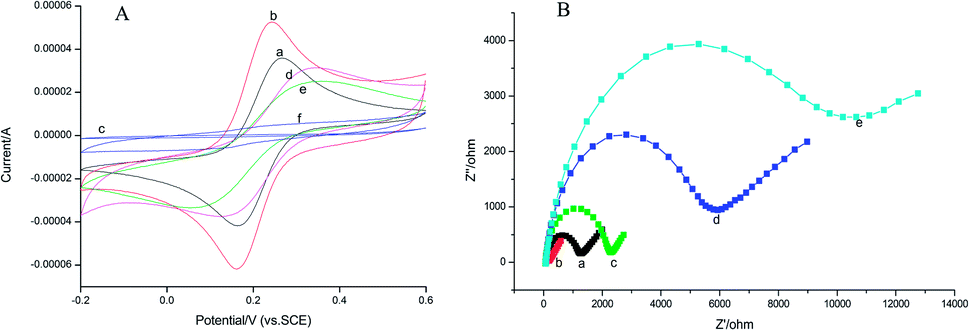 | ||
| Fig. 4 (A) CV curves of different modified electrodes in 1.0 mmol L−1 K3[Fe(CN)6] solution (containing 0.2 mol L−1 KNO3): the bare Au (a), rGO–AuNPs/AuE (b), MIP/rGO–AuNPs/AuE before elution (c), MIP/rGO–AuNPs/AuE after elution (d), MIP/rGO–AuNPs/AuE immersion in 1.0 × 10⁻³ mmol L−1 AM solution (e), NIP/rGO–AuNPs/AuE after elution (f). Potential range: −0.2 to 0.6 V; scan rate: 0.05 V s−1. (B) EIS of different modified electrodes in K3[Fe(CN)6]/K4[Fe(CN)6] solution: the bare Au (a), rGO–AuNPs/AuE (b), MIP/rGO–AuNPs/AuE after elution (c), MIP/rGO–AuNPs/AuE immersion in 1.0 × 10⁻³ mmol L−1 AM solution (d), NIP/rGO–AuNPs/AuE after elution (e). | ||
Electrochemical impedance spectroscopy (EIS) consists of a semicircle part lying on the Z′-axis followed by a straight line. It is an effective electrochemical technique for the characterization of the transduction of sensing events at electrode surfaces. In this work, EIS data were measured from 0.1 Hz to 100 kHz and at an AC voltage of 10 mV amplitude with modified electrodes in 2.5 mmol L−1 K3[Fe(CN)6]/K4[Fe(CN)6] solution containing 0.2 mol L−1 KNO3. As shown in Fig. 4B, bare Au (curve a) electrode showed a small semicircle region that corresponds to the electron-transfer limited process at higher frequencies, exhibiting a low electron-transfer resistance (Ret) to the redox of the probe K3[Fe(CN)6]/K4[Fe(CN)6]. The EIS for the rGO–AuNPs/AuE (curve b) exhibited almost a straight line, which reflects the diffusion of electrons at lower frequencies, signifying the pre-deposited rGO–AuNPs accelerated electron-transfer process. When AM was eluted, the Ret of the MIP/rGO–AuNPs/AuE (curve c) increased, indicating only the imprinted cavities acted as channels for shuttling electrons between the probe K3[Fe(CN)6]/K4[Fe(CN)6] and the MIP/rGO–AuNPs/AuE. Interestingly, when the MIP/rGO–AuNPs/AuE was further incubated with 1.0 × 10⁻³ mmol L−1 solution of AM, the Ret (curve d) further increased. This result might be due to the rebinding of AM on the specific recognition sites formed on the surface of MIP/rGO–AuNPs/AuE, hence a lower diffusion rate of the probe K3[Fe(CN)6]/K4[Fe(CN)6] to the electrode surface. The NIP/rGO–AuNPs/AuE (curve e) after elution show a large-diameter semicircle, which was because the film modified on the electrode is nonconductive. These results were consistent with the results obtained from the CV methods described previously, confirming the successful preparation of the MIP/rGO–AuNPs on the electrode surface.
Evaluation of binding performance
As seen in Fig. 5, curve a showed that the frequency change of the MIP/rGO–AuNPs/AuE QCM sensor was proportional with the concentration of AM, ranging from 1.0 × 10⁻⁵ mmol L−1 to 1.0 × 10⁻³ mmol L−1. The detection limit reached 5.40 × 10⁻⁶ mmol L−1 (S/N = 3). The linear regression equation was expressed as −Δf (Hz) = 3.166CAM + 11.18, (R2 = 0.995). Under the same experimental conditions, the linearity of MIP/AuNPs/AuE was achieved with the AM concentration of 8.0 × 10⁻⁵ mmol L−1 to 1.0 × 10⁻³ mmol L−1 (Fig. 5, curve b). The linear regression equation was as −Δf (Hz) = 1.458CAM + 3.514, (R2 = 0.991). There is a result obtained from the above-mentioned mathematics that the MIP/rGO–AuNPs/AuE had broader range than the MIP/AuNPs/AuE both in the frequency change and linear range. This might reflect the fact that the rGO–AuNPs material increased the effective surface area and thus the frequency response signal is amplified. The frequency change of the NIP/rGO–AuNPs/AuE (curve c) was much lower than that of the MIP/rGO–AuNPs/AuE and MIP/AuNPs/AuE. This might be explained by the fact that the NIP/rGO–AuNPs/AuE had hardly any imprinted sites leading to poor specificity, and thus obtained a shorter linearity range.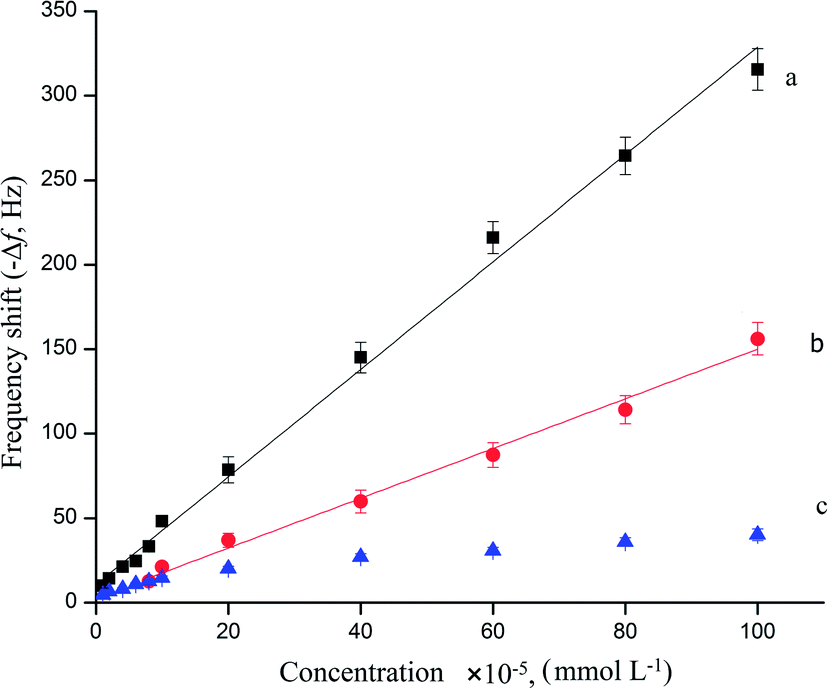 | ||
| Fig. 5 Calibration curves of the MIP/rGO–AuPs/AuE (a), MIP/AuNPs/AuE (b), and NIP/rGO–AuPs/AuE (c) to AM. | ||
Selectivity of the MIP QCM sensor
When using the proposed QCM sensor to detect AM in samples, it is possible that some compounds with similar structure affect the detection of AM.45 To investigate the selectivity of the proposed sensor, the frequency change of AM and analogues (RT, AMT, CMT) on the MIP– and NIP/AuNPs–rGO/AuE sensor were examined and shown in Fig. 6.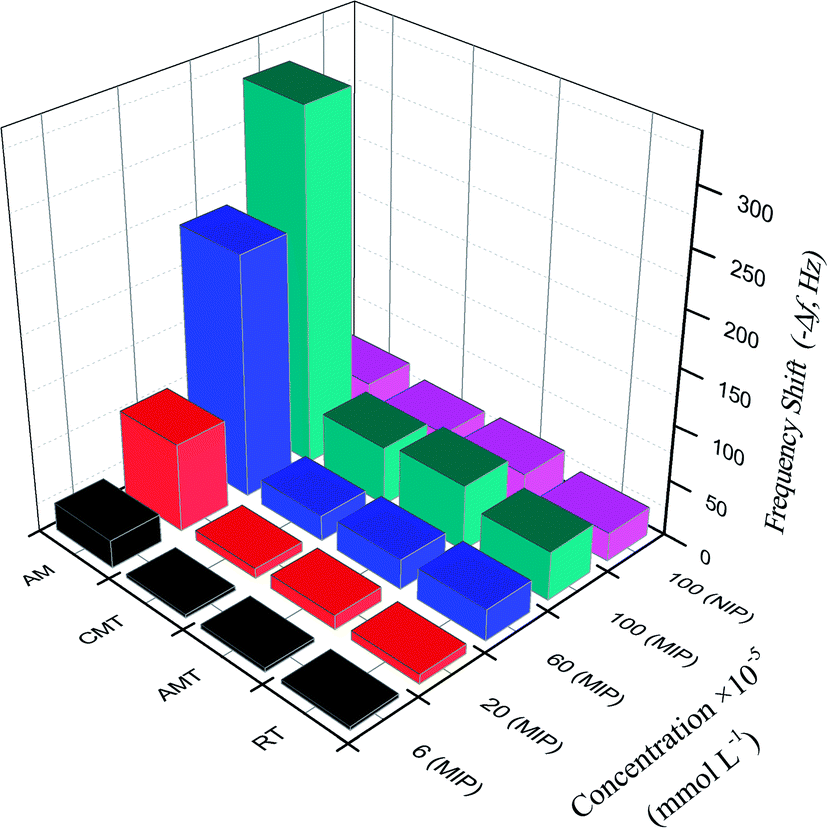 | ||
| Fig. 6 The frequency shift corresponding to the MIP– and NIP/rGO–AuNPs/AuE for AM and analogues at various concentrations. | ||
The imprinting factor (IF) was defined as ΔfMIP/ΔfNIP indicating the adsorption ability of the sensor towards the targeted molecules. At the AM concentration of 1.0 × 10⁻³ mmol L−1, the IF of AM reached 7.1, showing that MIP/rGO–AuNPs/AuE had a high adsorption capacity for AM, which might be due to imprinted cavities with the complementarity of size and shape in the polymer structure.
For the analogues RT, AMT and CMT, the selectivity coefficient (SC, KAM/Kanalogue, K is the slope of the calibration curves) was calculated as 7.3, 5.6, and 6.1, respectively. This indicated that the frequency changes for these three analogues were much less significant than for the AM. These results clearly show that MIP/rGO–AuNPs/AuE has a higher selectivity recognition capacity for AM in comparison to RT, AMT and CMT. This might reflect the fact that binding sites of MIP/rGO–AuNPs/AuE increased owing to the introduced rGO–AuNPs material with a large surface and high electrical conductivity.
Reproducibility and stability
Parallel measurements with five freshly prepared MIP/rGO–AuNPs/AuE electrodes were evaluated by measuring the frequency changes in 1.0 × 10⁻³ mmol L−1 AM solution under the same experimental conditions. The relative standard deviation (RSD, n = 3) of 6.8% was obtained. The frequency change for seven successive detection using one MIP/rGO–AuNPs/AuE electrode showed an RSD of 4.2% (n = 3). The above results revealed that the proposed sensor had favourable reproducibility both in the process of preparation and determination. It further illustrated that the introduction of the rGO–AuNPs material has been proven to play a positive role in improving the performance of the proposed sensor.After storing the same MIP/rGO–AuNPs/AuE electrode for 30 days at 4 °C, approximately 90% of its initial frequency response was achieved, revealing the high repeatability and stability of the developed imprinted sensor, which was attributed to the good stability of the rGO–AuNPs material, and thus the good capability of the AM detection.
Practical sample analysis
Three samples (chicken muscle, chicken liver and egg) were selected, and three different concentrations of AM were added to perform the recovery experiments. To validate the performance of the proposed sensor in practice, a sensitive HPLC-MS/MS method was used for AM detection (Table 1). The results obtained from the proposed sensor showed mean recoveries ranging from 90.4% to 94.7% with SDs (n = 3) from 0.9% to 1.9%. The results obtained from HPLC-MS/MS (mean recoveries ranged from 89.3% to 93.8% with SDs (n = 3) from 1.1% to 2.6%) and the proposed sensor had a good correspondence. These results confirmed that the developed MIP-QCM sensor was reliable and effective for analysing low levels of AM in practical samples.| Sample | Initial concentration (μg kg−1) | Added concentration (μg kg−1) | The proposed MIP-QCM sensor | HPLC-MS/MS | ||
|---|---|---|---|---|---|---|
| Found (μg kg−1) | Recoverya (%) (means ± SD, n = 5) | Found (μg kg−1) | Recoverya (%) (means ± SD, n = 5) | |||
| a Recovery (%) = found concentration/(initial concentration + added concentration) × 100%. | ||||||
| Chicken muscle | 6.6 | 40.0 | 43.4 | 93.1 ± 0.9 | 41.6 | 89.3 ± 2.6 |
| 80.0 | 78.3 | 90.4 ± 1.6 | 78.9 | 91.2 ± 1.8 | ||
| 120.0 | 117.2 | 92.6 ± 1.5 | 114.6 | 90.5 ± 1.1 | ||
| Chicken liver | 10.8 | 40.0 | 47.5 | 93.5 ± 1.0 | 45.8 | 90.1 ± 1.5 |
| 80.0 | 83 | 91.4 ± 1.4 | 82.2 | 90.5 ± 1.3 | ||
| 120.0 | 120.9 | 92.4 ± 0.9 | 119.7 | 91.5 ± 1.3 | ||
| Egg | 0 | 40.0 | 37.4 | 93.6 ± 1.9 | 36.6 | 91.6 ± 2.3 |
| 80.0 | 75.8 | 94.7 ± 1.3 | 75.1 | 93.8 ± 1.8 | ||
| 120.0 | 113.4 | 94.5 ± 1.4 | 110.4 | 92.0 ± 1.3 | ||
Conclusions
In the present study, an AM-imprinted QCM sensor has been developed for the first time. The material of rGO–AuNPs improved the sensitivity of the sensor. The proposed QCM sensor with high stability and repeatability has been proved to be simple, short response time, and wide linear range, thus providing a new route for AM residual detection in animal-derived foods.Conflicts of interest
There are no conflicts to declare.Acknowledgements
This work is financially supported by Tianjin Natural Science Foundation (No. 17JCQNJC14800), Basic Research Fees of Universities and Colleges in Tianjin (No. 2017KD01), the program for Changjiang Scholars and Innovative Research Team in University (No. IRT1166), and the Innovative Team project from Tianjin University of Science and Technology (No. 115004/0000010105).References
- C. F. Chew, A. Guy and P. C. Biggin, Biophys. J., 2008, 95, 5627–5636 CrossRef CAS PubMed.
- R. L. Tominack and F. G. Hayden, Infect. Dis. Clin. North Am., 1987, 1, 459–478 CAS.
- M. Foller, C. Geiger, H. Mahmud, J. Nicolay and F. Lang, Eur. J. Pharmacol., 2008, 581, 13–18 CrossRef PubMed.
- G. He, J. Qiao, C. Dong, C. He, L. Zhao and Y. Tian, Antiviral Res., 2008, 77, 72–76 CrossRef CAS PubMed.
- N. Nishikawa, M. Nagai, T. Moritoyo, H. Yabe and M. Nomoto, Parkinsonism Relat. Disord., 2009, 15, 351–353 CrossRef CAS PubMed.
- Y. L. Wu, R. X. Chen, Y. Xue, T. Yang, J. Zhao and Y. Zhu, J. Chromatogr. B: Anal. Technol. Biomed. Life Sci., 2014, 965, 197–205 CrossRef CAS PubMed.
- L. F. Ai, Y. S. Ma, R. C. Chen, C. H. Guo and Z. S. Kang, Chin. J. Anal. Chem., 2013, 41, 1194–1198 CrossRef CAS.
- Z. Liu, F. Yang, K. Yu, Y. Lin, S. Liu and Q. Zhang, Chin. J. Chromatogr., 2012, 30, 1253–1259 CrossRef CAS.
- H. Yan, X. Liu, F. Cui, H. Yun, J. Li and S. Ding, J. Chromatogr. B: Anal. Technol. Biomed. Life Sci., 2013, 938, 8–13 CrossRef CAS PubMed.
- M. A. Farajzadeh, N. Nouri and A. A. Alizadeh Nabil, J. Chromatogr. B: Anal. Technol. Biomed. Life Sci., 2013, 940, 142–149 CrossRef CAS PubMed.
- N. Reichová, J. Pazourek, P. Polášková and J. Havel, Electrophoresis, 2002, 23, 259–262 CrossRef.
- I. A. Darwish, A. S. Khedr, H. F. Askal and R. M. Mahmoud, J. Appl. Spectrosc., 2006, 73, 792–797 CrossRef CAS.
- X. Ai, L. Niu, Y. Li, F. Yang and X. Su, Talanta, 2012, 99, 409–414 CrossRef CAS PubMed.
- H. X. Sun, L. M. Cao, H. Lin and F. Lv, Appl. Mech. Mater., 2012, 161, 88–93 CrossRef CAS.
- Y. G. Yun, M. F. Pan, G. Z. Fang, Y. K. Yang, T. Guo, J. K. Deng and S. Wang, Sens. Actuators, B, 2017, 238, 32–39 CrossRef CAS.
- Z. P. Yang and C. J. Zhang, Sens. Actuators, B, 2009, 142, 210–215 CrossRef CAS.
- F. Liu, X. Liu, S. Ng and H. S. Chan, Sens. Actuators, B, 2006, 113, 234–240 CrossRef CAS.
- F. N. Nunalee, K. R. Shull, B. P. Lee and P. B. Messersmith, Anal. Chem., 2006, 78, 1158–1166 CrossRef CAS PubMed.
- I. S. Park, D. K. Kim, N. Adanyi, M. Varadi and N. Kim, Biosens. Bioelectron., 2004, 19, 667–674 CrossRef CAS PubMed.
- L. J. Kong, M. F. Pan, G. Z. Fang, X. L. He, Y. K. Yang, J. Dai and S. Wang, Biosens. Bioelectron., 2014, 51, 286–292 CrossRef CAS PubMed.
- M. F. Pan, G. Z. Fang, Y. Lu, L. J. Kong, Y. K. Yang and S. Wang, Sens. Actuators, B, 2015, 207, 588–595 CrossRef CAS.
- M. F. Pan, L. J. Kong, B. Liu, K. Qian, G. Z. Fang and S. Wang, Sens. Actuators, B, 2013, 188, 949–956 CrossRef CAS.
- R. Say, A. Gultekin, A. A. Ozcan, A. Denizli and A. Ersoz, Anal. Chim. Acta, 2009, 640, 82–86 CrossRef CAS PubMed.
- M. Avila, M. Zougagh, A. Escarpa and A. Rios, Talanta, 2007, 72, 1362–1369 CrossRef CAS PubMed.
- A. Kumar Singh and M. Singh, Biosens. Bioelectron., 2015, 74, 711–717 CrossRef CAS PubMed.
- X. Kan, H. Zhou, C. Li, A. Zhu, Z. Xing and Z. Zhao, Electrochim. Acta, 2012, 63, 69–75 CrossRef CAS.
- B. Rezaei, M. B. Khalili and A. A. Ensafi, Biosens. Bioelectron., 2014, 60, 77–83 CrossRef CAS PubMed.
- L. Kong, X. Y. Jiang, Y. B. Zeng, T. S. Zhou and G. Y. Shi, Sens. Actuators, B, 2013, 185, 424–431 CrossRef CAS.
- M. L. Yola, T. Eren and N. Atar, Sens. Actuators, B, 2015, 210, 149–157 CrossRef CAS.
- H. M. Azzazy, M. M. Mansour, T. M. Samir and R. Franco, Clin. Chem. Lab. Med., 2012, 50, 193–209 CrossRef CAS PubMed.
- M. L. Yola and N. Atar, Electrochim. Acta, 2014, 119, 24–31 CrossRef CAS.
- M. L. Yola, T. Eren and N. Atar, Electrochim. Acta, 2014, 125, 38–47 CrossRef CAS.
- C. F. Huang, G. H. Yao, R. P. Liang and J. D. Qiu, Biosens. Bioelectron., 2013, 50, 305–310 CrossRef CAS PubMed.
- J. T. Robinson, F. K. Perkins, E. S. Snow, Z. Wei and P. E. Sheehan, Nano Lett., 2008, 8, 3137–3140 CrossRef CAS PubMed.
- K. Zhang, Q. Yue, G. Chen, Y. Zhai, L. Wang and H. Wang, J. Phys. Chem. C, 2010, 115, 379–389 Search PubMed.
- A. F. Zedan, S. Sappal, S. Moussa and M. S. El-Shall, J. Phys. Chem. C, 2010, 114, 19920–19927 CAS.
- H. Wang, L. F. Cui, Y. Yang, H. S. Casalongue, J. T. Robinson and Y. Liang, J. Am. Chem. Soc., 2010, 132, 13978–13980 CrossRef CAS PubMed.
- D. Chen, H. Zhu and T. Liu, ACS Appl. Mater. Interfaces, 2010, 2, 3702–3708 CAS.
- Y. Du, S. Guo, S. Dong and E. Wang, Biomaterials, 2011, 32, 8584–8592 CrossRef CAS PubMed.
- A. C. Ferrari, Solid State Commun., 2007, 143, 47–57 CrossRef CAS.
- H. L. Wang, J. T. Robinson, X. L. Li and H. J. Dai, J. Am. Chem. Soc., 2009, 131, 9910–9911 CrossRef CAS PubMed.
- S. Chattopadhyay, M. S. Li, P. R. Kumar and C. T. Wu, Analyst, 2015, 140, 3935–3941 RSC.
- L. He, Q. Wang, D. Mandler, M. Li, R. Boukherroub and S. Szunerits, Biosens. Bioelectron., 2016, 75, 389–395 CrossRef CAS PubMed.
- P. Subramanian, A. Lesniewski, I. Kaminska, A. Vlandas, A. Vasilescu and J. Niedziolka-Jonsson, Biosens. Bioelectron., 2013, 50, 239–243 CrossRef CAS PubMed.
- N. Gao, J. Dong, M. Liu, B. Ning, C. Cheng and C. Guo, Analyst, 2012, 137, 1252–1258 RSC.
Footnotes |
| † Electronic supplementary information (ESI) available: Fig. S1. The Chemical structure of AM and analogues. Fig. S2. Frequency shift of MIP modified electrodes with different template/monomer molar ratio in 1.0 × 10⁻³ mmol L−1 AM solution. Fig. S3. Frequency shift of the different scanning cycles in electrodeposition process. See DOI: 10.1039/c7ra09958d |
| ‡ Yaguang Yun and Mingfei Pan contributed equally to this work as the first authors. |
| This journal is © The Royal Society of Chemistry 2018 |