 Open Access Article
Effect of C60 on the phase transition behavior of a lipid bilayer under high pressure
Haiyang Yang a,
Zhiheng Huanga and
Yong Zhang*b
aSchool of Materials Science and Engineering, Sun Yat-Sen University, 135 West Xingang Road, Guangzhou 510275, China
bSchool of Physics, Sun Yat-Sen University, 135 West Xingang Road, Guangzhou 510275, China. E-mail: zhyong9@mail.sysu.edu.cn
First published on 2nd January 2018
Abstract
Interactions between fullerenes and cells and effects on the main transition of lipid bilayers have attracted much attention in biophysics in recent years. By employing coarse-grained molecular dynamics simulations, we obtained the temperature–pressure phase diagrams of a dipalmitoylphosphatidylcholine bilayer, which exhibits a gel phase and a fluid phase, with variation of the C60 versus lipid ratios. The simulation results show that the critical area per lipid at the fluid–gel main phase transition boundary increases with the increasing ratios of C60. A critical area per lipid of 0.594 ± 0.002 nm2 is obtained when the ratio of C60 reaches 6.4% while that of the pure bilayer case is 0.572 ± 0.002 nm2. The main transition temperature, Tm, remains almost unchanged with the addition of C60 below a ratio of 4.7%, while a 2 K decrease of Tm is observed at a ratio of 6.4% under various pressures. Consequently, the presence of C60 in the bilayer, with the ratio of C60 less than 4.7%, will not influence the main transition behavior of the bilayer even under pressure as high as 1500 bar. The radial distribution function analyses suggest that the presence of C60 produces no impact on the radial distribution of the lipids in the bilayers. The lateral density profiles show that the incorporation of C60 with relatively high ratios stabilizes the thickness of the bilayer.
1 Introduction
Fullerenes have attracted attention extensively since C60 was first discovered in 1985.1 They have various applications in diverse fields, e.g., energy application,2 cosmetic products,3 medical application4 and polymer modifications5 due to their unique physicochemical properties.6 In particular, tremendous efforts have been focused on the applications of fullerenes in biomedicine since the landmark work by Friedman and co-workers in 1993.7 For example, fullerenes have been used as HIV inhibitors8–10 and radical scavengers11–13 in therapeutics and fullerene–biomolecule conjugates have been designed as drug-delivery systems.14–16 In addition, C60 fullerene and its derivatives are remarkable triplet sensitizers, which can be used to produce highly reactive oxygen species for photodynamic therapy.17,18 On the basis of the appealing characteristics and application prospects of fullerenes, there has been growing interest in the study of fullerenes and their interactions with biological systems, in particular with lipid bilayers.19–25In a biological system, a biomembrane is one of the most fundamental structural elements, which acts as a highly selective barrier for the exchange of various molecules between different spatial regions and compartments. A lipid bilayer is usually employed as a simplified model of a biomembrane in the relevant studies. It is well known that the lipid bilayer exists in various phase states, depending on pressure, temperature, the lipid components and the ionic composition of the aqueous environment, etc. At high temperatures, the lipid molecules pack in a disordered state and form a flat fluid membrane called a fluid phase or a liquid-crystalline phase, which is mainly physiologically relevant. At low temperatures, on the contrary, the lipid molecules are densely compacted, forming a gel phase, which is characterized by ordered chains, a lower area per lipid (APL) and lower lipid lateral mobility compared to the fluid phase. The transition from the fluid phase to the gel phase with a temperature decrease is defined as the main transition, and the critical temperature of the main transition is called the main transition temperature (Tm). The main transition plays a vital role in biophysics for the reason that the shift of the Tm may exert remarkable influences on the biological activity of cell membranes and thus on interrupting the cell functions. For example, it has been reported that the physical state of lipid acyl chains produces a striking impact on the activity of membrane enzymes and the membrane transport processes.26
Experimental and simulation studies have confirmed that C60 can enter into lipid bilayers.27–29 The effects of C60 on the physico-structural properties of lipid membranes have been investigated by Wong-Ekkabut and co-workers using computer simulations.20 They reported an increase of bilayer viscosity and a 40% decrease of the lateral diffusion coefficient of the lipids. Meanwhile, the authors concluded that the addition of C60 has no obvious structural damage to the membrane since the phenomena of pore formation, micellization and bilayer rupture were not observed. Zhou et al. studied the effects of C60 on the mechanical resistance and elastic modulus of lipid bilayers using a combination of atomic force microscopy, laser scattering and infrared spectroscopy.24 The results suggested that the incorporation of C60 weakens the lipid mobility in the gel phase and increases the membrane viscosity. Nevertheless, most of such studies focused on the effect of C60 on the mechanical and structural properties of the lipid membrane. Few studies have elucidated the effects of C60 on the main transition of the lipid membrane, in particular under high pressure.
Molecular dynamics (MD) simulations provide molecular-level insights into the mechanisms of various biological processes.30 Many investigations on the main transition behavior of the lipid membrane using the MD simulation approach are successful.31–34 In this study, we aim to explore the effects of C60 on the main transition behavior of the lipid bilayer and the distribution properties under high pressure. Using systematic coarse-grained (CG) MD simulations of fluid dipalmitoylphosphatidylcholine (DPPC) bilayers with various addition ratios of C60, we obtain the relationship between Tm of the DPPC bilayer and the amount of C60 under different pressures and the T–p phase diagrams of the DPPC bilayer. Our results suggest that the presence of C60, below a ratio of 4.7%, does not significantly influence the main transition behavior of the DPPC bilayer. However, the Tm of the DPPC bilayer decreases by about 2 K in the presence of 6.4% C60 under various pressures. In addition, the distribution properties of the DPPC molecules in the bilayer are discussed based on the radial distribution analyses and lateral density profiles to obtain further information of the effects of C60 on the DPPC bilayer.
2 Materials and methods
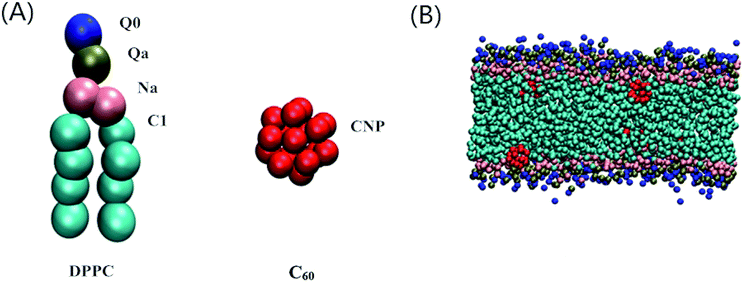
The Martini CG force field was employed in our dynamic simulations to study the effect of C60 on the main transition behavior and the relative distribution properties of the lipid bilayer under high pressure.35,36 The initial DPPC bilayer coordinate file was obtained using the bilayer formation program insane.py provided by Wassenaar’s group,37 and the C60 particle coordinate file was from a previous model.20 A particle free DPPC bilayer containing 264 lipids (132 lipids for each leaflet) and fully hydrated with 4130 CG water beads was placed in the simulation box with a dimension of 10 × 9 × 10 nm3. The C60–bilayer systems were generated by mixing the C60 in a fully hydrated DPPC bilayer simulation box. One, four, eight, twelve and sixteen C60 particle(s) were added to the bilayer, corresponding to the C60–DPPC ratios of 0.4%, 1.5%, 3.0%, 4.7% and 6.4%, respectively. The C60 particles were initially placed in the lipid tail regions to achieve an equilibrium state of the system as soon as possible. The CG models of a DPPC molecule, C60 particle and a snapshot of a DPPC bilayer with a number of C60 particles in an equilibrium state are shown in Fig. 1. All of the molecules in our CG-MD simulations were built up by various kinds of CG bead.All MD simulations started from the fluid phase state and the C60–DPPC bilayer systems were equilibrated at 325 K under ambient pressure for 3 μs. Then, the equilibrated patches under ambient pressure were coupled to higher pressures of 1, 300, 600, 1000 and 1500 bar, respectively, and equilibrated again for another 3 μs. The temperatures of the simulated equilibration at pressures lower than 300 bar were coupled to 325 K while the others were coupled to 370 K with an aim to obtain the fluid phase. The final equilibrated configurations corresponding to various higher pressures have been achieved for further simulations. All MD simulations were performed within the Gromacs 5.1.1 environment.38,39 Periodic boundary conditions were applied, and the constant temperature and pressure conditions were achieved using the Berendsen algorithm.40 The coupling constant of the temperature was 0.1 ps, while that of the pressure was 0.2 ps. We chose a semi-isotropic way for the pressure coupling to maintain a zero surface tension. Lennard-Jones (LJ) and electrostatic potentials were cut off at 1.1 nm. The time step of the simulations was fixed at 20 fs. Visual molecular dynamics (VMD) software,41 version 1.9.2, was employed for the final visualization of the simulation results.
3 Results and discussion
3.1 APL
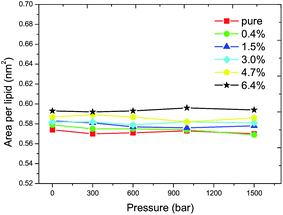
The APL is related to the tilt angle of the lipid tail and thus indicates the order of the acyl chain. The APL was calculated to investigate the progress of the main transition, as shown in Fig. 2. For the pure DPPC bilayer, a critical APL of 0.572 ± 0.002 nm2 is found at the liquid–gel phase transition boundary, for which a value of 0.57 nm2 has also been reported by Lai et al. through computer simulations for a pure DPPC membrane case.31 The critical APL increases with the increasing ratio of C60 and it reaches 0.594 ± 0.002 nm2 when the ratio of C60 increases to 6.4%. The results show that the incorporation of C60 in the DPPC bilayer increases the critical APL and an increment of 0.022 nm2 is observed at a ratio of 6.4%. This suggests that the transition from the fluid phase to the gel phase becomes more difficult to take place. The value of 0.58 nm2 was therefore used to determine whether the main transition has occurred or not in the following simulations, such that the Tms corresponding to various pressures can be obtained.3.2 Phase transition temperature
The Tms of the pure DPPC bilayer under various external pressures are shown in Fig. 3. One can observe that the Tm increases when the pure DPPC bilayer is coupled to higher external pressures. The maximum difference in Tm between this work and the reported data is within 1 K, indicating a good agreement with the previous work.31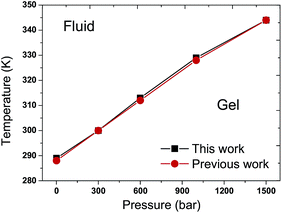 | ||
| Fig. 3 T–p phase diagram of the pure DPPC bilayer. The black filled squares and red filled circles represent the results of this work and a previous work,31 respectively. The Tm increases with the elevation of external pressure in the pure DPPC bilayer. The consistency between these two curves is noted. | ||
The main transition of the lipid bilayer at ambient pressure has been well studied by Marrink et al.43 The calculated phase diagram of the DPPC bilayer is shown in Fig. 4. The same Tm of 289 K was found for the DPPC bilayers when the ratios of C60 are below 4.7% at ambient pressure. A corresponding value of 288 K has been reported by Lai et al.31 and Ramalho et al.33 in a pure DPPC bilayer case. The 1 K shift of the Tm is probably caused by thermal fluctuations and the differences in the system size and simulation time. At a ratio of 6.4%, the Tm decreases by about 2 K. In all of the simulations, the Tm increases with an increase in the external pressure, exhibiting a nonlinear relationship between the temperature T and the pressure p, which qualitatively agrees with the experimental data.42 Our simulations show that the Tm of the DPPC bilayer will not be affected and the T–p phase diagram stays almost unchanged until the ratio of C60 increases to 6.4%. Also, the positive slope is controlled by the Clausius–Clapeyron equation and the deviation of the simulation result from the experimental data can be explained by the finite simulation time and the suppression of thermal undulations originating from periodic boundary conditions.31
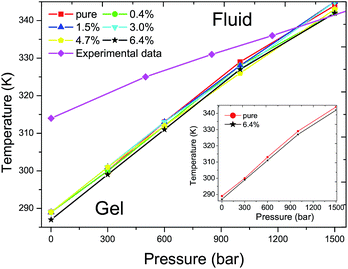 | ||
| Fig. 4 T–p phase diagram of DPPC bilayers with different ratios of C60 under various external pressures. The red filled squares, green filled circles, blue filled equilateral triangles, cyan filled inverted triangles, yellow regular pentagons and black pentagrams represent the Tms of DPPC bilayers with a ratio of C60 of 0%, 0.4%, 1.5%, 3%, 4.7% and 6.4%, respectively. The magenta filled rhombuses refer to experimental data of a pure DPPC bilayer.42 The Tm increases with the elevation of external pressure with the presence of C60 in all of the simulations, similar to the pure DPPC bilayer case. The addition of a new component C60, below a ratio of 4.7%, produces no significant impact on the Tm of the DPPC bilayer. However, the Tm decreases by approximately 2 K when the ratio of C60 increases to 6.4%, as shown in the inset figure. | ||
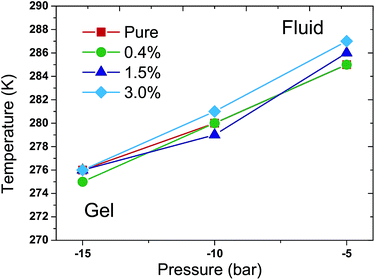
More simulations were performed to study the relationship between Tm and external pressures. In a semi-isotropic pressure coupling way, different negative pressures were applied in the lateral direction while ambient pressure was enforced in the perpendicular direction. The specific pressure settings were (1) −5 bar in the lateral direction and 1 bar in the perpendicular direction; (2) −10 bar in the lateral direction and 1 bar in the perpendicular direction; and (3) −15 bar in the lateral direction and 1 bar in the perpendicular direction. Again, the T–p phase diagram was obtained in such a semi-isotropic pressure coupling way, as shown in Fig. 5. The result also suggests that the Tm increases with the increase of pressure in the lateral direction in all of the simulations. The vast majority of the differences of the Tms for the various ratios of C60 and under different pressures are within 1 K compared with that of the pure DPPC bilayer. Accordingly, the Tm of the DPPC bilayer hardly changes in response to the presence of C60 in such a semi-isotropic coupling of pressure.
3.3 Radial distribution function g(r)
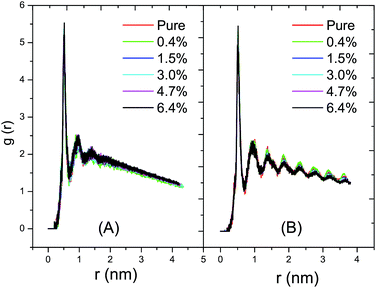
As shown in Fig. 6A, the radial distribution of the DPPC–DPPC molecules in the fluid phase at 325 K shows a long-range disordered distribution due to a disordered packing of the acyl chains in the fluid phase. In Fig. 6B, on the contrary, the radial distribution of the DPPC–DPPC molecules in the gel phase shows a long-range ordered distribution due to the ordered packing of the lipids in the gel phase. The various curves corresponding to the different ratios of C60 conform well to each other. Therefore, it can be concluded that the presence of C60 under a proportion of 6.4% does not disturb the radial distribution of the DPPC molecule in the lipid bilayer at ambient pressure. This probably can be explained by the limited amount of C60 present in the DPPC bilayer. The distortion of the lipid packing caused by the interaction between the C60 and DPPC molecules is too small to be observed in the radial distribution curves.3.4 Lateral density profile
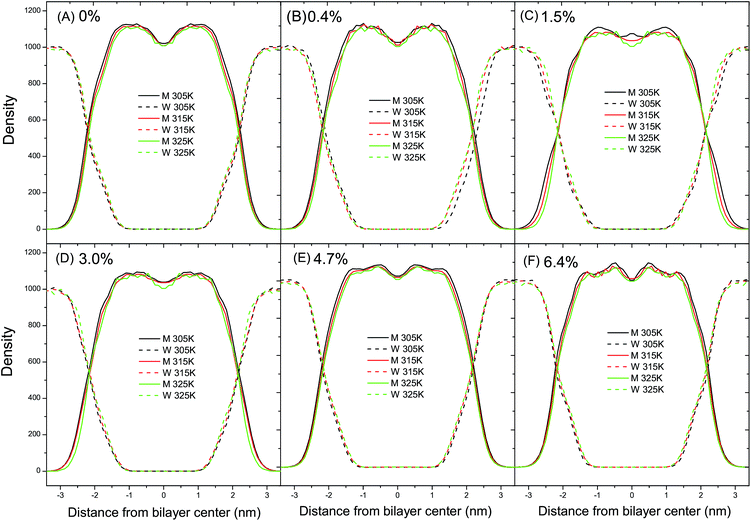
The lateral density profiles of a set of fluid DPPC bilayers at ambient pressure are shown in Fig. 7. The density curves of the DPPC bilayers and water intersect with each other at a distance of about 2.1 nm from the bilayer center. Moreover, the distance between the intersections of the DPPC bilayers and water can be used to estimate the thickness of the DPPC bilayer. In Fig. 7A and B, the distance between the intersections decreases with the increase of temperature, indicating that the thickness of the DPPC bilayer with relatively low ratios of C60 decreases with the temperature increase. The reduction in thickness can be explained by the bending and tilting of the acyl chains in the tail region with the temperature increase and therefore it can be concluded that the thickness of the DPPC bilayer is sensitive to temperature. However, in Fig. 7C–F, the distance between the intersections does not change with the increase of temperature, indicating that the thickness of the bilayer with a relatively high ratio of C60–DPPC remains constant regardless of the temperature variation. Therefore, the different thicknesses with the elevation of temperature with different ratios of C60 suggest that the presence of C60 with a relatively high ratio can alleviate the sensitivity of the bilayer thickness to temperature. In other words, the presence of C60 with a relatively high ratio can stabilize the thickness of the DPPC bilayer. This can be understood based on the fact that the flexibility of the lipid tail is suppressed by the presence of C60 through steric hindrance. Accordingly, when the temperature increases, the tilting and bending of the lipid tail would become harder to take place, resulting in a constant bilayer thickness. Also, in Fig. 7A, the valley in the bilayer center remains almost unchanged with the increase of temperature. On the other hand, however, in Fig. 7B–F the density of the DPPC molecules in the bilayer center decreases with the increase of temperature. Such a difference suggests that the presence of C60 can impose a local influence on the lateral distribution of the DPPC molecules.In the CG Martini force-field, the non-bonded interactions consist of LJ potential and Coulomb potential. The visual results with VMD showed that the interaction sites between C60 and the DPPC molecules locate in the CG beads C1 and Na, as shown in Fig. 1B. In the parameter setting of the CG Martini force-field, the parameters σij between C1–C1, C1–CNP, Na–Na, and Na–CNP of the LJ potential energy function are all 0.47 nm. However, another parameter εij between C1–CNP, C1–C1, Na–CNP, and Na–Na is 3.15 kJ mol−1, 3.5 kJ mol−1, 3.25 kJ mol−1 and 4.0 kJ mol−1, respectively. The interaction strength between C1–CNP and Na–CNP is weaker than that of C1–C1 and Na–Na, respectively. This suggests that the presence of C60 weakens the non-bonding interactions, which can lead to a decrease in Tm. However, it has been reported that the presence of C60 also decreases the lateral diffusion coefficient of the DPPC molecules.20 Our simulation also confirms a reduction of the lateral diffusion coefficient of the DPPC molecules with the addition of C60. The reduced interactions between the molecules and the mobility of the DPPC molecules are possible explanations as to why the critical temperature, Tm, remains almost constant when C60 particles, below ratios of 4.7%, are introduced into the DPPC bilayer. A proper theoretical model is required to further the understanding of this phenomenon. At a ratio of C60 of 6.4%, the presence of C60 decreases the Tm of the DPPC bilayer by about 2 K, which is consistent with the result of the critical APL analysis in Fig. 2.
4 Conclusions
In this study, CGMD simulations have been performed to investigate the effect of C60 and its amount on the main transition behavior and the distribution property of a DPPC bilayer at high pressure. The critical APL increases with the elevation of the amount of C60. A critical area per lipid of 0.594 ± 0.002 nm2 is obtained when the ratio of C60 reaches 6.4% while that of the pure bilayer case is 0.572 ± 0.002 nm2. Our simulation results show that the Tm increases with the increase of external pressure. When the C60–DPPC ratio is less than 4.7%, C60 particles exert no significant influence on the Tm of the DPPC bilayer. Also, the Tm decreases by about 2 K with a ratio of C60 of 6.4%. This suggests that the cytotoxicity of C60 is negligible from the point of view of the main transition when the ratio of C60 is less then 4.7%. Moreover, the T–p phase diagram of the DPPC bilayers with different ratios of C60 under various external pressures was obtained.The radial distribution function and the lateral density profiles suggest that the presence of C60 produces no impact on the radial distribution of the DPPC molecules in the lipid bilayers but imposes a local influence on the lateral distribution of the DPPC molecules. The presence of C60 with a relatively high ratio decreases the sensitivity of the bilayer thickness to temperature and thus stabilizes the thickness of the DPPC bilayer.
Conflicts of interest
There are no conflicts to declare.Acknowledgements
The authors acknowledge financial support from the National Natural Science Foundation of China (NSFC No. 61475196).References
- H. W. Kroto, J. R. Heath, S. C. O’Brien, R. F. Curl and R. E. Smalley, Nature, 1985, 318, 162–163 CrossRef CAS.
- J. Coro, M. Suárez, L. S. Silva, K. I. Eguiluz and G. R. Salazar-Banda, Int. J. Hydrogen Energy, 2016, 41, 17944–17959 CrossRef CAS.
- S. Z. Mousavi, S. Nafisi and H. I. Maibach, Nanomedicine, 2017, 13, 1071–1087 CrossRef CAS PubMed.
- I. Rasović, Mater. Sci. Technol., 2016, 33, 777–794 CrossRef.
- A. Kausar, Polym.-Plast. Technol. Eng., 2017, 56, 594–605 CrossRef CAS.
- K. Aschberger, H. J. Johnston, V. Stone, R. J. Aitken, C. L. Tran, S. M. Hankin, S. A. Peters and F. M. Christensen, Regul. Toxicol. Pharmacol., 2010, 58, 455–473 CrossRef CAS PubMed.
- S. H. Friedman, D. L. DeCamp, R. P. Sijbesma, G. Srdanov, F. Wudl and G. L. Kenyon, J. Am. Chem. Soc., 1993, 115, 6506–6509 CrossRef CAS.
- R. Sijbesma, G. Sdanovr, F. Wudl, J. A. Castoro, C. Wilkins, S. H. Friedman, D. L. Decamp and G. L. Kenyon, ChemInform, 1993, 115, 6510–6512 CAS.
- S. Bosi, T. D. Ros, G. Spalluto and M. Prato, Eur. J. Med. Chem., 2003, 38, 913–923 CrossRef CAS PubMed.
- G. L. Marcorin, T. D. Ros, S. Castellano, G. Stefancich, I. Bonin, S. Miertus and M. Prato, Org. Lett., 2000, 2, 3955–3958 CrossRef CAS PubMed.
- P. Krusic, E. Wasserman, P. Keizer, J. Morton and K. Preston, Science, 1991, 254, 1183–1185 CAS.
- R. Bakry, R. M. Vallant, M. Najam-ul Haq, M. Rainer, Z. Szabo, C. W. Huck and G. K. Bonn, Int. J. Nanomed., 2007, 2, 639–649 CAS.
- Z. Markovic and V. Trajkovic, Biomaterials, 2008, 29, 3561–3573 CrossRef CAS PubMed.
- T. Y. Zakharian, A. Seryshev, B. Sitharaman, B. E. Gilbert, V. Knight and L. J. Wilson, J. Am. Chem. Soc., 2005, 127, 12508–12509 CrossRef CAS PubMed.
- F. Lu, S. A. Haque, S.-T. Yang, P. G. Luo, L. Gu, A. Kitaygorodskiy, H. Li, S. Lacher and Y.-P. Sun, J. Phys. Chem. C, 2009, 113, 17768–17773 CAS.
- P. Chaudhuri, A. Paraskar, S. Soni, R. A. Mashelkar and S. Sengupta, ACS Nano, 2009, 3, 2505–2514 CrossRef CAS PubMed.
- Y. Tabata, Y. Murakami and Y. Ikada, Jpn. J. Cancer Res., 1997, 88, 1108–1116 CrossRef CAS PubMed.
- S. K. Sharma, Y. C. Long and M. R. Hamblin, Nanomedicine, 2011, 6, 1813–1825 CrossRef CAS PubMed.
- L. Li, H. Davande, D. Bedrov and G. D. Smith, J. Phys. Chem. B, 2007, 111, 4067–4072 CrossRef CAS PubMed.
- J. Wong-Ekkabut, S. Baoukina, W. Triampo, I.-M. Tang, D. P. Tieleman and L. Monticelli, Nat. Nanotechnol., 2008, 3, 363–368 CrossRef CAS PubMed.
- C. Chiu, W. Shinoda, R. H. Devane and S. O. Nielsen, Soft Matter, 2012, 8, 9610–9616 RSC.
- W. D. Tian, K. Chen and Y. Q. Ma, RSC Adv., 2014, 4, 30215–30220 RSC.
- N. Nisoh, M. Karttunen, L. Monticelli and J. Wongekkabut, RSC Adv., 2015, 5, 11676–11685 RSC.
- J. Zhou, D. Liang and S. Contera, Nanoscale, 2015, 7, 17102–17108 RSC.
- Y. K. Cherniavskyi, C. Ramseyer and S. O. Yesylevskyy, Phys. Chem. Chem. Phys., 2016, 18, 278–284 RSC.
- K. Jacobson and D. Papahadjopoulos, Biochemistry, 1975, 14, 152–161 CrossRef CAS PubMed.
- J. Barnoud, G. Rossi and L. Monticelli, Phys. Rev. Lett., 2014, 112, 290a CrossRef PubMed.
- A. Ikeda, K. Kiguchi, T. Shigematsu, K. Nobusawa, J.-i. Kikuchi and M. Akiyama, Chem. Commun., 2011, 47, 12095–12097 RSC.
- G. Rossi, J. Barnoud and L. Monticelli, Phys. Scr., 2013, 87, 058053–058062 CrossRef.
- S. J. Marrink, A. H. de Vries and D. P. Tieleman, Biochim. Biophys. Acta, Biomembr., 2009, 1788, 149–168 CrossRef CAS PubMed.
- K. Lai, B. Wang, Y. Zhang and Y. Zhang, Phys. Chem. Chem. Phys., 2012, 14, 5744–5752 RSC.
- R. Kociurzynski, M. Pannuzzo and R. A. Böckmann, Langmuir, 2015, 31, 9379–9387 CrossRef CAS PubMed.
- J. Prates Ramalho, P. Gkeka and L. Sarkisov, Langmuir, 2011, 27, 3723–3730 CrossRef CAS PubMed.
- R. M. Venable, B. R. Brooks and R. W. Pastor, J. Chem. Phys., 2000, 112, 4822–4832 CrossRef CAS.
- S. J. Marrink, H. J. Risselada, S. Yefimov, D. P. Tieleman and A. H. de Vries, J. Phys. Chem. B, 2007, 111, 7812–7824 CrossRef CAS PubMed.
- S. J. Marrink, A. H. D. Vries and A. E. Mark, J. Phys. Chem. B, 2004, 108, 750–760 CrossRef CAS.
- T. A. Wassenaar, H. I. Ingólfsson, R. A. Böckmann, D. P. Tieleman and S. J. Marrink, J. Chem. Theory Comput., 2015, 11, 2144–2155 CrossRef CAS PubMed.
- H. J. C. Berendsen, D. van der Spoel and R. van Drunen, Comput. Phys. Commun., 1995, 91, 43–56 CrossRef CAS.
- E. Lindahl, B. Hess and D. van der Spoel, J. Mol. Model., 2001, 7, 306–317 CrossRef CAS.
- H. J. C. Berendsen, J. P. M. Postma, W. F. V. Gunsteren, A. Dinola and J. R. Haak, J. Chem. Phys., 1984, 81, 3684–3690 CrossRef CAS.
- W. Humphrey, A. Dalke and K. Schulten, J. Mol. Graphics, 1996, 14, 33–38 CrossRef CAS PubMed.
- S. Potekhin, A. Senin, N. Abdurakhmanov and R. Khusainova, Biochim. Biophys. Acta, Biomembr., 2008, 1778, 2588–2593 CrossRef CAS PubMed.
- S. J. Marrink, J. Risselada and A. E. Mark, Chem. Phys. Lipids, 2005, 135, 223–244 CrossRef CAS PubMed.
| This journal is © The Royal Society of Chemistry 2018 |

