 Open Access Article
Mechanism in the existent difference in form of wogonin/wogonoside between plasma and intestine/liver in rats
Qian Wangad,
Rong Shia,
Yan Daia,
Yuanyuan Lia,
Tianming Wanga,
Yueming Ma *ab and
Nengneng Chengc
aDepartment of Pharmacology, School of Pharmacy, Shanghai University of Traditional Chinese Medicine, Shanghai 201203, People's Republic of China. E-mail: mayueming@shutcm.edu.cn; Fax: +86 21 5132 2386; Tel: +86 21 5132 2386
bShanghai Key Laboratory of Compound Chinese Medicines, Shanghai University of Traditional Chinese Medicine, Shanghai 201203, China
cDepartment of Pharmacology, School of Pharmacy, Fudan University, Shanghai 201203, China
dSchool of Pharmacy, Anhui University of Chinese Medicine, Anhui Academy of Chinese Medicine, Hefei 230012, China
First published on 16th January 2018
Abstract
Wogonin (WO) and its glucuronide, wogonoside (WG) exhibit various beneficial bioactivities that may have potential for the development of novel drugs. In this study, we determined their pharmacokinetic characteristics in rats after intragastric administration of WO and intraportal vein injection of WG. WG was the predominant form in the portal vein and body plasma, and in bile; WO was detected only in the small intestine and liver. WG is a substrate of the multidrug resistance-associated protein (MRP) 1, 2, 3, and 4, and organic anion-transporting polypeptide (OATP) 2B1 and OATP1B3. Metabolism studies indicated that WG formation and WO decrease had similar CLint values in rat intestine S9 (RIS9) and rat liver microsome (RLM), and that the hydrolysis rate of WG in RIS9 and rat liver S9 (RLS9) was fast. Thus, WG could be excreted into the intestinal tract by MRP2, and transported into mesenteric blood by MRP1, 3, and 4. OATP2B1 and OATP1B3 mediated the hepatic uptake of WG and MRPs mediated WG efflux to the bile and circulation. The high transport capability of MRPs for WG and the fast hydrolysis in the small intestine and liver may be responsible for the presence of WO in these tissues.
Introduction
Wogonin (WO), and its glucuronide, wogonoside (wogonin-7-glucuronide; WG) (Fig. 1) are the main active flavonoids in Radix Scutellariae (RS),1 one of the most famous herbal medicines in China. They exhibit various beneficial bioactivities, such as anti-inflammatory,2 antioxidant,3 anti-cancer,4 nervous system protective,5 cardiovascular system protective,6 and liver protective effects,7 as well as effectiveness in reducing multidrug resistance.8 WO is currently being developed as a therapeutic for type B hepatitis.9Pharmacokinetics provides information essential for drug development and safety. Systemic exposure of WG is significantly higher than that of its aglycone, WO, after oral administration.10,11 However, the concentration of WO is higher than that of its conjugates in liver, its main target organ, after oral administration of RS extract.12 This suggests that WO concentrates in the liver despite its systemic exposure being lower than that of WG. These results show that the exposure forms of WO/WG in plasma and in liver are different, but the underlying mechanism for this difference is not clear.
The pharmacokinetic characteristics of a drug are closely related to the mechanism of in vivo disposition, including absorption, distribution, metabolism, and excretion, which are all influenced by drug transport. WO shows good liposolubility, and, hence, can cross the epithelial cell membrane of the small intestine via passive diffusion.13 WG cannot be absorbed directly via this route, and is thus hydrolyzed into its aglycone form by intestinal bacteria.14 WO demonstrates phase II metabolism, including glucuronidation and sulfation in the intestines and liver. The formation of WG is mainly catalyzed by UDP-glucuronosyltransferase (UGT) 1A8, 1A9, and 1A3.15 Transport via specific transporters also plays an important role in drug disposition in vivo. Many flavonoids are transported to the liver by organic anion-transporting polypeptides (OATPs), breast cancer-resistance protein (BCRP), and multidrug resistance-associated protein (MRP).16,17 It has been reported that WG is the substrate of MRP2 in the MRP-MDCK cell model.13 However, these research results cannot explain the mechanism of different exposure forms of WO/WG in plasma and in tissues, the understanding of which is important for further research and development of their therapeutic uses.
In the present study, we determined the in vivo pharmacokinetic characteristics of WO and WG in rats, and assessed their metabolism and transport in vitro to find the mechanism underlying their pharmacokinetic features.
Materials and methods
Chemicals and reagents
WO and WG were purchased from Chengdu Pufei De Biotech Co., Ltd. (Chendu, China). Ononin was purchased from the Chinese Institute for the Control of Pharmaceutical and Biological Products (Beijing, China). The purities of all reference compounds were >98% according to HPLC. Uridine 5′-diphosphoglucuronic acid (UDPGA), β-glucuronidase, sulfatase, D-saccharic acid 1,4-lactone monohydrate (DGA), and alamethicin were purchased from Sigma-Aldrich (St. Louis, MO, USA). BCA protein assay kit was purchased from Beyotime Biotechnology (Shanghai, China).Chromatographic-grade acetonitrile and methanol were purchased from Burdick & Jackson Company (Ulsan, Korea). Formic acid (HPLC grade, purity ≥99.7%) and acetic acid (HPLC grade, purity ≥99.7%) were purchased from Tedia, Co. (Fairfield, OH, USA). Deionized water was purified using a Milli-Q® system (Millipore, Bedford, MA, USA).
Cells
OATP1B1-, OATP2B1-, and OATP1B3-expressing human embryonic kidney 293 (HEK293) cell lines were provided by Dr Xiaoyan Chen from the Shanghai Institute of Materia Medica, Chinese Academy of Sciences (Shanghai, China). Multidrug resistance (MDR) 1-expressing Madin–Darby canine kidney (MDCKII) cell lines were provided by Dr Min Huang from School of Pharmaceutical Science, Sun Yat-sen University (Guangzhou, China). BCRP-MDCKII cell lines were provided by Dr Xiaodong Liu from Center of Drug Metabolism and Pharmacokinetic, China Pharmaceutical University (Nanjing, China). Organic anion transporter (OAT) 2-expressing HEK293 cell lines were obtained from Shanghai Genechem Co., Ltd. (Shanghai, China). Sf9 insect cell membrane vesicles expressing MRP1, MRP2, and MRP3 and the vesicle assay kit were purchased from Corning (Corning, NY, USA). Inside-out Sf9 insect cell membrane vesicles expressing MRP4 were purchased from GenoMembrane (Yokohama, Japan). Rat liver microsomes (RLMs) were purchased from the Research Institute for Liver Diseases Co., Ltd. (Shanghai, China). Pooled rat intestinal S9 (RIS9) and rat liver S9 (RLS9) were prepared from several rats by the Pharmacokinetics Laboratory of the Shanghai University of Traditional Chinese Medicine (Shanghai, China).Animals
Totally 30 Sprague-Dawley rats (260 ± 10 g, male) were obtained from the Animal Center of Shanghai University of Traditional Chinese Medicine (Approval number: 2015007). The rats were bred in a breeding room with a temperature of 23 ± 2 °C, humidity of 60 ± 5%, and 12 h dark–light cycle. They were provided water, fed a normal diet, and were acclimatized to the facilities for 1 week before initiating experiments. The rats were fasted for 12 h before experimentation, and had access to water ad libitum. The animal studies were conducted according to the Institutional Guide for the Care and Use of Laboratory Animals and were approved by the Institutional Committee of Shanghai University of Traditional Chinese Medicine (TCM).In vivo rat studies
The rats were anesthetized with an intraperitoneal injection of urethane before surgery. The hepatic portal vein and bile duct were cannulated with polyethylene tubing (0.4 mm ID, 0.8 mm OD) for intraportal vein (ipv) dosing and sample collection, respectively. The portal vein blood samples and total body blood samples were collected from the hepatic portal vein and abdominal aorta, respectively, using a syringe. During surgery, the body temperature was maintained at 37 °C using a heating lamp. There were 3 rats in every group at each observing time.![[thin space (1/6-em)]](https://www.rsc.org/images/entities/char_2009.gif) 000 × g for 10 min to determine the plasma concentrations of WO and WG. An aliquot of 50 μL of plasma was hydrolyzed with 50 μL glucuronidase/sulfatase (4000 U mL−1, dissolved in 100 mM Tris–HCl, pH = 5) containing 5 μL of 20% ascorbic acid at 37 °C for 2 h. After hydrolysis, the sample was extracted with acetonitrile as described above to determine the plasma concentration of total WO. The small intestine and liver homogenates and bile samples were prepared using the same protocol as described for the plasma samples. The amount of glucuronide/sulfate was estimated by the difference between the amount of WO in the sample before and after glucuronidase/sulfatase hydrolysis.
000 × g for 10 min to determine the plasma concentrations of WO and WG. An aliquot of 50 μL of plasma was hydrolyzed with 50 μL glucuronidase/sulfatase (4000 U mL−1, dissolved in 100 mM Tris–HCl, pH = 5) containing 5 μL of 20% ascorbic acid at 37 °C for 2 h. After hydrolysis, the sample was extracted with acetonitrile as described above to determine the plasma concentration of total WO. The small intestine and liver homogenates and bile samples were prepared using the same protocol as described for the plasma samples. The amount of glucuronide/sulfate was estimated by the difference between the amount of WO in the sample before and after glucuronidase/sulfatase hydrolysis.In vitro transporter studies
![[thin space (1/6-em)]](https://www.rsc.org/images/entities/char_2009.gif) P) was calculated using ADMET Predictor 5.5 software (Simulations Plus, Lancaster, Canada) to predict the membrane permeability of WO and WG. The permeability of WO was assessed based on the apparent permeability coefficient (Papp) of monodirectional penetration in MDCKII cell monolayers.
P) was calculated using ADMET Predictor 5.5 software (Simulations Plus, Lancaster, Canada) to predict the membrane permeability of WO and WG. The permeability of WO was assessed based on the apparent permeability coefficient (Papp) of monodirectional penetration in MDCKII cell monolayers.The bidirectional permeability of WG in MDR1- and BCRP-MDCKII cell monolayers was used to determine whether WG was a substrate of MDR1 and BCRP. MDCKII and BCRP-MDCKII cells were cultured in Dulbecco's modified Eagle's medium (Corning) supplemented with 10% fetal bovine serum, 2 mM L-glutamine, 1% modified Eagle's medium nonessential amino acids (Gibco), 100 U mL−1 penicillin, and 100 g mL−1 streptomycin (Gibco). The cultures were maintained in a humidified atmosphere containing 5% CO2 at 37 °C. The cells were split at a 1![[thin space (1/6-em)]](https://www.rsc.org/images/entities/char_2009.gif) :
:![[thin space (1/6-em)]](https://www.rsc.org/images/entities/char_2009.gif) 3 ratio every 3–4 days. Cells were seeded into 24-well Transwell inserts (0.33 cm2) (Corning) at a density of 1 × 10⁵ cells per well, and were grown for a minimum of 5 days. The medium was changed every 2 days. Prior to the assay, the integrity of the cell monolayer was verified by measuring the transepithelial electrical resistance (>700 Ω). The cell monolayers were washed twice with warm Hank's balanced salt solution (HBSS) and equilibrated with HBSS for 30 min at 37 °C. The donor solution was placed in the apical chamber (A, 0.3 mL) or basolateral chamber (B, 0.6 mL), and blank HBSS was added to the opposite chamber. Samples (0.1 mL) were collected from the receiver side at different times and an equal volume of blank HBSS was immediately added to replenish the volume. The concentration of WO and WG in the donor solution was 5 μM.
3 ratio every 3–4 days. Cells were seeded into 24-well Transwell inserts (0.33 cm2) (Corning) at a density of 1 × 10⁵ cells per well, and were grown for a minimum of 5 days. The medium was changed every 2 days. Prior to the assay, the integrity of the cell monolayer was verified by measuring the transepithelial electrical resistance (>700 Ω). The cell monolayers were washed twice with warm Hank's balanced salt solution (HBSS) and equilibrated with HBSS for 30 min at 37 °C. The donor solution was placed in the apical chamber (A, 0.3 mL) or basolateral chamber (B, 0.6 mL), and blank HBSS was added to the opposite chamber. Samples (0.1 mL) were collected from the receiver side at different times and an equal volume of blank HBSS was immediately added to replenish the volume. The concentration of WO and WG in the donor solution was 5 μM.
![[thin space (1/6-em)]](https://www.rsc.org/images/entities/char_2009.gif) :
:![[thin space (1/6-em)]](https://www.rsc.org/images/entities/char_2009.gif) 3 ratio every 3–4 days. Transfected HEK293 and mock control cells were seeded on BioCoat poly-D-lysine-coated 24-well plates (BD Biosciences) at a density of 5.0 × 10⁵ cells per well. After 36 h of culture, the cells were washed twice and equilibrated in HBSS for 10 min. The uptake was initiated by adding 0.5 mL of HBSS containing WG and was terminated at the designated time by aspirating the medium and washing the cells twice with 2 mL of ice-cold HBSS. The cells were subsequently lysed after three freeze/thaw cycles (−80 to 25 °C) and the proteins were precipitated using acetonitrile. Total cellular protein levels were measured using a BCA protein assay kit. Uptake studies of WG were performed at a concentration of 2 μM at 37 °C for 5, 10, and 30 min in the time-dependent experiment. The concentration of WG was 0.1–1000 μM in the concentration-dependent experiment.
3 ratio every 3–4 days. Transfected HEK293 and mock control cells were seeded on BioCoat poly-D-lysine-coated 24-well plates (BD Biosciences) at a density of 5.0 × 10⁵ cells per well. After 36 h of culture, the cells were washed twice and equilibrated in HBSS for 10 min. The uptake was initiated by adding 0.5 mL of HBSS containing WG and was terminated at the designated time by aspirating the medium and washing the cells twice with 2 mL of ice-cold HBSS. The cells were subsequently lysed after three freeze/thaw cycles (−80 to 25 °C) and the proteins were precipitated using acetonitrile. Total cellular protein levels were measured using a BCA protein assay kit. Uptake studies of WG were performed at a concentration of 2 μM at 37 °C for 5, 10, and 30 min in the time-dependent experiment. The concentration of WG was 0.1–1000 μM in the concentration-dependent experiment.In vitro metabolism studies
![[thin space (1/6-em)]](https://www.rsc.org/images/entities/char_2009.gif) 000 × g for 10 min.
000 × g for 10 min.![[thin space (1/6-em)]](https://www.rsc.org/images/entities/char_2009.gif) 000 × g for 10 min.
000 × g for 10 min.Bioanalysis of WO and WG
A validated liquid chromatography/tandem mass spectrometry- (LC/MS/MS) based method was used to quantify WO and WG in the samples. The LC-MS/MS system included a Shimazu HPLC system (Shimazu, Japan) and a Thermo TSQ system (Thermo Fisher Scientific, Waltham, MA, USA). The column used was a Thermo Hypersil gold (2.1 × 100 mm, 3 μm) and the temperature was maintained at 35 °C. A gradient elution with two mobile phases was used: 0.05% formic acid (mobile phase A) and acetonitrile (mobile phase B). The gradient elution procedure was as follows: 0–1.5 min at 45–60% B, 1.5–2.5 min at 60–90% B, 2.5–4 min at 90% B, and 4.1–6 min at 45% B. The flow rate was 0.20 mL min−1 and the injection volume was 5 μL. The MS instrument was further equipped with an electrospray ionization (ESI) source operating in positive mode. Quantification was performed using multiple-reaction monitoring of the transitions from m/z 461.136 to 270.190 for WG, m/z 285.067 to 270.100 for WO, and m/z 430.990 to 369.000 for ononin as the internal standard (IS). The working parameters for the MS were set as follows: ion spray voltage, 3000 kV (+); sheath gas pressure, 40 psi; aux gas pressure, 10 psi; and capillary temperature, 300 °C. All calibration curves showed good linearity (r > 0.9915). The limit of quantification (LOQ) of WO and WG were 0.36 and 2.76 nmol L−1. The accuracy of the intra- and inter-day variation of the investigated compounds was 95.81–107.20% and the precision values were less than 3.17%. The method used met the requirements for the quantitation of biological samples. The calculating equation of wogonin sulfate (WS) was WS = WO (after glucuronidase/sulfatase hydrolysis) − WO (before glucuronidase/sulfatase hydrolysis) − WG.Data analysis
The pharmacokinetic parameters were estimated using the WinNonlin program (Pharsight, Mountain View, CA, USA) with a non-compartmental approach. The main kinetic parameters of metabolism and uptake transport were calculated with GraphPad Prism 5 (GraphPad Software, Inc., San Diego, CA, USA) using a typical Michaelis–Menten equation V = Vmax/(1 + Km/S), where V is the uptake velocity of the substrate, S is the concentration of the substrate in the medium, Vmax represents the maximal velocity, and Km is the substrate concentration when the velocity is half the Vmax. The apparent permeability coefficient Papp values across the cell monolayers were calculated using the following equation: Papp = dQ/(dt × A × C0), where dQ/dt is the flux of compound across the monolayer, A is the surface area of the cell monolayer, and C0 is the initial concentration in the donor chamber. PappA–B is the Papp value measured in the A to B direction and PappB–A is the Papp value measured in the B to A direction. The efflux ratio (ER) was calculated as: efflux ratio = PappB–A/PappA–B. Statistically significant differences between two or more groups were determined using Student's t-test or one-way ANOVA, respectively, using PASW Statistics 18.0 (PASW Statistics/SPSS, Hong Kong, China). Differences at p < 0.05 were considered significant for all tests.Results
In vivo rat studies
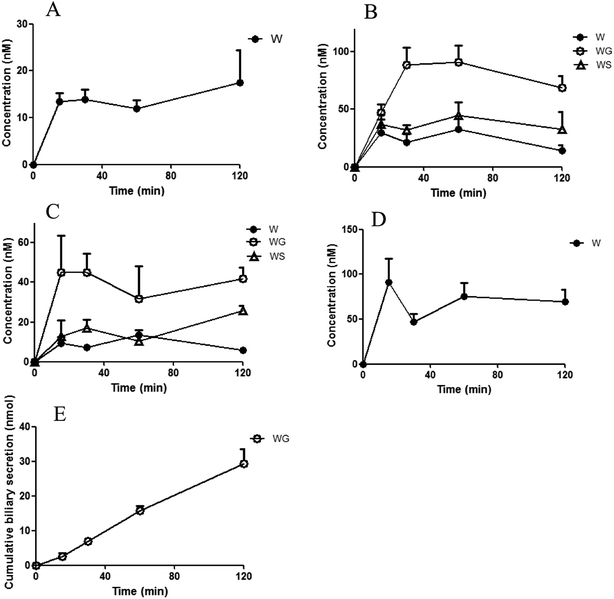
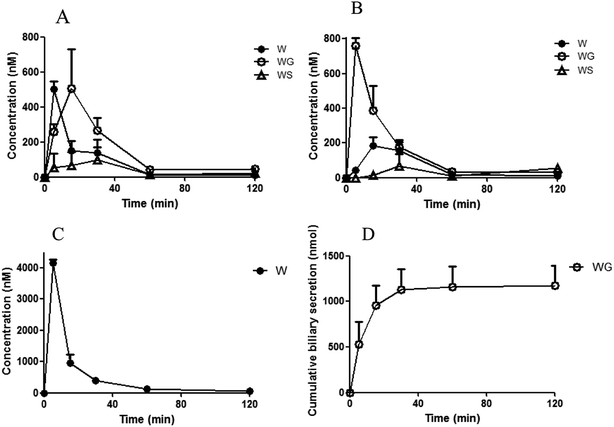
The concentrations of the aglycones and their glucuronides/sulfates after ig administration and ipv administration are shown in Fig. 2 and 3. The corresponding area under the curve (AUC) and cumulative biliary secretion values are listed in Table 1.| ig administration | ipv administration | ||||||||
|---|---|---|---|---|---|---|---|---|---|
| AUC (h nM) | Biliary secretion (nmol) | AUC (h nM) | Biliary secretion (nmol) | ||||||
| Intestine | Portal plasma | Body plasma | Liver | Portal plasma | Body plasma | Liver | |||
| a WO, wogonin. WG, wogonoside; WS, wogonin sulfate; total WO, WO + WG + WS; N.A., not available. One gram of the intestine and liver tissue was assumed to be 1 mL. | |||||||||
| WO | 26 | 47 | 18 | 132 | N.A. | 160 | 124 | 1080 | N.A. |
| WG | N.A. | 148 | 73 | N.A. | 29 | 294 | 282 | N.A. | 1172 |
| WS | N.A. | 71 | 30 | N.A. | N.A. | 79 | 65 | N.A. | N.A. |
| Total WO | 26 | 266 | 121 | 132 | 29 | 533 | 471 | 1080 | 1172 |
After ig administration of WO, WG was found primarily in the portal vein and body plasma. The concentrations of the aglycone WO and WS were lower than WG was in plasma. WO was detected without its metabolites in the intestine and liver. The AUC of WO in liver was about 7-fold that in body plasma. WG was excreted without detectable aglycones in the bile.
After ipv administration of WG, the pharmacokinetic characteristics of WO/WG were similar to that after ig administration. WG, WS, and WO were detected in the portal vein and body plasma. Only aglycone WO was detected in the liver, and the AUC of WO in the liver was about 9-fold that in body plasma. WG was excreted in the bile without detectable aglycones.
MDR1-MDCKII and BCRP-MDCKII cell monolayer studies
The ERs of rhodamine 123 (a typical substrate of MDR1) in MDR1-MDCKII cells and cimetidine (a typical substrate of BCRP) in BCRP-MDCKII cells were 3.3- and 7.3-fold that of control cells, respectively. However, the ER of WG was not significantly different between transfected cells and control cells (Tables 2 and 3).| Time | MDR1 | Control | |||||
|---|---|---|---|---|---|---|---|
| Papp × 10−6 (cm s−1) | Efflux ratio | Papp × 10−6 (cm s−1) | Efflux ratio | ||||
| A–B | B–A | B–A/A–B | A–B | B–A | B–A/A–B | ||
| a A–B: apical-to-basolateral; B–A: basolateral-to-apical; Rho123: rhodamine 123. | |||||||
| WG | 1 h | 1.81 ± 0.10 | 1.57 ± 0.42 | 0.87 ± 0.23 | 1.00 ± 0.20 | 1.25 ± 0.30 | 1.34 ± 0.61 |
| 2 h | 0.93 ± 0.13 | 1.52 ± 0.57 | 1.60 ± 0.40 | 0.88 ± 0.11 | 1.06 ± 0.18 | 1.22 ± 0.31 | |
| Rho123 | 1 h | 1.31 ± 0.32 | 7.91 ± 1.76 | 6.27 ± 1.90 | 0.68 ± 0.13 | 1.27 ± 0.20 | 1.85 ± 0.08 |
| 2 h | 1.32 ± 0.28 | 9.34 ± 0.28 | 7.05 ± 0.07 | 0.62 ± 0.12 | 1.29 ± 0.22 | 2.13 ± 0.58 | |
| Time | BCRP | Control | |||||
|---|---|---|---|---|---|---|---|
| Papp × 10−6 (cm s−1) | Efflux ratio | Papp × 10−6 (cm s−1) | Efflux ratio | ||||
| A–B | B–A | B–A/A–B | A–B | B–A | B–A/A–B | ||
| a A–B: apical-to-basolateral; B–A: basolateral-to-apical; CT: cimetidine. | |||||||
| WG | 1 h | 2.39 ± 0.04 | 2.49 ± 0.37 | 1.04 ± 0.17 | 2.33 ± 0.16 | 1.93 ± 0.16 | 0.84 ± 0.11 |
| 2 h | 1.73 ± 0.23 | 1.89 ± 0.24 | 1.09 ± 0.14 | 1.39 ± 0.14 | 1.12 ± 0.03 | 0.80 ± 0.10 | |
| CT | 1 h | 1.33 ± 0.07 | 7.33 ± 0.98 | 6.52 ± 1.21 | 0.75 ± 0.22 | 0.79 ± 0.27 | 1.06 ± 0.35 |
| 2 h | 0.98 ± 0.23 | 7.48 ± 0.57 | 7.47 ± 1.28 | 0.55 ± 0.10 | 0.62 ± 0.06 | 1.01 ± 0.13 | |
Efflux transporter vesicle studies
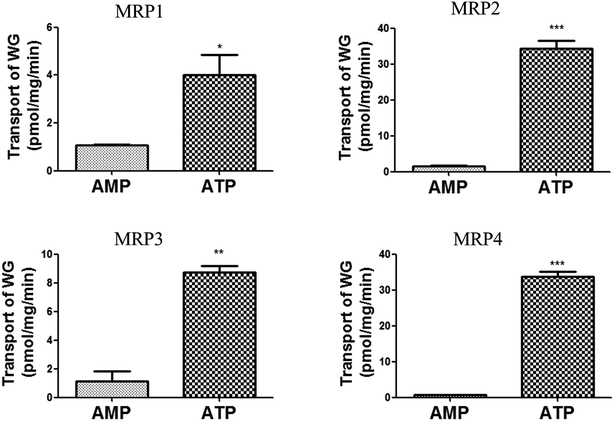
Efflux transporter studies were conducted by measuring the transport of WG into MRP1-, MRP2-, MRP3-, and MRP4-expressing membrane vesicles to determine whether WG was a substrate of MRP transporters. As shown in Fig. 4, a significant transport of WG by all four MRP vesicles was observed in the presence of ATP compared with that in the presence of AMP. The transport of WG by MRP2 and MRP4 vesicles was higher than that by MRP1 and MRP3 vesicles.Uptake transporter studies
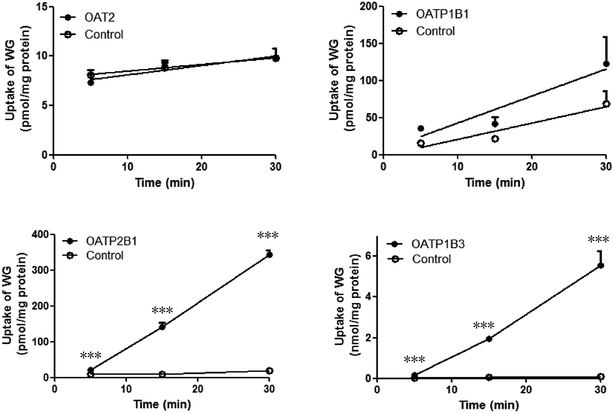
The time-dependent uptakes are shown in Fig. 5. No significant difference was observed between the uptake of WG by OAT2- and OATP1B1-HEK293 cells and that by the vector control cells. However, the uptake of WG by OATP2B1- and OATP1B3-HEK293 cells was significantly higher than that by vector control cells at 37 °C (Fig. 5). The uptake kinetics of WG fit the Michaelis–Menten model (Fig. 6 and Table 4). WG exhibited a higher affinity and uptake capacity for OATP1B3 than for OATP2B1.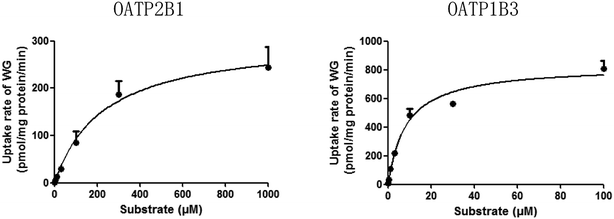 | ||
| Fig. 6 Uptake kinetic curves of wogonoside (WG) by OATP2B1 and OATP1B3 (mean ± S.D., n = 3). OATP, organic anion-transporting polypeptide. | ||
| OATP2B1 | OATP1B3 | |
|---|---|---|
| a ***p < 0.001 versus OATP2B1. | ||
| Km (μM) | 227.2 ± 42.8 | 8.4 ± 1.9*** |
| Vmax (pmol per mg protein per min) | 305.3 ± 20.6 | 826.9 ± 53.1 |
Glucuronidation by RIS9 and RLMs
Both the formation of WG and the decrease in the aglycone WO were calculated to determine the degree of glucuronidation. WO was rapidly biotransformed into its glucuronide metabolite after 10 min of incubation with RIS9 and RLMs. The kinetic curves fit the Michaelis–Menten equation (Fig. 7). As shown in Table 5, the amount of WG formed and WO metabolized were nearly equal for each substrate concentration, showing approximate CLint (Vmax/Km) values. 95% confidence intervals calculation result shown that there was no significant difference between Km and Vmax values in formation of WG (25.54–40.03 and 4.94–5.73 for RIS9, 33.40–56.03 and 14.89–17.91 for RLMs) and decrease of WO (32.75–51.34 and 5.53–6.49 for RIS9, 37.78–61.84 and 16.61–19.94 for RLMs) in two systems. These indicated that WG was the predominant glucuronide metabolite of WO.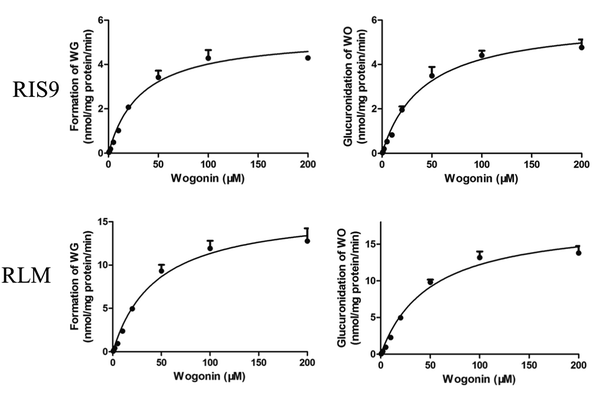 | ||
| Fig. 7 Kinetic curves of formation of wogonoside and glucuronidation of wogonin in RIS9 and RLMs (mean ± S.D., n = 3). WG, wogonoside; WO, wogonin; RIS9, rat intestine S9; RLMs, rat liver microsomes. | ||
| RIS9 | RLMs | |||||
|---|---|---|---|---|---|---|
| Km, μM | Vmax, pmol mg−1 min−1 | CLint, μL min−1 mg−1 | Km, μM | Vmax, pmol mg−1 min−1 | CLint, μL min−1 mg−1 | |
| Formation of WG | 32.8 ± 3.5 | 5.3 ± 0.2 | 161.6 | 44.7 ± 5.5 | 16.4 ± 0.7 | 366.9 |
| Decrease of WO | 42.0 ± 4.5 | 6.0 ± 0.2 | 142.8 | 49.8 ± 5.8 | 18.3 ± 0.8 | 367.5 |
In vitro hydrolysis study of WG
Hydrolysis curves of WG are shown in Fig. 8. The t1/2 of the hydrolysis of WG in RIS9 and RLS9 were 5.88 ± 1.25 and 6.36 ± 3.02 min, respectively. These findings indicated that WG was rapidly and readily hydrolyzed in the small intestine and liver.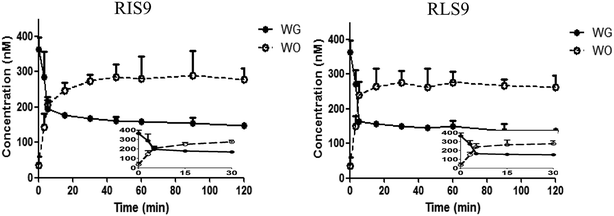 | ||
| Fig. 8 Hydrolysis curves of wogonoside (WG) by RIS9 and RLS9 (mean ± S.D., n = 3). WO, wogonin; RIS9, rat intestine S9; RLS9, rat liver S9. | ||
Discussion
There have been reports that flavonoid glycosides are absorbed after release of the glycosyl moiety by hydrolysis in the intestinal tract,18 WO is rapidly converted into its glucuronide WG in the small intestine,12 and WG are predominantly present in the portal vein.13 On the basis of these results, in the present study, WO was given to rats via ig administration and WG was given to rats via ipv injection to determine the pharmacokinetic characteristics of WO/WG. The dosage was chosen in comparison with the content of these flavones in RS. The results showed that the glucuronide conjugate, WG, was the main form in the portal vein and body plasma, while only WG was found in the bile and only aglycone WO was found in the small intestine and liver. The AUC of WO in the liver was significantly higher than that in the body plasma. These results more clearly revealed the exposure form difference of WO/WG between plasma and liver. In order to clarify underlying mechanism of these pharmacokinetic characteristics we produced a series of metabolism and transport experiments in vitro.First, the glucuronidation of WO was very fast, and there was a similar CLint between the formation of WG and the decrease in WO in RIS9 and RLM, which implies that WO was quickly metabolized into WG, the only glucuronide metabolite of WO in the small intestine and liver. Because of the low lipophilicity (log![[thin space (1/6-em)]](https://www.rsc.org/images/entities/char_2009.gif) P = 0.51) and low permeability, the movement of WG should be mediated by transporter. Second, in efflux transporter experiments, WG was not a substrate of MDR1 and BCRP. However, WG was a substrate of all four MRPs, with MRP2 and MRP4 exhibiting stronger transport ability. This indicated that the WG formed in enterocytes can be largely excreted into the intestinal tract by MRP2, the most important efflux transporter expressed on the apical side of the intestinal mucosa, but a small amount can be transported into mesenteric blood by MRP1, 3, and 4 expressed on the basolateral side of the intestinal mucosa to enter the portal vein. Furthermore, we found that WG was a substrate of OATP2B1 and OATP1B3. Therefore, WG in the portal vein could be transported into the liver by OATP2B1 and OATP1B3. Moreover, WG in hepatocytes can be largely excreted into the bile by MRP2, the most important efflux transporter expressed on the canaliculus side of hepatocytes, with a small amount also transported into the system blood by MRP1, 3, and 4 expressed on the blood sinus side of hepatocytes. In addition, a small number of WO can pass through enterocytes and hepatocytes by passive diffusion and enter the portal vein and body blood. The above results clarify the reason that WG is the main form found in the portal vein and body plasma. Finally, in the hydrolysis experiment, the results showed that WG had a fast hydrolysis rate in RIS9 and RLS9, which explained that WG was very quickly hydrolyzed into WO in the small intestine and liver in addition to the efflux by MRPs. Both of these results clarify the reason why only WO was detected in the small intestine and liver.
P = 0.51) and low permeability, the movement of WG should be mediated by transporter. Second, in efflux transporter experiments, WG was not a substrate of MDR1 and BCRP. However, WG was a substrate of all four MRPs, with MRP2 and MRP4 exhibiting stronger transport ability. This indicated that the WG formed in enterocytes can be largely excreted into the intestinal tract by MRP2, the most important efflux transporter expressed on the apical side of the intestinal mucosa, but a small amount can be transported into mesenteric blood by MRP1, 3, and 4 expressed on the basolateral side of the intestinal mucosa to enter the portal vein. Furthermore, we found that WG was a substrate of OATP2B1 and OATP1B3. Therefore, WG in the portal vein could be transported into the liver by OATP2B1 and OATP1B3. Moreover, WG in hepatocytes can be largely excreted into the bile by MRP2, the most important efflux transporter expressed on the canaliculus side of hepatocytes, with a small amount also transported into the system blood by MRP1, 3, and 4 expressed on the blood sinus side of hepatocytes. In addition, a small number of WO can pass through enterocytes and hepatocytes by passive diffusion and enter the portal vein and body blood. The above results clarify the reason that WG is the main form found in the portal vein and body plasma. Finally, in the hydrolysis experiment, the results showed that WG had a fast hydrolysis rate in RIS9 and RLS9, which explained that WG was very quickly hydrolyzed into WO in the small intestine and liver in addition to the efflux by MRPs. Both of these results clarify the reason why only WO was detected in the small intestine and liver.
In a previous study, MRP2 was considered to be involved in the intestinal efflux of WG based on decreased excretive transport of WG after MRP inhibition in Caco-2 cells, and the increased apical accumulation and apparent permeability coefficient of WG during its basolateral to apical transport in MDCK-MRP2 cells.13 However, there was insufficient evidence that WG was an MRP2 substrate because the ER ratio, which is indicative of MRP-mediated efflux at a value of 1.5,19 was not determined in this study. In the present study, inside-out Sf9 insect cell membrane vesicles not only provided a more reliable indication of WG efflux mediated by MRP2, but also showed that WG was a substrate of MRP1, 3, and 4. Further, we found that WG was a substrate of OATP1B3 and OATP2B1, but not a substrate of OAT2.
The results of the present study may provide valuable information for future research and development of WO and WG. The concentrations and exposure forms of WO/WG in tissues were determined by analyzing OATP2B1, OATP1B3, MRPs, and β-glucuronidase in the corresponding tissues. Therefore, it is warranted to choose suitable compounds to study their effects in pharmacodynamic models in vitro. For example, because WO and WG can enter hepatocytes via passive diffusion or active transport, where they can be mutually transformed by UGT and β-glucuronidase, respectively, WO and WG can be used to study the pharmacodynamics of liver therapeutics in vitro. However, whether WO or WG can be used to study effects in other tissues should be verified by transporters expressed in the corresponding cells or tissues in vitro to be consistent with the effects in vivo. Currently, there are pharmacodynamic studies of WO and WG ongoing to examine their liver protection, brain protection, and anti-cancer effects.20–22 Our studies are significant to the research of WO and WG in these target organs and cells. In addition, the present results indicate that we should pay attention to the potential drug–drug interactions between WO/WG, as well as traditional Chinese medicines containing WO/WG, and co-combination inhibitors of OATPs or MRPs.
Conclusion
In summary, the uptake of WG into the liver was mediated by OATP2B1 and OATP1B3. WG is a substrate of MRPs, which mediate the excretion of WG into the intestinal tract, blood, and bile. This explains why WG was the predominant form in portal vein, body plasma, and bile. Moreover, this study showed fast hydrolysis of WG in the small intestine and liver, which, in addition to the efflux of WG by MRPs, is the reason that only WO was detected in these tissues.Conflicts of interest
The authors have declared that there is no conflict of interest.Abbreviations
| WO | Wogonin |
| WG | Wogonoside |
| RS | Radix Scutellariae |
| WS | Wogonin sulfate |
| UGTs | UDP-glucuronosyltranferase |
| MDCK | Madin–Darby canine kidney cell line |
| LC-MS/MS | High performance liquid chromatograph/tandem mass spectrometry |
| IS | Internal standard |
| HBSS | Hank's balanced salt solution |
| UDPGA | Uridine diphosphate glucuronic acid |
log![[thin space (1/6-em)]](https://www.rsc.org/images/entities/char_2009.gif) P P | Oil–water partition coefficient |
| Papp | Apparent permeability coefficient |
| ER | Efflux ratio |
| RLMs | Rat liver microsomes |
| RIS9 | Rat intestine S9 |
| RLS9 | Rat liver S9 |
| MDR | Mutidrug resistance |
| BCRP | Breast cancer-resistance protein |
| MRPs | Multidrug resistance-associated protein |
| OATs | Organic anion transporters |
| OATPs | Organic anion transporting polypeptides |
| HEK293 | Human embryonic kidney 293 cell |
| FBS | Fetal bovine serum |
| DGA | D-Glucaric acid-1,4-lactone monohydrate |
| AUC | Area under the curve |
| TEER | Transepithelium electrical resistance |
| GSH | L-Glutathione |
| ATP | Adenosine 5′-triphosphate |
| AMP | Adenosine 5′-monophosphate |
Acknowledgements
We thank Dr Xiaoyan Chen (Shanghai Institute of Materia Medica, Chinese Academy of Sciences, Shanghai, China) for the transfecting HEK293-cell lines. We thank Professor Min Huang (School of Pharmaceutical Science, Sun Yat-sen University, Guangzhou, China). We also thank Professor Xiaodong Liu (Center of Drug Metabolism and Pharmacokinetic, China Pharmaceutical University, Nanjing, China) for providing human BCRP-MDCKII cells for providing human MDR1-MDCKII cells. These studies were supported by the National Natural Science Foundation of China (no. 81273658).References
- L. Tong, M. Wan, L. Zhang, Y. Zhu, H. Sun and K. Bi, J. Pharm. Biomed. Anal., 2012, 70, 6–12 CrossRef CAS PubMed.
- Y. Z. Yang, Y. Z. Tang and Y. H. Liu, J. Ethnopharmacol., 2013, 148, 271–276 CrossRef CAS PubMed.
- C. Qian, Y. Wang, Y. Zhong, J. Tang, J. Zhang, Z. Li, Q. Wang and R. Hu, Free Radical Res., 2014, 48, 607–621 CrossRef CAS PubMed.
- L. Zhang, H. Wang, Z. Cong, J. Xu, J. Zhu, X. Ji and K. Ding, Oncol. Rep., 2014, 32, 1179–1187 CrossRef CAS PubMed.
- H. Z. Piao, S. A. Jin, H. S. Chun, J. C. Lee and W. K. Kim, Arch. Pharmacal Res., 2004, 27, 930–936 CrossRef CAS.
- F. Wang, X. Song, M. Zhou, L. Wei, Q. Dai, Z. Li, N. Lu and Q. Guo, Toxicology, 2013, 305, 10–19 CrossRef CAS PubMed.
- Q. Wang, R. Wen, Q. Lin, N. Wang, P. Lu and X. Zhu, Dig. Dis. Sci., 2015, 60, 3329–3339 CrossRef PubMed.
- X. Xu, Y. Zhang, W. Li, H. Miao, H. Zhang, Y. Zhou, Z. Li, Q. You, Q. Guo and L. Zhao, Biochem. Pharmacol., 2014, 92, 220–234 CrossRef CAS PubMed.
- Q. Guo, L. Zhao, Q. You, Y. Yang, H. Gu, G. Song, N. Lu and J. Xin, Antiviral Res., 2007, 74, 16–24 CrossRef CAS PubMed.
- X. Chen, H. Wang, Y. Du and D. Zhong, J. Chromatogr. B: Anal. Technol. Biomed. Life Sci., 2002, 775, 169–178 CrossRef CAS.
- S. Tian, G. He, J. Song, S. Wang, W. Xin, D. Zhang and G. Du, Fitoterapia, 2012, 83, 532–540 CrossRef CAS PubMed.
- Y. C. Hou, S. P. Lin, S. Y. Tsai, M. H. Ko, Y. C. Chang and P. D. Chao, Planta Med., 2011, 77, 455–460 CrossRef CAS PubMed.
- C. Li, L. Zhang, L. Zhou, S. K. Wo, G. Lin and Z. Zuo, AAPS J., 2012, 14, 23–34 CrossRef CAS PubMed.
- F. Zuo, Z. M. Zhou, M. Z. Yan, M. L. Liu, Y. L. Xiong, Q. Zhang, H. Y. Song and W. H. Ye, Biol. Pharm. Bull., 2002, 25, 558–563 CAS.
- Q. Zhou, Z. Zheng, B. Xia, L. Tang, C. Lv, W. Liu, Z. Liu and M. Hu, Pharm. Res., 2010, 27, 1568–1583 CrossRef CAS PubMed.
- L. Zhang, C. Li, G. Lin, P. Krajcsi and Z. Zuo, AAPS J., 2011, 13, 378–389 CrossRef CAS PubMed.
- C. Gao, H. Zhang, Z. Guo, T. You, X. Chen and D. Zhong, Drug Metab. Dispos., 2012, 40, 2009–2020 CrossRef CAS PubMed.
- T. Akao, K. Kawabata, E. Yanagisawa, K. Ishihara, Y. Mizuhara, Y. Wakui, Y. Sakashita and K. Kobashi, J. Pharm. Pharmacol., 2000, 52, 1563–1568 CrossRef CAS PubMed.
- L. Hong, C. Xu, S. O'Neal, H. C. Bi, M. Huang, W. Zheng and S. Zeng, Acta Pharmacol. Sin., 2014, 35, 1577–1585 CrossRef PubMed.
- J. Chen, J. Liu, Y. Wang, X. Hu, F. Zhou, Y. Hu, Y. Yuan and Y. Xu, Biomed. Pharmacother., 2017, 91, 621–631 CrossRef CAS PubMed.
- S. Y. K. Fong, C. Li, Y. C. Ho, R. Li, Q. Wang, Y. C. Wong, H. Xue and Z. Zuo, Mol. Pharmaceutics, 2017, 14, 2908–2916 CrossRef CAS PubMed.
- D. L. Huynh, N. Sharma, A. Kumar Singh, S. Singh Sodhi, J. J. Zhang, R. K. Mongre, M. Ghosh, N. Kim, Y. Ho Park and D. Kee Jeong, Chin. J. Nat. Med., 2017, 15, 15–40 Search PubMed.
| This journal is © The Royal Society of Chemistry 2018 |


