
Cholesterol-based diazine derivative: selective sensing of Ag+ and Fe3+ ions through gelation and the performance of metallogels in dye and picric acid adsorption from water†
Atanu
Panja
and
Kumaresh
Ghosh
 *
*
Department of Chemistry, University of Kalyani, Kalyani-741235, India. E-mail: ghosh_k2003@yahoo.co.in; kumareshchem18@klyuniv.ac.in; Fax: +91-3325828282; Tel: +91-3325828750 ext. 305
First published on 4th October 2018
Abstract
Cholesterol appended diazine derivative 1 on a 4-hydroxybenzaldehyde scaffold has been designed and synthesized. The compound having diazine as a metal ion binding site forms nice gels with Ag+ and Fe3+ ions over a series of other metal ions from CHCl3/CH3OH (3![[thin space (1/6-em)]](https://www.rsc.org/images/entities/char_2009.gif) :1, v/v). Strong hydrophobic interaction owing to the presence of cholesterol has a marked contribution in aggregation. The SEM image reveals fibrillar to globular porous microstructures. The true nature of the gels is determined from a rheological study. The Ag+ and Fe3+-gels are distinguishable with the aid of tetrabutylammonium chloride, tetrabutylammonium bromide or fluoride and ammonium thiocyanate. There is no interference of Fe2+ ions in the detection of Fe3+ ions. The presence of Fe2+ ions in solution can successfully be ascertained through gelation of 1 in the specified solvent upon adding external oxidising agents such as m-CPBA. As an application, both the Ag+- and Fe3+-gels of 1 act as good adsorbents for adsorption of uranine dye and picric acid from aqueous solution. In this process, the metallogels are recyclable and exhibit excellent efficiency.
:1, v/v). Strong hydrophobic interaction owing to the presence of cholesterol has a marked contribution in aggregation. The SEM image reveals fibrillar to globular porous microstructures. The true nature of the gels is determined from a rheological study. The Ag+ and Fe3+-gels are distinguishable with the aid of tetrabutylammonium chloride, tetrabutylammonium bromide or fluoride and ammonium thiocyanate. There is no interference of Fe2+ ions in the detection of Fe3+ ions. The presence of Fe2+ ions in solution can successfully be ascertained through gelation of 1 in the specified solvent upon adding external oxidising agents such as m-CPBA. As an application, both the Ag+- and Fe3+-gels of 1 act as good adsorbents for adsorption of uranine dye and picric acid from aqueous solution. In this process, the metallogels are recyclable and exhibit excellent efficiency.
Introduction
Selective sensing and visualization of biologically significant analytes through prolific use of low molecular weight supramolecular gelators (LMWGs) have become an ongoing research interest in recent times.1 Low molecular weight supramolecular gelators (LMWGs) under weak noncovalent forces establish a cross-linked network in solution due to which gel formation occurs.2 The self-organization of such gelator molecules can be tuned by regulating the weak forces using external physical or chemical stimuli (light, redox, pH, ions).3 Chemical stimuli-induced changes in gel properties are beneficial for the development of new molecular sensors.1–3In continuation of our ongoing research interest in developing stimuli responsive supramolecular gelators on a 4-hydroxybenzaldehyde–cholesterol platform,4 we herein wish to report a simple, easy to make diazine functionalized LMWG 1 which performs excellently in metal ion sensing with practical applications. The hydrazine-based dipodal symmetrical imines (1,4-disustituted azines or diazines) are well known metal chelators and they are successfully used in various colorimetric and fluorescent sensors.5 This class of ligands possess delocalized electron density on the C![[double bond, length as m-dash]](https://www.rsc.org/images/entities/char_e001.gif) N–NC bond. Binding of metal ions to the diazine motif restricts the free rotation of the N–N bond and displays optical feedback. Compounds with this functionality are also known to exhibit interesting properties like excited state intramolecular proton transfer (ESIPT), aggregation induced emission enhancement (AIEE) etc.5g Considering all these properties, the designed compound 1 was selected which formed nice gels from a CHCl3/CH3OH mixture solvent in the presence of Ag+ and Fe3+ ions. The metallogels have applications in various aspects. Here, they are established to be useful in discrimination of halides, dye adsorption and picric acid removal from waste water.
N–NC bond. Binding of metal ions to the diazine motif restricts the free rotation of the N–N bond and displays optical feedback. Compounds with this functionality are also known to exhibit interesting properties like excited state intramolecular proton transfer (ESIPT), aggregation induced emission enhancement (AIEE) etc.5g Considering all these properties, the designed compound 1 was selected which formed nice gels from a CHCl3/CH3OH mixture solvent in the presence of Ag+ and Fe3+ ions. The metallogels have applications in various aspects. Here, they are established to be useful in discrimination of halides, dye adsorption and picric acid removal from waste water.
Fig. 1 represents the different components of gelator 1. While the cholesterol motif has been introduced for assisting self-aggregation of the molecules through hydrophobic interaction,6 the diazine bridge is used as the site of metal ion interaction with an expectation of influencing the gelation property of compound 1 (either gel-to-sol or vice versa). Moreover, the use of a large hydrophobic surface in the design has a discernible impact on dye adsorption in the aggregated state.1g,4c
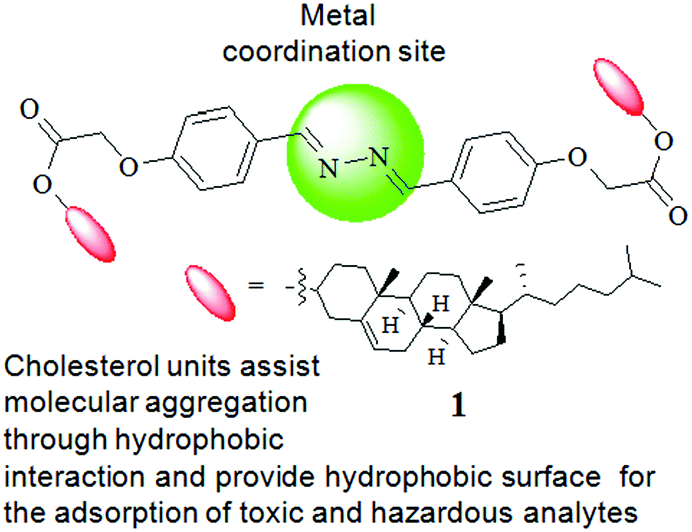 | ||
| Fig. 1 Design concept and structure of compound 1. | ||
Among the different analytes, sensing and detection of Ag+ and Fe3+ ions draw much attention because of their biological significance.7 Although, Ag+ ions have broad applications in organic synthesis, electronics, photography, mirrors and pharmacy, the release of a large quantity of silver to the environment causes toxic contamination which becomes a threat to aquatic and living organisms.8 On the other hand, Fe3+ ions are an essential element in living cells playing crucial roles in the function of haemoglobin.9 Their deficiency can damage several body functions and lead to liver damage, anaemia, Alzheimer's and Parkinson's diseases etc.9 Therefore, an approach for the easy and efficient detection of Ag+ and Fe3+ ions, especially in sol–gel medium, is worth investigating. Although there are plenty number of reports on their fluorometric detection,10 the detection of Fe3+ and Ag+ using LMWGs and their subsequent applications in material chemistry is less explored.4b,11,12
Results and discussion
Synthesis
Compound 1 was synthesized according to Scheme 1. Initially, cholesterol was converted to the chloro ester 2 which upon reflux with 4-hydroxy benzaldehyde in the presence of K2CO3 in CH3CN gave the cholesteryl aldehyde 3.4 Schiff base formation between the aldehyde 3 and hydrazine in dry benzene afforded the corresponding diazine derivative 1 in appreciable yield. All the compounds were fully characterized by usual spectroscopic methods.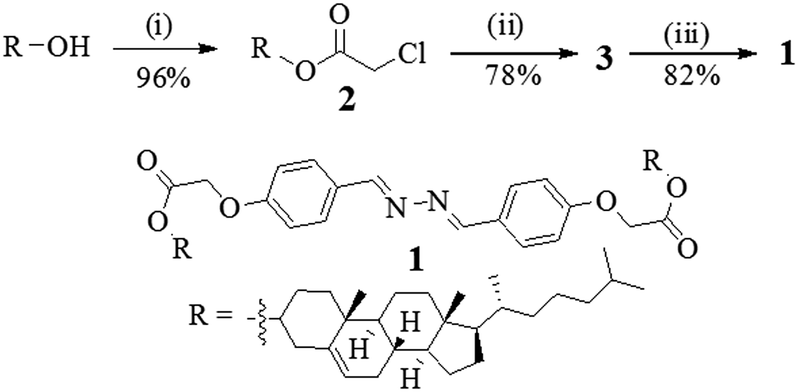 | ||
| Scheme 1 (i) Chloroacetyl chloride, pyridine, dry CHCl3, rt, 10 h; (ii) 4-hydroxybenzaldehyde, K2CO3, CH3CN, 5 h; (iii) N2H4·H2O, dry benzene, reflux, 3 days. | ||
Gelation and metal responsive character
The gel forming ability of compound 1 was investigated in different solvents (Table S1, ESI†). Compound 1 remained practically insoluble in most of the semi-aqueous solvents (except in THF–H2O, where it gave solution). It was partially soluble in polar solvents like DMF, DMSO or CH3CN. Interestingly, in toluene, it underwent aggregation to form a gel. However, the toluene gel was unstable and broken down on slight disturbance. This was a hindrance to investigating the metal ion sensitivity of 1 by sol–gel methodology.Therefore, the influence of different metal ions in bringing gelation of 1 in different solvent compositions was verified. It was found that in THF/H2O (1:1, v/v), metal ions like Cu2+, Ag+ and Hg2+ ions gave precipitation, whereas in CHCl3/CH3OH (3:1, v/v) compound 1 readily formed stable gels in the presence of Ag+ and Fe3+ ions (Table S1, ESI†). So, for detailed investigation, the CHCl3/CH3OH (3:1, v/v) solvent combination was used as the desired solvent in the study.
The effect of different metal ions on gelation of 1 was investigated by adding equiv. amounts of different metal solutions (as perchlorate salts, c = 0.1 M in CH3OH) to the CHCl3 solution of 1. The volume was adjusted with the required solvent to maintain CHCl3/CH3OH as 3:1 (v/v). In this study, while Ag+ and Fe3+ ions resulted in gelation of 1, other metal ions under identical conditions remained silent (Fig. 2A). Importantly, gelation also occurred upon direct addition of perchlorate salts of Ag+ and Fe3+ ions to the CHCl3/CH3OH (3:1, v/v) solution of 1 followed by gentle shaking. While the Ag+-induced gel was pale yellow colored, it was orange in the case of the Fe3+-induced gel. These findings suggested the high sensitivity of gelator 1 toward Ag+ and Fe3+ ions, rather than any other metal ions tested. Compound 1 was also able to form a stable gel under identical conditions, in the presence of other Ag+ and Fe3+-salts such as AgNO3 and Fe(NO3)3 (Fig. 2B) and thereby we neglected any role of anions of the metal salts.
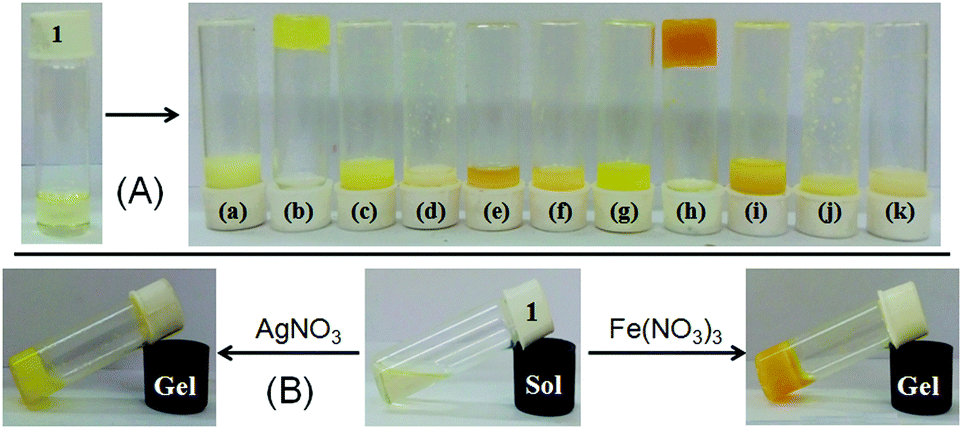 | ||
| Fig. 2 (A) Photograph showing the phase changes of 1 (c = 25 mg mL−1) in CHCl3/CH3OH (3:1, v/v) upon addition of an equiv. amount of different metal ions (as perchlorate salts, c = 0.1 M in CH3OH) after 2 h [from left to right: (a) Cu2+, (b) Ag+, (c) Hg+, (d) Pb2+, (e) Zn2+, (f) Cd2+, (g) Al3+, (h) Fe3+, (i) Fe2+, (j) Ni2+ and (k) Co2+] and (B) photograph showing the preparation of gels from 1 in the presence of AgNO3 and Fe(NO3)3. | ||
Discrimination between Ag+- and Fe3+-gels
Discrimination of the two metallogels was achieved upon treatment with tetrabutylammonium chloride (TBACl) and NH4SCN (Fig. 3). Addition of TBACl to the Ag+-gel of 1 ruptured the gel completely, while under identical conditions, the Fe3+-induced gel remained unpurturbed. Upon addition of Cl− ions, scavanging of Ag+ ions from the gel matrix took place for which Ag+-induced organisation of gelator 1 was destroyed and the gel was collapsed to the sol. However, addition of excess Ag+ ions to the Cl−-induced broken gel could again reinforce gelation. Similarly, addition of NH4SCN to the 1-Fe3+ gel resulted in the formation of a blood-red colored solution. In contrast, the 1-Ag+ gel remained intact even after 1 h, under similar conditions. These findings corroborated the visual discrimination of the Ag+-gel from the Fe3+-gel.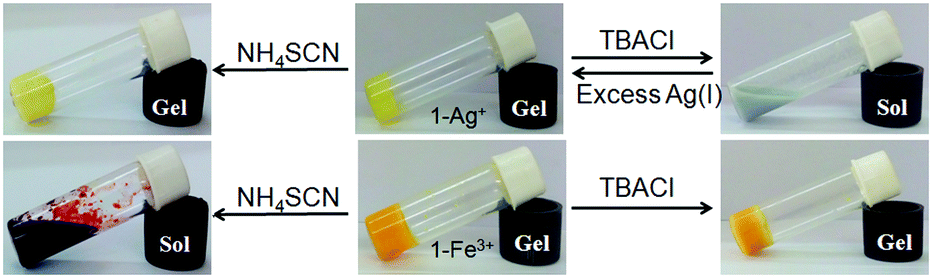 | ||
| Fig. 3 Chemical responsiveness of the Ag+-induced (top) and Fe3+-induced (bottom) gels of 1 in the presence of TBACl and NH4SCN. | ||
Thermal stability and morphological study of the metallogels
Prior to study, the minimum gelation concentrations (mgc) of 1 for the metal ions (counter anions: perchlorate ions) were determined. The ‘mgc’ values for the Ag+- and Fe3+-gels were 16 mg mL−1 and 19 mg mL−1, respectively. Both metallogels at their respective mgc values exhibited almost a similar thermal stability (Tgel = 40–42 °C). However, at a common concentration (19 mg mL−1), the Ag+-induced gel exhibited a higher gel melting temperature (Tgel = 46 °C) than the Fe3+-induced gel (Tgel = 42 °C), indicating strong aggregation in the presence of Ag+ ions. It is mentionable that use of nitrate salts of silver and iron under identical conditions showed almost similar thermal stability (for AgNO3: Tgel = 48 °C; for Fe(NO3)3: Tgel = 40 °C). Both the gels were thermoreversible as confirmed by the usual heating–cooling method (Fig. 4a).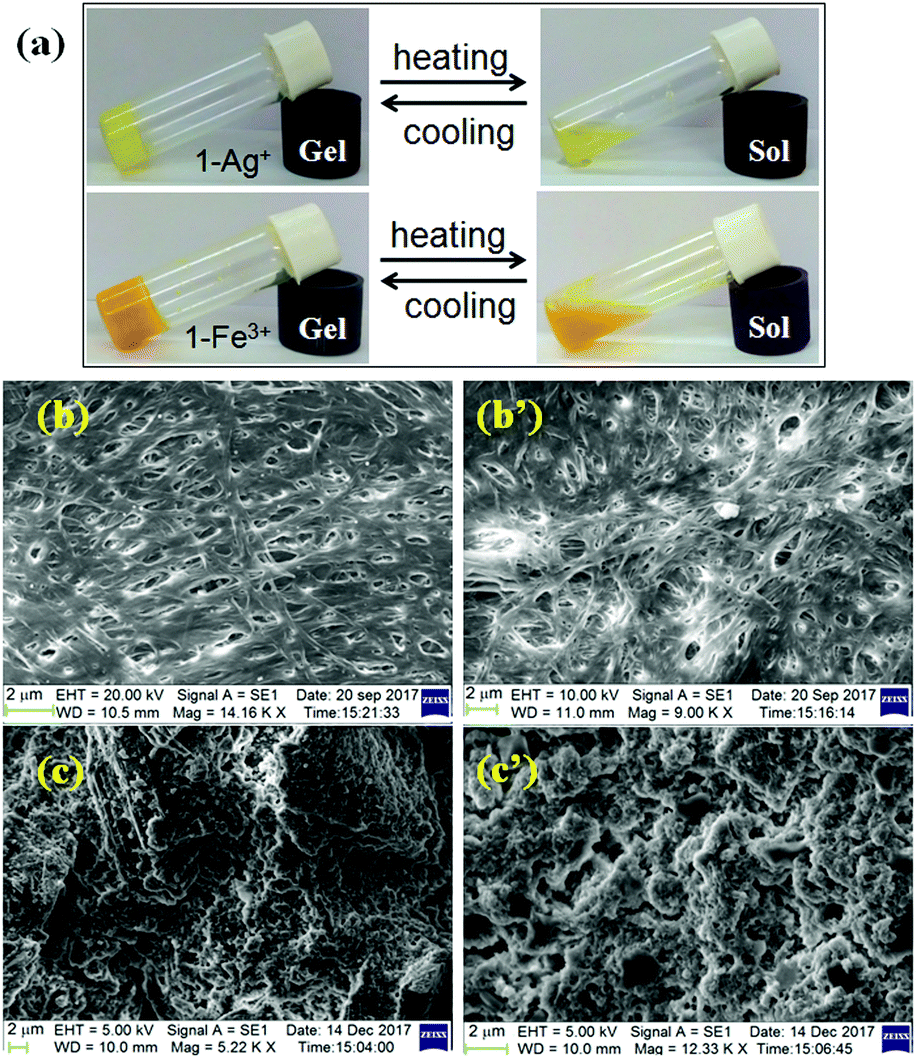 | ||
| Fig. 4 (a) Photograph showing the thermo reversibility of Ag+-induced and Fe3+-induced gels of 1 (top) and SEM images of the metallogels of 1 with Fe3+ (b and b′) and Ag+ ions (c and c′) (below). | ||
To get an insight into the morphology of the metallogels, SEM images were captured. While there was an interlinked porous fibrillar network for the Fe3+-metallogel (Fig. 4b and b′), a globular microstructure was observed for the Ag+-metallogel (Fig. 4c and c′).
Probable mode of interaction during metallogelation
As the imine bonds in many cases are hydrolysed to aldehyde in the presence of metal ions,13 it was necessary to check whether the gelation of 1 occurred through the formation of aldehyde 3 in the present case. For this, in the experiment it was observed that aldehyde 3 did not form a gel either in CHCl3/CH3OH (3:1, v/v) or in the presence of Ag+ and Fe3+ ions (Fig. S1, ESI†). NMR study as described later reveals the stability of 1.
To understand the molecular aggregation, UV-vis and fluorescence spectra of compound 1 were compared in the sol and gel states (Fig. S2, ESI†). In solution, compound 1 exhibited an absorption band at 326 nm which was red shifted to 376 nm for the Ag-gel. Such red shift of the absorption band to 334 nm along with a weak shouldering in the region of 426 nm was observed for the Fe-gel, and corroborated the aggregation. In fluorescence, gelation caused a significant decrease in the fluorescence intensity of 1 for both the metallogels. The weak emission centered at 434 nm in the sol state suffered a blue shift of 33 nm and 26 nm for the Ag-gel and Fe-gel, respectively. A new peak at 549 nm for the Fe-gel was recorded which could be explained by the overlapping of aromatic units to form a higher array of π–π stacking in the gel state. Due to such aggregation, the emission of compound 1 was quenched.
The nature of supramolecular interaction in metallogels of 1 is, however, difficult to predict. We believe that the metal ions possibly coordinate the diazine group in the mode shown in Fig. 5,5h and assist the gelators to form a network in solution for gelation. In FTIR, the small decrease in stretching frequency of the imine bonds (from 1608 cm−1 to 1606 cm−1) during gelation suggested this proposition (Fig. S3, ESI†). Moreover, the shift of stretching of the ester carbonyl in metallogels compared to the amorphous states possible due to involvement in intermolecular connection with the solvent methanol or metal ions could not be ruled out. However, the strong hydrophobic interaction as usually exerted by the cholesteryl surface is presumed to be an additional driving force for aggregation.
 | ||
| Fig. 5 (A) Probable mode of metal gelator interaction; (B) partial 1H NMR spectra of 1 in the absence (a) and presence of an equiv. amount of (b) Fe3+ and (c) Ag+ ions in CDCl3. | ||
The mechanism of interaction was investigated by recording 1H NMR of 1 in the absence and presence of these two metal ions (Fig. 5). The presence of Ag+ and Fe3+ ions caused downfield chemical shifts of the imine protons (Ha) by 0.2 ppm and 0.1 ppm, respectively and indicated their small interaction with the diazine group. This metal–ligand interaction also resulted in small downfield chemical shifts of the other aromatic protons (Hb and Hc).
Mechanical properties of the metallogels
To understand the viscoelastic properties of the metallogels, an oscillatory rheological experiment (amplitude sweep and frequency sweep) was carried out at 20 °C (Fig. 6). For this experiment, we prepared the gels of 1 upon individual addition of one equiv. amount of Ag+ and Fe3+ ions at their respective ‘mgc’ values. To find out the linear viscoelastic region, an amplitude sweep experiment of both the gels was carried out at a constant frequency of 1 Hz (Fig. 6a). During this experiment, at lower applied strain, both the elastic/storage modulus (G′) and viscous/loss modulus (G′′) remained almost independent of applied strain (upto almost 1% strain) and displayed strong mechanical behaviour (G′ ≫ G′′). However, with gradual increase in applied strain both G′ and G′′ were decreased and at a certain strain, crossover between them was noted, above which the viscous property dominates (G′′ > G′). The crossover points were detected at 6% and 8% of applied strain for the Ag+ and Fe3+-induced gels, respectively. This indicated disintegration of the respective gels at the applied strain. Demolition of the metallogels at lower applied strain (below 10% strain) demonstrated lower strain bearing capability and their fragile nature.14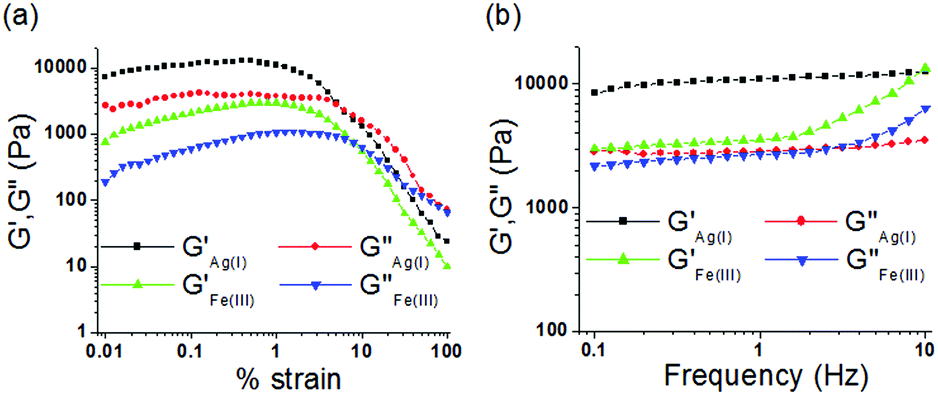 | ||
| Fig. 6 Rheology experiment of the metallogels of 1: (a) amplitude sweep and (b) frequency sweep. | ||
For the gels, during a frequency sweep experiment (at constant strain of 0.5%), the values of G′ were always higher than those of G′′ at any frequency which corroborated the true gel nature of the materials (Fig. 6b). For Ag+-gel, both G′ and G′′ were frequency independent over the entire range studied (0.1 to 10 Hz), however, at higher frequency (above 1.5 Hz) little frequency dependence of both G′ and G′′ was observed for Fe3+-gel (frequency hardening as both G′ and G′′ increased with increase in applied frequency). Analysis of tanδ values (tanδ = G′′av/G′av, 0.27 and 0.74 for the Ag+-gel and Fe3+-gel, respectively; Table 1) clearly described the higher mechanical strength (lower tanδ) of the Ag+-gel in comparison to the Fe3+-gel. Most importantly, despite the lower gelator concentration, the Ag+-gel showed almost three times higher storage modulus (G′) than the Fe3+-gel, thereby indicating its greater stability over the Fe3+-gel.14
Metal ion binding study of 1 in solution
The gelator 1 also exhibited measurable interaction in solution. Solution phase interactions were measured by recording UV-vis and fluorescence spectra of compound 1 (c = 2.50 × 10⁻⁵ M) upon adding different metal ions (as perchlorate salts, c = 1.0 × 10⁻³ M) in CHCl3/CH3OH (3:1, v/v). During UV-vis titration, addition of Ag+ ions (upto 40 equiv.) resulted in a weak ratiometric spectral change in the corresponding absorption spectrum. The initial absorption peak at 326 nm was progressively decreased and two clear isosbestic points at 368 nm and 274 nm were observed (Fig. S4, ESI†). In the case of Fe3+ ions (upto 40 equiv.), the initial absorption band at 326 nm was gradually increased and red shifted by 13 units (Fig. S4, ESI†). In this change in absorption of 1 at 326 nm, the absorption originated from solvent–Fe3+ ion interaction may remain interweaved as confirmed from Fig. S5 (ESI†). All other metal ions did not bring similar spectral changes under these conditions (Fig. S5, ESI†).
Although compound 1 does not have any fluorescent probe, it on examination showed selective interaction in fluorescence towards Fe3+ ions only. Fig. 7a, in this regard, displays the change in fluorescence ratio (λex = 330 nm) at 434 nm upon addition of 30 equiv. amounts of different metal ions. Addition of Fe3+ ions resulted in significant quenching of emission at 434 nm (Fig. 7b), whereas all other metal ions remained non interacting in the study (Fig. 7c). The fluorescence quenching of 1 in the presence of Fe3+ ions was possibly attributed to the heavy atom effect of Fe3+ ions.11b
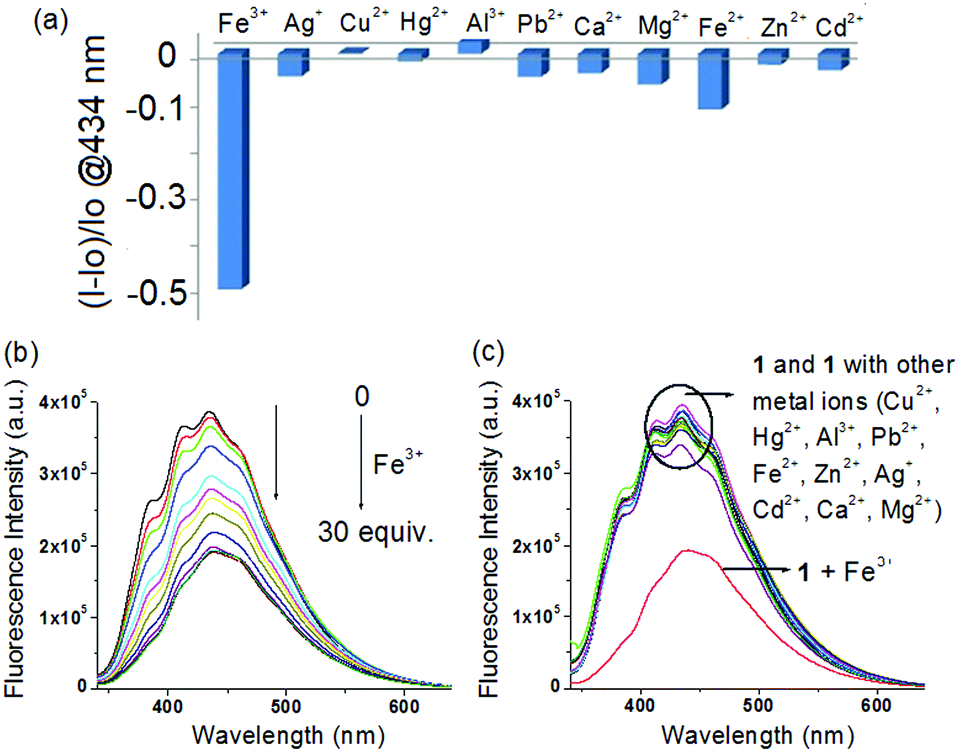 | ||
| Fig. 7 (a) Change in fluorescence ratio (λex = 330 nm) of 1 (c = 2.5 × 10⁻⁵ M) at 434 nm upon addition of 30 equiv. amounts of different metal ions (c = 1.0 × 10⁻³ M) in CHCl3/CH3OH (3:1, v/v); change in fluorescence intensity of 1 upon addition of 30 equiv. amounts of (b) Fe3+ and (c) different metal ions. | ||
The Benesi–Hildebrand plot15 indicated linear binding of 1 with both Fe3+ and Ag+ ions. The corresponding binding constant values and detection limit16 (Fig. S6–S8, ESI†) were calculated (Table S2, ESI†). The detection limits were obtained as 9.35 × 10⁻⁶ M and 5.85 × 10⁻⁵ M, for Ag+ and Fe3+ ions, respectively. Thus compound 1 could serve as an LMWG for the selective and differential recognition of Fe3+ and Ag+ ions, in a gel state as well as in the solution phase.
Non interference of Fe2+ ions during Fe3+ sensing and detection of in situ generated Fe3+ ions
We were eager to examine the interference of Fe2+ ions during a Fe3+ sensing process. In this case, we observed that Fe3+-induced gelation could also be achieved in the presence of Fe2+ ions (Fig. 8A). When Fe3+ ions were added to Fe2+-containing sol of 1, orange colored gel formation was noticed. This study primarily established the non interference of Fe2+ ions during Fe3+-promoted gelation.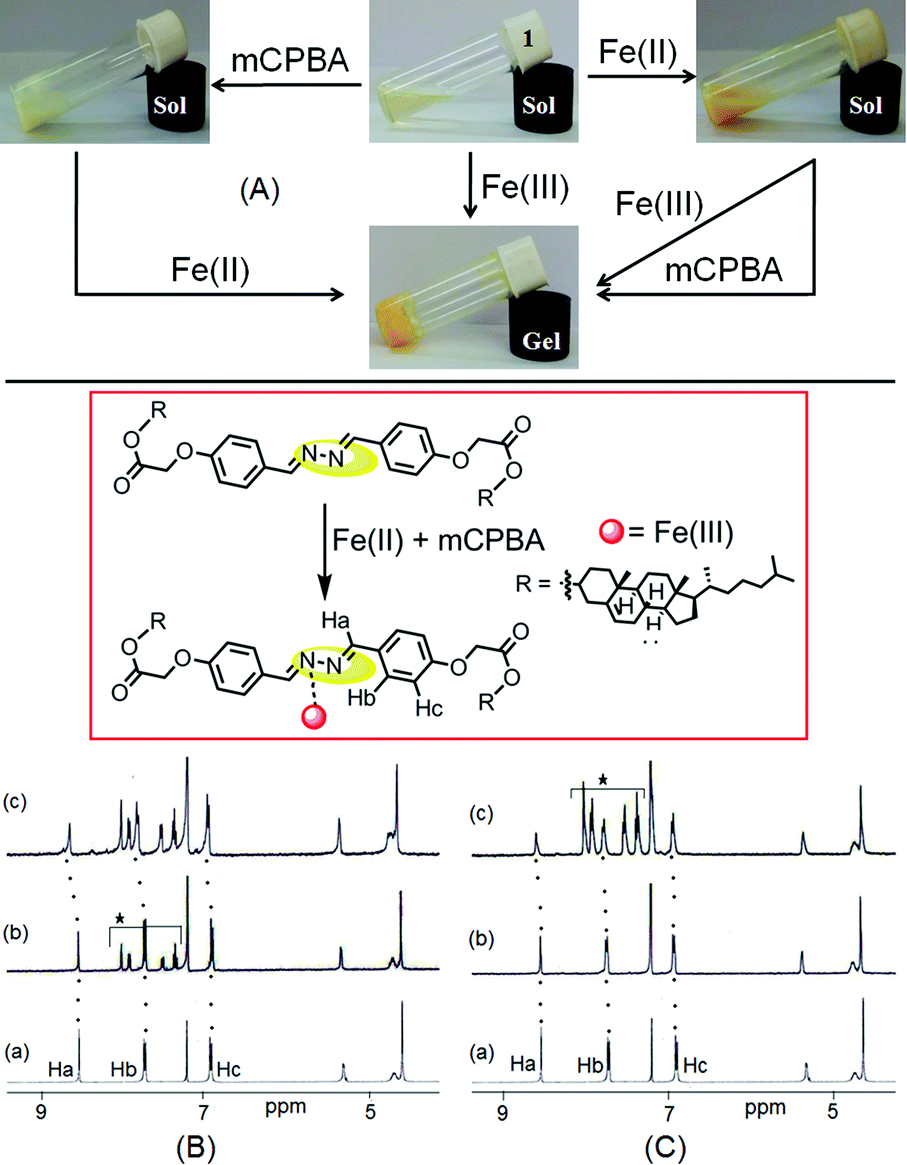 | ||
| Fig. 8 (A) Photograph showing the responsiveness of 1 in CHCl3/CH3OH (3:1, v/v) with Fe2+, Fe3+ and mCPBA under different conditions [in the study, an equiv. amount of Fe3+ and Fe2+ ions, and 2 equiv. amount of mCPBA as an oxidant were used], (B) partial 1H NMR spectra of (a) 1, (b) 1 with mCPBA and (c) 1 with mCPBA followed by addition of Fe2+ (as perchlorate salt), (C) partial 1H NMR spectra of (a) 1, (b) 1 with Fe2+ (as perchlorate salt) and (c) 1 with Fe2+ followed by addition of mCPBA. NMR studies were carried out in CDCl3 with an equiv. amount of different analytes and the asterisk protons in the spectra represent the signals of mCPBA. | ||
As compound 1 can discriminate Fe3+ ions from Fe2+ ions in the gel phase, we further investigated its practical application in detecting in situ generated Fe3+ ions. A thorough experiment, in this regard, is represented in Fig. 8A. First, the gelation of compound 1 was investigated either in the presence of Fe2+ ions or m-chloroperbenzoic acid (mCPBA), an oxidizing agent. In both cases, we obtained solutions. However, addition of mCPBA to the Fe2+ containing sol of 1 brought gelation. Gelation also took place in the reverse way when Fe2+ ions were added to a solution of 1 containing mCPBA.
The in situ generation of Fe3+ ions in the presence of mCPBA, actually caused gelation of 1. This was further established by 1H NMR. The 1H NMR spectrum of 1 in CDCl3 remained almost unperturbed either in the presence of mCPBA or in the presence of Fe2+. However, addition of Fe2+ ions to an mCPBA containing solution of 1 caused downfield chemical shift of the imine protons by 0.1 units (Ha, from 8.53 ppm to 8.64 ppm, Fig. 8B). A similar downfield chemical shift of Ha protons was observed when mCPBA was added to the solution of 1 containing Fe2+ ions (Fig. 8C). In addition to positional movement of the imine protons, the signals for Hb and Hc moved downfield. The spectral shifts were alike to the case shown in Fig. 5. These results undoubtedly corroborated the in situ oxidation of Fe2+ into Fe3+ and its subsequent participation in the gelation of 1. A similar in situ oxidation of Fe2+ using H2O2 was unsuccessful.
In practice, most of the Fe3+-sensing probes suffer from interference from Fe2+ ions.10c–f Even gel phase detection of Fe3+ ions also experiences such interference.11a However, some reported studies have not included the effect of Fe2+ ions during Fe3+ ion sensing.11b So, development of an efficient sensing probe for Fe3+ ions having no interference from Fe2+ ions is a great challenge. In this scenario, our present gelator structure 1 demands merit as a sensor for detection of Fe3+ ions even in the presence of Fe2+ ions in a sol–gel method.
Application of the metallogels
On the other hand, both TBAF and TBABr ruptured the Fe3+-induced gel and resulted in respective sols of yellow and orange-red color. In this event, TBAI remaind silent in such phase changes although the color of the Fe3+-gel became orange-red from orange. All these results are declared to be useful in visual recognition and discrimination of the halides from each other.
We investigated the dye adsorption efficiency of Fe3+- and Ag+-induced gels of 1 towards anionic dye uranine. Recently, Thomas et al. demonstrated the adsorption of oppositely charged dyes by a cross-linked hydrogel and showed that selective adsorption of dyes predominantly depends upon the electrostatic interaction between the hydrogel and dyes.18c Regarding this, we assumed that the electrostatic interaction between the metal ion of gels and uranine would be beneficial for the successful and efficient adsorption of the anionic dye uranine on the cholesteryl hydrophobic surfaces. Furthermore, depending upon the charge–charge interaction, different efficacy of the Fe3+- and Ag+-metallogels towards uranine adsorption could easily be anticipated.
To execute these features, first we examined the feasibility of adsorption on the metallogels by preparing the respective metallogels in the presence of uranine in CHCl3/CH3OH (3:1, v/v). Importantly, in both cases, stable gels were obtained (Fig. 9, top). These results suggested that the gels retained their aggregated structure even in the presence of uranine.
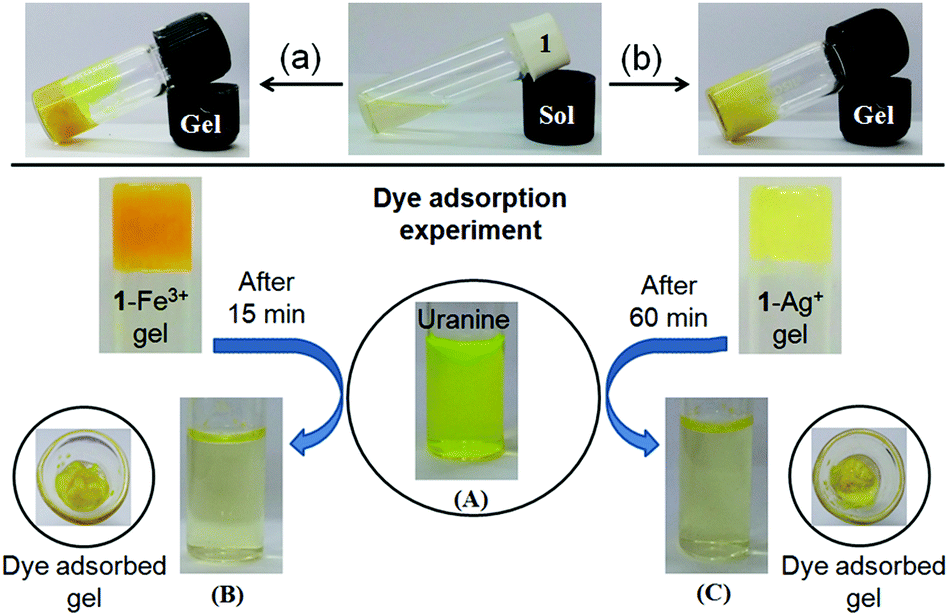 | ||
| Fig. 9 Photograph representing the gel formation of 1 in CHCl3/CH3OH (3:1, v/v) upon simultaneous addition of (a) Fe3+ and uranine and (b) Ag+ and uranine [uranine solution was prepared in MeOH containing a few drops of water] (top), photograph showing the adsorption of uranine (c = 3 × 10⁻⁵ M) by 1-Fe3+ gel (A → B) and 1-Ag+ gel (A → C). The gels were initially prepared by adding an equiv. amount of respective metal salts to 1 (25 mg mL−1) in CHCl3/CH3OH (3:1, v/v) (bottom). | ||
To perform the dye adsorption experiment, we placed Fe3+- and Ag+-gels of 1, separately into vials containing aqueous uranine solution (3 mL). After separation of the respective dye adsorbed gels from the aqueous parts through filtration, the efficiency of the gels as dye adsorbents was measured by recording the absorption spectra of the dye solutions before and after the addition of the gels. Fig. 9 and 10 and Table 2, in this regard, represent the details along this direction.
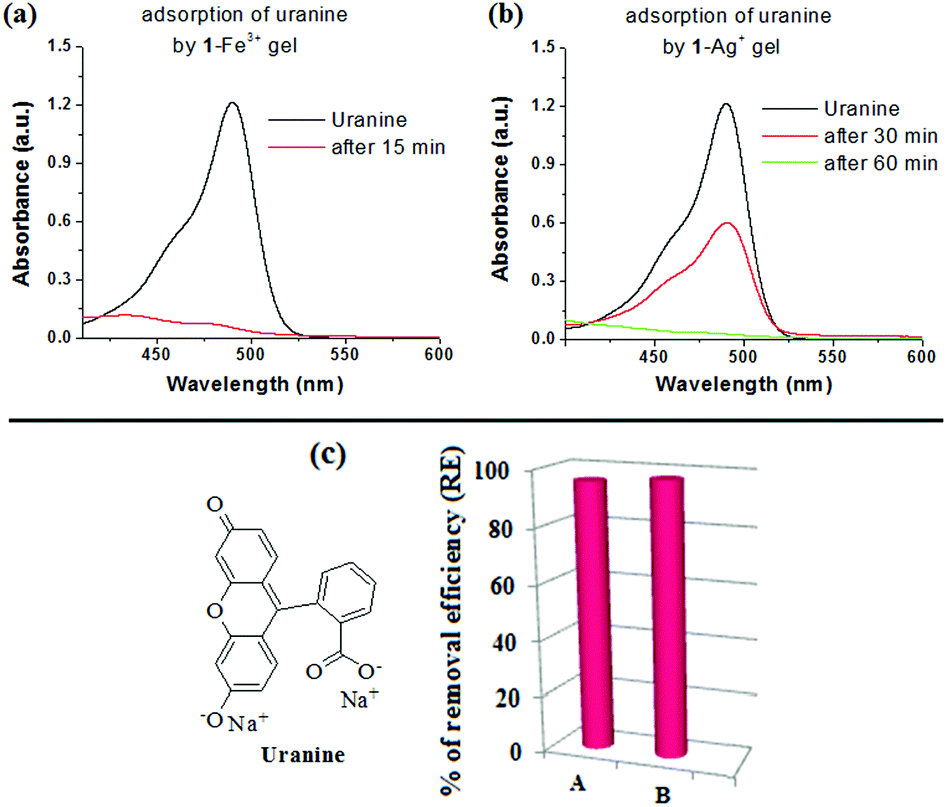 | ||
| Fig. 10 Change in absorbance of uranine solution (c = 3 × 10⁻⁵ M) before and after adsorption on (a) 1-Fe3+ gel and (b) 1-Ag+ gel. (c) The bar plot shows the respective dye adsorption data; adsorption of uranine by (A) 1-Fe3+ and (B) 1-Ag+ gels. | ||
| Dye (λmax in nm) | Gel | Initial conc. of the dye (Ci) [mM] (mg L−1) | Equilibrium conc. of the dye (Cf) [mM] (mg L−1) | Quantity of the adsorbed dye (mg per gram of the gelator)a |
|---|---|---|---|---|
| a Calculations are made on the basis of absorption spctral changes in PA solution after 15 min and 1 h for 1-Fe3+ and 1-Ag+ gel, respectively. | ||||
| Uranine (490) | 1-Fe3+ | 3 × 10⁻² (10.59) | 1.31 × 10⁻³ (0.46) | 1215 |
| 1-Ag+ | 7.40 × 10⁻⁴ (0.26) | 1239 | ||
To confirm the uranine adsorption, FTIR and UV-vis spectra of the respective metallogels were compared before and after the adsorption process. In FTIR, the presence of the characteristic stretching signals of both 1 and uranine (with some variations in peak positions) in both the dye-adsorbed gels verified the adsorption (Fig. S10, ESI†). Furthermore, for the dye-adsorbed gels, the presence of strong absorption bands in the region 440–490 nm (for uranine) established the successful adsorption (Fig. 11a and b). Such spectral appearance of the absorption bands of uranine was due to metal–uranine interaction. Spectral matches confirmed this attribute (Fig. S11, ESI†).
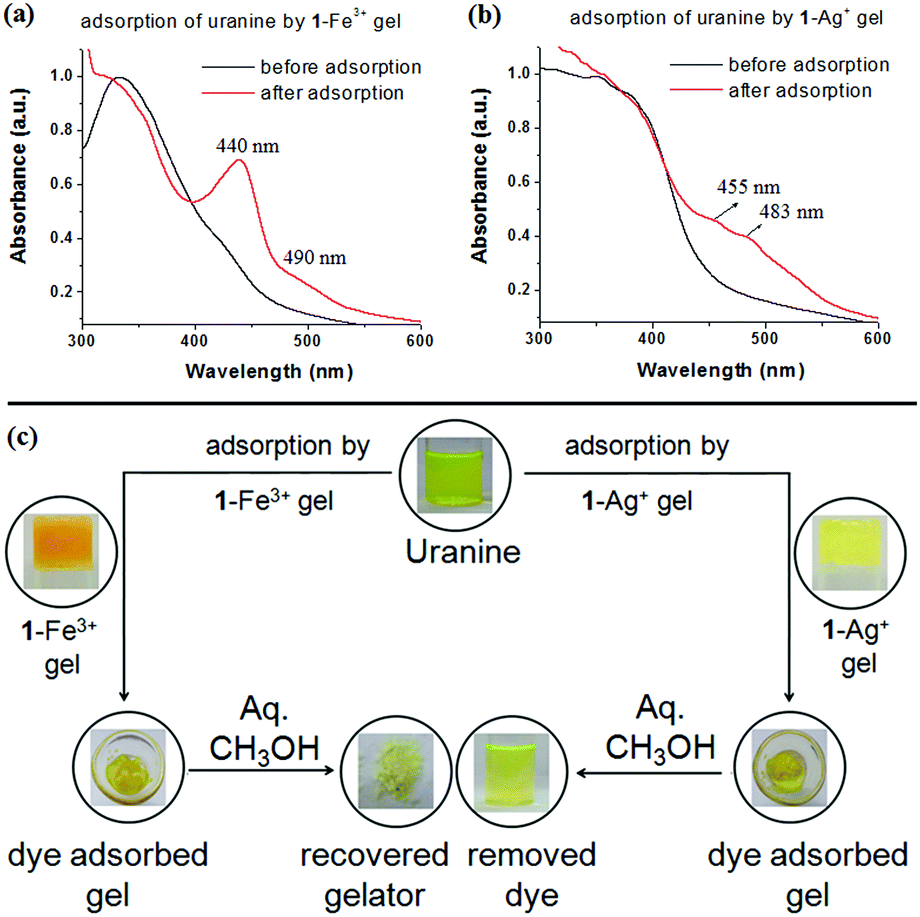 | ||
| Fig. 11 Comparison of normalized UV-vis spectra of (a) 1-Fe3+ gel and (b) 1-Ag+ gel, before and after adsorption of uranine and (c) photograph showing the recyclability of the uranine adsorption process. | ||
The used gelator in adsorption was recovered by washing the dye adsorbed gel with aqueous MeOH (1:1 v/v) and demonstrated the recyclability of the process (Fig. 11c).
The rapid removal of uranine by 1-Fe3+ gel, in comparison to 1-Ag+ gel, is certainly due to electrostatic interaction where a higher charge density in 1-Fe3+ gel preferentially exerts strong nucleophilic–electrophilic interaction. Moreover, in our opinion the porous gel architecture of 1-Fe3+ gel, in contrast to the globular microstructured 1-Ag+ gel, additionally favors faster adsorption. This observation has relevance in real life as the response time is short compared to other reported gels that usually take a couple of hours to perform the process.1g,17
Prior to investigating the PA removal from water, we examined the stability of the metallogels in the presence of PA. No visual changes of the gel states were detected upon addition of an equiv. amount of PA to the gels. Importantly, when we prepared the metallogels in the presence of both PA and respective metal ions in CHCl3/CH3OH (3:1, v/v), in each case instant gelation occurred (Fig. S12, ESI†). This established the sustainability of the metallogels in the presence of PA.
A PA adsorption experiment was carried out according to the same procedure as followed for a dye adsorption experiment. The Fe3+- and Ag+-gels of 1 were separately placed into the aqueous solutions of PA (3 mL). To evaluate the PA removal efficiency of the metallogels, change in absorption of the PA solution was monitored with time. The detailed experiment is shown in Fig. 12 and the outcomes are summarised in Table 3. Both the metallogels showed measurable efficiency towards removal of PA. Almost 83% and 74% adsorptions were noticed with the 1-Fe3+ and 1-Ag+ gels, respectively in 1 h (Fig. 12a–c). In comparison, both the metallogels showed very small extent of adsorption for the nitroaromatics having either no phenol –OH or fewer nitro groups (Fig. 12d and e). Negligible adsorption was recorded for simple nitroaromatics without phenolic –OH (8.76% and 8.88% for 2,4-dinitrotoluene and 13.58% and 11.11% m-dinitrobenzene by 1-Ag+ and 1-Fe3+ gel, respectively) (Fig. 12e and Fig. S13, ESI†). Adsorption was moderate for p-nitrophenol (30.29% and 35.45% by 1-Ag+ and 1-Fe3+ gel, respectively) (Fig. 12e and Fig. S13, ESI†). Efficient removal of PA by the metallogels is presumably due to strong interaction of the phenolic –OH of PA with the metal ions of the gel matrixes and in this context, the 1-Fe3+ gel is better than the 1-Ag+ gel.
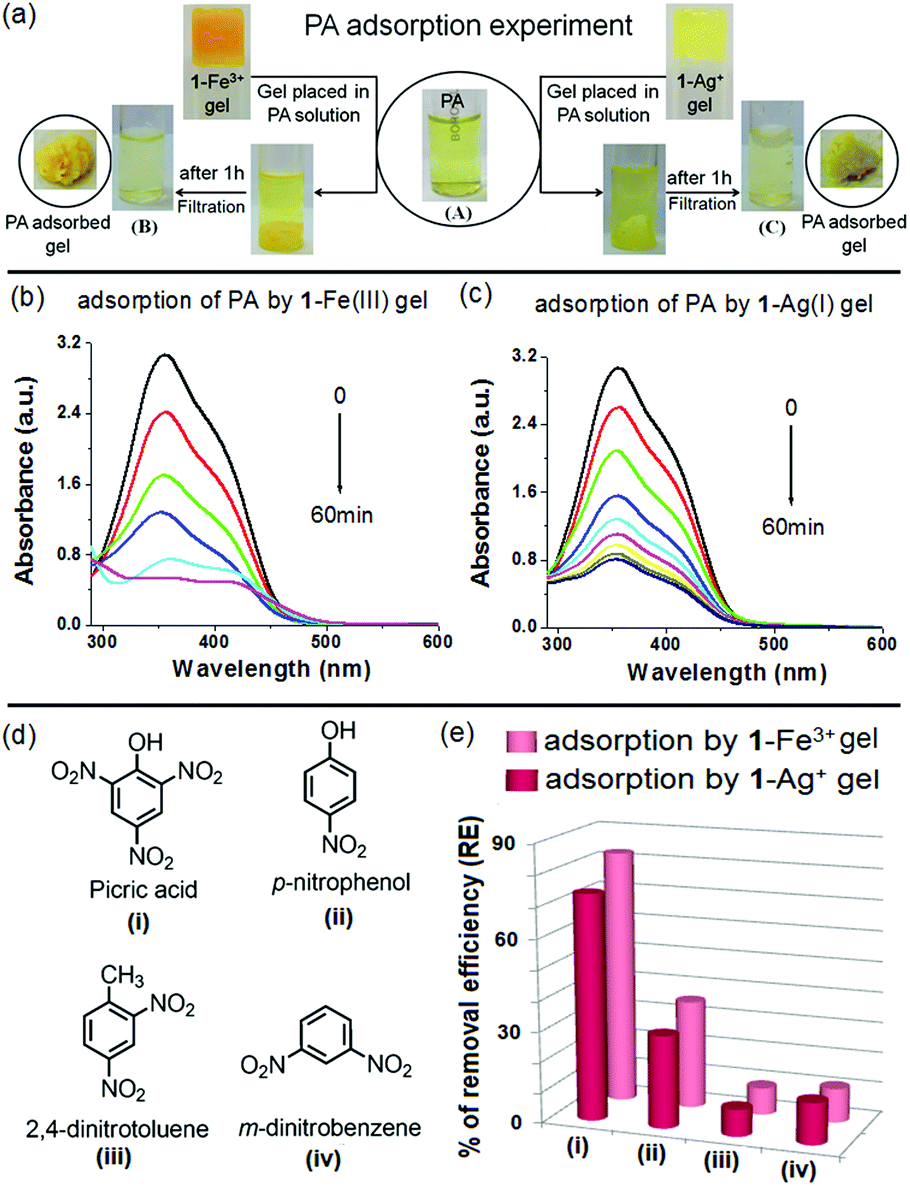 | ||
| Fig. 12 (a) Photograph showing the adsorption of PA (3 mL in water, c = 2 × 10⁻⁴ M) by 1-Fe3+ gel (A → B) and 1-Ag+ gel (A → C), change in absorbance of PA solution during adsorption by (b) 1-Fe3+ and (c) 1-Ag+ gels, (d) structures of the nitroaromatic compounds and (e) bar plot showing their % of adsorption by the 1-Fe3+ and 1-Ag+ gels after 1 h [For m-dinitrobenzene, c = 1 × 10⁻⁴ M; for other cases, c = 2 × 10⁻⁴ M; the gels were initially prepared by adding an equiv. amount of the respective metal salt to 1 (25 mg mL−1) in CHCl3/CH3OH (3:1, v/v)]. | ||
| Gel | Initial conc. of PA (Ci) [mM] (mg L−1) | Equilibrium conc. of PA (Cf) [mM] (mg L−1) | Quantity of the adsorbed PA (mg per gram of the gelator) |
|---|---|---|---|
| 1-Fe3+ | 2 × 10⁻¹ (45.82) | 3.4 × 10⁻² (7.94) | 4546 |
| 1-Ag+ | 5.2 × 10⁻² (11.96) | 4063 |
Comparison of FTIR and UV-vis spectra of the PA adsorbed gels with the pristine metallogels unequivocally established the successful adsorption phenomena. FTIR spectra of the PA adsorbed gels exhibited characteristic stretching signals of both the gelators and PA (Fig. S14, ESI†). The characteristic absorption band of PA was also found in the PA adsorbed gels (350–426 nm region, Fig. S15, ESI†). These peaks were absent in the mother metallogels. Here also, washing of the PA adsorbed gels with aqueous MeOH afforded the gelator back for reuse (Fig. S16, ESI†).
In reality, in spite of the large volume of studies on PA-responsive supramolecular gelators, the successful use of LMWGs as PA adsorbents with high removal efficacy in a short response time is rare. Recently, Cao et al. reported the adsorption of PA by a pyridine coupled naphthalimide-based gelator with moderate efficiency even after a day of performance (from absorption spectroscopic study, only 56.86% removal of PA was reported in 24 h).21a In this situation, this present work provides a new insight into fabricating new metallo–organic gel matrixes (MOG) for efficient removal of PA from water.
Conclusions
In conclusion, we have established that the diazine unit as a metal binding site in our designed structure 1 is unique in gel chemistry with various applications. Gelator 1 forms nice gels in the presence of Fe3+ and Ag+ ions in CHCl3/CH3OH mixture solvent. It is important to note that although a reasonable number of fluorescent probes for Fe3+ and Ag+ ions are known in the literature, until now, reports of the gel phase sensing of these metal ions are less in number, and in particular Fe3+ ion responsive LMWGs are very rare. Importantly, most of the sensing probes for Fe3+ ions (chemosensors as well as gelators) usually experience the interference of Fe2+ ions. A comparative view on this is represented in Table S3 (ESI†). In comparison, this present report receives attention as the gelator 1 does not experience any interference from Fe2+ ions during Fe3+-sensing, although response from Ag+ ions was observed. However, TBACl, TBAF and NH4SCN successfully discriminate Fe3+- and Ag+- metallogels.Both the metallogels reveal fibriller to globular porous microstructures as confirmed from SEM images. The true nature of the gels has been realized from a rheological study in detail. The study indicates that despite the lower gelator concentration, the Ag+-gel shows almost three times higher storage modulus (G′) than the Fe3+-gel, thereby highlighting its greater stability over the Fe3+-gel. Owing to the presence of metal ions, both the gels show adsorption characteristics. Uranine and picric acid are efficiently adsorbed from water. In this process, the metallogels are recyclable and exhibit excellent efficiency. These properties of the metallogels, which are rarely discussed in the literature (Table S4, ESI†), draw much attention concerning the practical point of view in the present report. Further investigations in this direction are underway in our laboratory.
Experimental
Materials and methods
All the chemicals and reagents were purchased from Spectrochem, India. Perchlorate salts of the metal ions were purchased from Sigma-Aldrich and were carefully handled. All solvents used in the synthesis were purified, dried and distilled as required. Solvents used in NMR experiments were obtained from Aldrich. Thin layer chromatography was performed on Merck precoated silica gel 60-F254 plates. 1H and 13C NMR spectra were recorded using a Bruker 400 MHz instrument using TMS as an internal standard. High resolution mass data were acquired by the electron spray ionization (ESI) technique on an XEVO GS-2 QTOf Waters mass spectrometer. FTIR measurements of the compounds were carried out using a Perkin-Elmer L120-00A spectrometer (νmax in cm−1) using KBr pellets. Fluorescence and UV-vis studies were performed using a Horiba Fluoromax 4C spectrofluorimeter and Shimadzu UV-2450 spectrophotometer, respectively.Synthesis and characterization
![[thin space (1/6-em)]](https://www.rsc.org/images/entities/b_char_2009.gif) 4.
To a stirred solution of cholesterol (0.5 g, 1.29 mmol) in 20 mL dry CHCl3 was added chloroacetyl chloride (0.16 mL, 1.93 mmol) and pyridine (0.05 mL, 0.65 mmol) under a nitrogen atmosphere. The mixture was allowed to stir for 10 h at room temperature. After completion of the reaction, the reaction mixture was neutralized with NaHCO3 solution, and then was extracted with CHCl3 (3 × 30 mL). The organic layer was washed several times with water and separated and dried over Na2SO4. Evaporation of the solvent gave a white solid compound. Recrystallization from CH3OH afforded pure product 2 (0.58 g, yield 96%, m.p. 148 °C). 1H NMR (400 MHz, CDCl3): δ 5.37 (m, 1H), 4.72 (m, 1H), 4.03 (s, 2H), 2.36 (m, 2H), 2.02–0.85 (m, 38H, cholesteryl protons), 0.67 (s, 3H); FTIR (KBr, cm−1): 2939, 2907, 2821, 1753, 1620, 1195.
4.
A mixture of 4-hydroxy benzaldehyde (1 g, 8.19 mmol) and K2CO3 (2.26 g, 16.38 mmol) was refluxed in dry CH3CN for 2 h and then compound 2 (4.55 g, 9.82 mmol) was added to it. The reaction mixture was refluxed for 5 h. Then the organic solvent was evaporated under reduced pressure and water was added to the crude mass. Then reaction mixture was extracted with 2% CH3OH in CHCl3. Evaporation of the solvent gave the crude product which was purified by column chromatography using 10% ethyl acetate in petroleum ether as an eluent to afford the pure compound 3 in 78% yield (3.50 g, m.p. 114 °C). 1H NMR (CDCl3, 400 MHz): δ 9.90 (s, 1H), 7.85 (d, 2H, J = 8 Hz), 7.01 (d, 2H, J = 8 Hz), 5.38 (d, 1H, J = 4 Hz), 4.75 (m, 1H), 4.68 (s, 2H), 2.35–0.67 (43H, cholesteryl protons); 13C NMR (CDCl3, 100 MHz): δ 190.7, 167.5, 162.6, 139.0, 131.9, 130.6, 123.2, 114.9, 75.6, 65.3, 56.6, 56.1, 49.9, 42.3, 39.6, 39.5, 37.9, 36.8, 36.5, 36.1, 35.7, 31.89, 31.82, 29.7, 28.2, 28.0, 27.6, 24.2, 23.8, 22.8, 22.5, 21.0, 19.2, 18.7, 11.8; FTIR (KBr) ν cm−1: 3403, 2945, 1775, 1701, 1606, 1212; HRMS (TOF MS ES+): calcd 549.3866 (M + 1)+, found 549.3890 (M + 1)+.
4.
To a stirred solution of cholesterol (0.5 g, 1.29 mmol) in 20 mL dry CHCl3 was added chloroacetyl chloride (0.16 mL, 1.93 mmol) and pyridine (0.05 mL, 0.65 mmol) under a nitrogen atmosphere. The mixture was allowed to stir for 10 h at room temperature. After completion of the reaction, the reaction mixture was neutralized with NaHCO3 solution, and then was extracted with CHCl3 (3 × 30 mL). The organic layer was washed several times with water and separated and dried over Na2SO4. Evaporation of the solvent gave a white solid compound. Recrystallization from CH3OH afforded pure product 2 (0.58 g, yield 96%, m.p. 148 °C). 1H NMR (400 MHz, CDCl3): δ 5.37 (m, 1H), 4.72 (m, 1H), 4.03 (s, 2H), 2.36 (m, 2H), 2.02–0.85 (m, 38H, cholesteryl protons), 0.67 (s, 3H); FTIR (KBr, cm−1): 2939, 2907, 2821, 1753, 1620, 1195.
4.
A mixture of 4-hydroxy benzaldehyde (1 g, 8.19 mmol) and K2CO3 (2.26 g, 16.38 mmol) was refluxed in dry CH3CN for 2 h and then compound 2 (4.55 g, 9.82 mmol) was added to it. The reaction mixture was refluxed for 5 h. Then the organic solvent was evaporated under reduced pressure and water was added to the crude mass. Then reaction mixture was extracted with 2% CH3OH in CHCl3. Evaporation of the solvent gave the crude product which was purified by column chromatography using 10% ethyl acetate in petroleum ether as an eluent to afford the pure compound 3 in 78% yield (3.50 g, m.p. 114 °C). 1H NMR (CDCl3, 400 MHz): δ 9.90 (s, 1H), 7.85 (d, 2H, J = 8 Hz), 7.01 (d, 2H, J = 8 Hz), 5.38 (d, 1H, J = 4 Hz), 4.75 (m, 1H), 4.68 (s, 2H), 2.35–0.67 (43H, cholesteryl protons); 13C NMR (CDCl3, 100 MHz): δ 190.7, 167.5, 162.6, 139.0, 131.9, 130.6, 123.2, 114.9, 75.6, 65.3, 56.6, 56.1, 49.9, 42.3, 39.6, 39.5, 37.9, 36.8, 36.5, 36.1, 35.7, 31.89, 31.82, 29.7, 28.2, 28.0, 27.6, 24.2, 23.8, 22.8, 22.5, 21.0, 19.2, 18.7, 11.8; FTIR (KBr) ν cm−1: 3403, 2945, 1775, 1701, 1606, 1212; HRMS (TOF MS ES+): calcd 549.3866 (M + 1)+, found 549.3890 (M + 1)+.
General procedure for a gelation test
The required amount of compound 1 was taken in the desired solvent (1 mL), slightly warmed to form a homogeneous solution and then allowed to cool to room temperature to form a gel. Stimuli responsive behaviour of the gel was investigated in the presence of different analytes in the same way. AgNO3 solution was prepared in CH3OH containing 0.01% H2O and Fe(NO3)3 solution was prepared in MeOH. The gels were tested via the usual inversion of the vial method. Samples of gels for SEM imaging were dried under vacuum and then coated with a thin layer of gold metal. The gel-to-sol transition temperature (Tgel) was measured by the dropping ball method.General procedure for fluorescence and UV-vis titrations
A stock solution of the compound 1 was prepared in CHCl3/CH3OH (3:1, v/v) in the concentration range of 10−5 M. Stock solutions of cations were prepared in the same solvent in the concentration range of 10−3 M. The solution of the compound (2 mL) was taken in the cuvette and to the solution different metal ions were individually added in different amounts. Upon addition of metal ions, the changes in emission of the compound were recorded. The same stock solutions were used for the UV-vis titration experiment in the same way.
Binding constant determination15
A Benesi–Hildebrand plot was adopted to determine the binding constant value using the expression: I0/(I − I0) = [εM/(εM − εC)](Ka−1Cg−1 + 1), where εM and εC represent molar extinction coefficients for the receptor structure 1 and the complex, respectively, at a selected wavelength, I0 denotes the emission intensity of the free receptor structure 1 at that specific wavelength and Cg is the concentration of the metal ion. The measured absorbance I0/(I − I0) as a function of the inverse of the metal ion concentration fits a linear relationship, indicating 1:1 stoichiometry of the receptor 1–metal ion complex. The ratio of the intercept to the slope was used to determine the binding constant Ka. Instead of fluorescence intensities, respective absorbance of the receptor structure was also used to get the binding constant values.
Calculation of detection limit16
The detection limit was calculated using the fluorescence and UV-vis titration data. The emission and absorbance of 1 were measured 5 times, and the standard deviation of a blank measurement was achieved. To have the slope, emission intensities and absorbance values were plotted against concentrations of metal ions. The detection limits were calculated using the equation: detection limit = 3σ/k, where σ is the standard deviation of the blank measurement, and k is the slope.Dye adsorption experiment1g
For this study, the gel of 1 [25 mg mL−1] was prepared in CHCl3/CH3OH (3:1, v/v) solvent in the presence of an equiv. amount of Ag+ and Fe3+ ions. Uranine solution was prepared in the concentration of c = 3 × 10⁻⁵ M in water. The dye removal efficiency (RE) of the gel phase from its aqueous solution (2 mL) was estimated using UV-vis spectroscopy (at 490 nm). The final concentration of the dye in solution was calculated according to the Beer–Lambert law (A = εcl, A is the absorbance of the dye at a certain absorption wavelength in solution, ε is the molar extinction coefficient and l is the path length of the incident light), which ultimately determined the removal efficiency of the dye via the equation: RE = (Ci − Cf)/Ci, in which Ci represents the initial concentration of the dye in solution; Cf is the final concentration of the dye in the presence of adsorbing gel.
Picric acid (PA) adsorption experiment1g
For this study, the gel of 1 [25 mg mL−1] was prepared in CHCl3/CH3OH (3:1, v/v) solvent in the presence of an equiv. amount of Ag+ and Fe3+ ions. Solutions of PA and other nitroaromatic compounds (3 mL) were prepared in the concentration c = 2 × 10⁻⁴ M, and for m-dinitrobenzene, c = 1 × 10⁻⁴ M. PA solution was prepared in pure water, while for other cases aqueous solutions containing 0.01% CH3CN were used for a clear solution. The removal efficiency (RE) of PA from its aqueous solution (2 mL) was estimated using UV-vis spectroscopy (at 354 nm), as described for the uranine adsorption experiment.
General statement on recyclability of the adsorption process using the metallogels
The metallogels as used in the adsorption process (dye/PA) were reusable with modification. The compound as isolated in the way mentioned in the text was unable to form a gel under the prescribed conditions and therefore, it was difficult to use directly in the next cycle. The non gelation indicated either the absence or inappropriate amount of metal ions (Fe3+/Ag+) in the isolated gelator. However, addition of the required amount of the metal salts (Fe3+/Ag+) to the recovered gelator furnished an instant gel which can be reused successfully in the adsorption process.Conflicts of interest
There are no conflicts to declare.Acknowledgements
AP thanks CSIR, New Delhi, India for a fellowship. KG thanks SERB, DST, New Delhi, for financial support (File no. EMR/2016/008005/OC).References
- (a) J. W. Steed, Chem. Soc. Rev., 2010, 39, 3686 RSC; (b) M.-O. M. Piepenbrock, G. O. Lioyd, N. Clarke and J. W. Steed, Chem. Rev., 2010, 110, 1960 CrossRef CAS PubMed; (c) A. Y.-Y. Tam and V. W.-W. Yam, Chem. Soc. Rev., 2013, 42, 1540 RSC; (d) H. Maeda, Chem. – Eur. J., 2008, 14, 11274 CrossRef CAS PubMed; (e) K. Ghosh, A. Panja and S. Panja, New J. Chem., 2016, 40, 3476 RSC; (f) S. Panja, S. Bhattacharya and K. Ghosh, Mater. Chem. Front., 2018, 2, 385 RSC; (g) S. Panja, S. Bhattacharya and K. Ghosh, Langmuir, 2017, 33, 8277 CrossRef CAS PubMed; (h) S. Panja, S. Ghosh and K. Ghosh, New J. Chem., 2018, 42, 6488 RSC; (i) A. Panja and K. Ghosh, ChemistrySelect, 2018, 3, 1809 CrossRef CAS; (j) A. Panja and K. Ghosh, Mater. Chem. Front., 2018, 2, 186 Search PubMed; (k) A. Panja and K. Ghosh, ChemistrySelect, 2018, 3, 9448 CrossRef CAS.
- (a) R. G. Weiss and P. Terech, Molecular Gels, Springer, Dordrecht, 2006, p. 978 CrossRef; (b) F. Fages, Low Molecular Mass Gelators, Topics in Current Chemistry, Springer-Verlag, Berlin, 2005, 256, p. 283 Search PubMed; (c) S. S. Babu, V. K. Praveen and A. Ajayaghosh, Chem. Rev., 2014, 114, 1973 CrossRef CAS PubMed; (d) P. A. Gale, N. Busschaert, C. J. E. Haynes, L. E. Karagiannidis and I. L. Kirby, Chem. Soc. Rev., 2014, 43, 205 RSC; (e) M. Liu, G. Ouyang, D. Niua and Y. Sang, Org. Chem. Front., 2018, 5, 2885 RSC; (f) T. S. Mahapatra, H. Singh, A. Maity, A. Dey, S. K. Pramanik, E. Suresh and A. Das, J. Mater. Chem. C, 2018, 6, 9756 RSC; (g) A. Maity, A. Dey, M. K. Si, B. Ganguly and A. Das, Soft Matter, 2018, 14, 5821 RSC; (h) A. Maity, F. Ali, H. Agarwalla, B. Anothumakkool and A. Das, Chem. Commun., 2015, 51, 2130 RSC; (i) A. K. Mandal, M. Gangopadhyay and A. Das, Chem. Soc. Rev., 2015, 44, 663 RSC; (j) A. Maity, M. Gangopadhyay, A. Basu, S. Aute, S. S. Babu and A. Das, J. Am. Chem. Soc., 2016, 138, 11113 CrossRef CAS PubMed.
- (a) C. D. Jones and J. W. Steed, Chem. Soc. Rev., 2016, 45, 6546 RSC; (b) M. D. S. Maset, V. J. Nebot, J. F. Miravet and B. Escuder, Chem. Rev., 2013, 42, 7086 RSC; (c) N. M. Sangeetha and U. Maitra, Chem. Soc. Rev., 2005, 34, 821 RSC; (d) S. Datta and S. Bhattacharya, Chem. Soc. Rev., 2015, 44, 5596 RSC; (e) S.-M. Lu, J.-C. Huang, G.-T. Liu, Z.-W. Lin, Y.-T. Li, X.-H. Huang, C.-C. Huanga and S.-T. Wu, RSC Adv., 2017, 7, 30979 RSC.
- (a) A. Panja and K. Ghosh, Supramol. Chem., 2018, 30, 722 CrossRef CAS; (b) K. Ghosh, S. Panja and S. Bhattacharya, ChemistrySelect, 2017, 2, 959 CrossRef CAS; (c) A. Panja and K. Ghosh, New J. Chem., 2018, 42, 13718 RSC.
- (a) A. Caballero, R. Martinez, V. Lloveras, I. Ratera, J. V. Gancedo, K. Wurst, A. Tarraga, P. Molina and J. Veciana, J. Am. Chem. Soc., 2005, 127, 15666 CrossRef CAS PubMed; (b) R. Martinez, A. Espinosa, A. Taraga and P. Molina, Org. Lett., 2005, 7, 5869 CrossRef CAS PubMed; (c) M. Suresh, A. K. Mandal, S. Saha, E. Suresh, A. Mandoli, R. D. Liddo, P. P. Parnigotto and A. Das, Org. Lett., 2010, 12, 5406 CrossRef CAS PubMed; (d) A. K. Saini, K. Natarajan and S. M. Mobin, Chem. Commun., 2017, 53, 9870 RSC; (e) A. Ghosh, S. Adhikari, S. Ta, A. Banik, T. K. Dangar, S. K. Mukhopadhyay, J. S. Matalobos, P. Brandão, V. Félix and D. Das, Dalton Trans., 2016, 45, 19491 RSC; (f) K. Tiwari, S. Kumar, V. Kumar, J. Kaur, S. Arora and R. K. Mahajan, Spectrochim. Acta, Part A, 2018, 191, 16 CrossRef CAS PubMed; (g) T. Wei, G. Liang, X. Chen, J. Qi, Q. Lin, Y. Zhang and H. Yao, Tetrahedron, 2017, 73, 2938 CrossRef CAS PubMed; (h) D. Ray, E. S. S. Iyer, K. K. Sadhu and P. K. Bharadwaj, Dalton Trans., 2009, 5683 RSC.
- H. Svobodova, V. Noponen, E. Kolehmainen and E. Sievanen, RSC Adv., 2012, 2, 4985 RSC.
- (a) W. K. Jung, H. C. Koo, K. W. Kim, S. Shin, S. H. Kim and Y. H. Park, Appl. Environ. Microbiol., 2008, 74, 2171 CrossRef CAS PubMed; (b) A. Y. Y. Tam and V. W. W. Yam, Chem. Soc. Rev., 2013, 42, 1540 RSC.
- H. T. Ratte, Environ. Toxicol. Chem., 1999, 18, 89 CrossRef CAS.
- (a) T. A. Rouault, The role of iron regulatory proteins in mammalian iron homeostasis and disease, Nat. Chem. Biol., 2006, 2, 406 CrossRef CAS PubMed; (b) E. C. Theil and D. J. Goss, Chem. Rev., 2009, 109, 4568 CrossRef CAS PubMed.
- (a) J. F. Zhang, Y. Zhou, J. Yoon and J. S. Kim, Chem. Soc. Rev., 2011, 40, 3416 RSC; (b) S. K. Sahoo, D. Sharma, R. K. Bera, G. Crisponi and J. F. Callan, Chem. Soc. Rev., 2012, 41, 7195 RSC; (c) Y. S. Kim, G. J. Park, J. J. Lee, S. Y. Lee, S. Y. Lee and C. Kim, RSC Adv., 2015, 5, 11229 RSC; (d) A. Mitra, B. Ramanujam and C. P. Rao, Tetrahedron Lett., 2009, 50, 776 CrossRef CAS; (e) P. Kumar, V. Kumar and R. Gupta, RSC Adv., 2015, 5, 97874 RSC; (f) S. Sen, S. Sarkar, B. Chattopadhyay, A. Moirangthem, A. Basu, K. Dhara and P. Chattopadhyay, Analyst, 2012, 137, 3335 RSC.
- (a) J.-L. Zhong, X.-J. Jia, H.-J. Liu, X.-Z. Luo, S.-G. Hong, N. Zhanga and J.-B. Huang, Soft Matter, 2016, 12, 191 RSC; (b) J.-F. Chen, Q. Lin, H. Yao, Y.-M. Zhang and T.-B. Wei, Mater. Chem. Front., 2018, 2, 999 RSC.
- A. Y.-Y. Tam and V. W.-W. Yam, Chem. Soc. Rev., 2013, 42, 1540 RSC.
- (a) W. Lin, L. Yuan, J. Feng and X. Cao, Eur. J. Org. Chem., 2008, 2689 CrossRef CAS; (b) L. Wang, L. Yang and D. Cao, Sens. Actuators, B, 2014, 202, 949 CrossRef CAS.
- (a) J. Bachl, J. Mayr, F. J. Sayago, C. Cativiela and D. D. Diaz, Chem. Commun., 2015, 51, 5294 RSC; (b) Rajkamal, N. P. Pathak, D. Chatterjee, A. Paul and S. Yadav, RSC Adv., 2016, 6, 92225 RSC; (c) R. Roy, T. K. Adalder and P. Dastidar, Chem. – Asian J., 2018, 13, 552 CrossRef CAS PubMed.
- P. T. Chou, G. R. Wu, C. Y. Wei, C. C. Cheng, C. P. Chang and F. T. Hung, J. Phys. Chem. B, 2000, 104, 7818 CrossRef CAS.
- A. R. Sarkar, C. H. Heo, M. Y. Park, H. W. Lee and H. M. Kim, Chem. Commun., 2014, 50, 1309 RSC.
- (a) B. Adhikari, G. Palui and A. Banerjee, Soft Matter, 2009, 5, 3452 RSC; (b) P. Chakraborty, B. Roy, P. Bairi and A. K. Nandi, J. Mater. Chem., 2012, 22, 20291 RSC.
- (a) B. O. Okesola and David K. Smith, Chem. Soc. Rev., 2016, 45, 4226 RSC; (b) S. Samai and K. Biradha, Chem. Mater., 2012, 24, 1165 CrossRef CAS; (c) P. C. Thomas, B. H. Cipriano and S. R. Raghavan, Soft Matter, 2011, 7, 8192 RSC.
- N. Venkatramaiah, S. Kumar and S. Patil, Chem. Commun., 2012, 48, 5007 RSC.
- (a) D. Ownby, J. Belden, G. Lotufo and M. Lydy, Chemosphere, 2005, 58, 1153 CrossRef CAS PubMed; (b) P. Robidoux, J. Hawari and S. Thiboutot, Environ. Toxicol. Chem., 1999, 23, 1026 CrossRef; (c) A. H. Harris, O. F. Binkley and B. M. Chenoweth, Am. J. Public Health, 1946, 36, 727 CrossRef CAS.
- (a) X. Cao, N. Zhao, H. Lv, Q. Ding, A. Gao, Q. Jing and T. Yi, Langmuir, 2017, 33, 7788 CrossRef CAS PubMed; (b) V. Bhalla, H. Singh, M. Kumar and S. K. Prasad, Langmuir, 2011, 27, 15275 CrossRef CAS PubMed; (c) V. Bhalla, A. Gupta, M. Kumar, D. S. S. Rao and S. K. Prasad, ACS Appl. Mater. Interfaces, 2013, 5, 672 CrossRef CAS PubMed; (d) Z. Hu, B. J. Deibert and J. Li, Chem. Soc. Rev., 2014, 43, 5815 RSC.
Footnote |
| † Electronic supplementary information (ESI) available: Figures showing the gelation profile, gel pics, FTIR data, UV-vis titration plots of 1 with various metal ions, binding constant and detection limit plots and other spectral plots, comparison table, and characterization spectra. See DOI: 10.1039/c8qm00433a |
| This journal is © the Partner Organisations 2018 |