Sharp-featured Au@Ag core/shell nanocuboid synthesis and the label-free ultrasensitive SERS detection of protein single-point mutations†
Guopeng
Tu‡
a,
Ntirikwendera
Deogratias‡
a,
Meng
Xu
*a,
Xiaowei
Li
 b,
Jiajia
Liu
 a,
Lan
Jiang
b,
Yanlian
Yang
c and
Jiatao
Zhang
 *a
*a
aBeijing Key Laboratory of Construction-Tailorable Advanced Functional Materials and Green Applications, School of Materials Science & Engineering, Beijing Institute of Technology, Beijing, 100081, China. E-mail: xumeng@bit.edu.cn; zhangjt@bit.edu.cn
bSchool of Mechanical Engineering, Beijing Institute of Technology, Beijing, 100081, China
cNational Center for Nanoscience and Technology, Chinese Academy of Sciences (CAS), Beijing, 100190, China
First published on 18th July 2018
Abstract
Sharp-featured Au@Ag core/shell nanocuboids were synthesized. Simulation and experimental results demonstrated that the sharp features and in-cuboid, out-of-cuboid LSPR coupling of the nanocuboids enabled high SERS activities. The ultrasensitive detection of single-point mutations of TDP-43 proteins was demonstrated at 10 pM for the first time. This could be a general strategy for single-point mutation detection in proteins.
Introduction
Surface enhanced Raman scattering (SERS) is a powerful technique for ultrasensitive biodetection by enhancing the electromagnetic field (E-field) generated by a localized surface plasmon resonance (LSPR) effect.1 Nanoparticles (NPs) with “hot spots” generated by nanogap LSPR coupling between adjacent NPs and sharp features allow amplifying SERS signals.2 Because of the strong LSPR effect in the near infrared (NIR) region and their tailorable shapes, Au, Ag-based NPs as SERS substrates have received extensive attention for biodetection.3 Anisotropic Au stars, Ag nanobars, Ag octahedra, Ag decahedra, Ag bipyramids, Au prisms, Au NP aggregate systems4–11 and Au NP nanogaps12,13 for enhancing the E-field have been developed as SERS substrates. To maximize the SERS signal, integrating the sharp features with nanogap LSPR coupling into one sharp-featured Au/Ag hybrid NP (e.g. Au@Ag core/shell nanocuboid) system is an effective approach to create a synergistic effect for amplifying SERS signals. Ag shows better plasmonic enhancement than Au;14 but because of their poor chemical stability,1 anisotropic Ag NPs with sharp features remain very challenging. Polyol reduction is the most widely used method to synthesize Ag nanocuboids (NCs). However, the polyol reduction reaction is very sensitive to the ion impurities and water content, and always requires a high reaction temperature. More importantly, Ag nanocubes synthesized using the polyol process tend to be rounded at corners and edges.15 Hence, for promoting the biodetection applications of sharp-featured Au@Ag core/shell NCs, it is necessary to develop an Au@Ag core/shell NC aqueous synthetic method which can be carried out under facile reaction conditions and facilitate the formation of sharp edges and corners. Furthermore, water-based synthesis is anticipated to be environmentally more friendly, offering more flexibility and convenience for execution.Numerous SERS substrates have been developed for biodetection.16 Ultrasensitive detection of low-abundance disease-related proteins is crucial for early diagnosis, disease prognosis and therapeutic response assessment.1,17,18 Furthermore, detection of single-point mutations in proteins is indispensable for biochemistry, proteomics and disease diagnosis as well.19 For instance, the pathogenic point mutations of neurodegenerative disease related amyloid proteins have different effects on neurotoxicity.20 The detection of protein single-point mutations has mainly been based on immunoassays recently. But using antibodies for immunoassays has some fundamental limitations, including complex analytical procedures, high cost, limited stability and loss of intrinsic chemical structural information.21 Because of the ultrasensitive structural fingerprint and trace-level detection of SERS, it can be used to detect the single-point mutation protein and low-abundance neurodegenerative disease related proteins.
Herein, monodisperse sharp-featured Au@Ag core/shell NCs with controlled aspect ratios (ARs) have been synthesized in an aqueous phase following the process shown in Fig. 1A. The Au@Ag core/shell NCs can also self-assemble on the substrate with ca. 2 nm nanogaps between adjacent NCs. The sharp features and in-cuboid, out-of-cuboid LSPR coupling of Au@Ag core/shell NCs enabled high SERS activity. In addition, the finite element method (FEM) simulation of E-field enhancement was carried out to reveal that the Au@Ag core/shell NC assemblies induced improvements in the E-field enhancement and LSPR properties. We demonstrated the application for label-free SERS detection for the core region of the amyotrophic lateral sclerosis (ALS) related protein, TAR DNA-binding protein-43 (TDP-43), under 10 pM concentrations for the first time. More significantly, we differentiated the wild-type TDP-43 (Wt) protein and its single-point mutations (phosphorylated A315T mutant (pA315T) and A315E mutant TDP-43 (A315E)) via label-free SERS under 10 pM. The sequences for Wt, pA315T, and A315E are shown in Scheme S1 (ESI†). This is a big step forward in ultra-sensitive and rapid low-abundance protein detection.
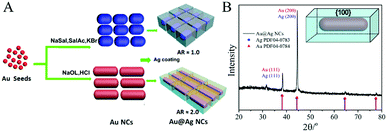 | ||
| Fig. 1 (A) Synthesis scheme of Au@Ag core/shell cuboid NCs with different ARs. (B) XRD spectra of Au@Ag core/shell NCs, confirming the abundance of {100} facets. | ||
Experimental
Chemicals and reagents
Chloroauric acid tetrahydrate (HAuCl4·4H2O), silver nitrate (AgNO3), L-ascorbic acid (AA) and sodium borohydride (NaBH4) were purchased from Tianjin Guangfu Technology Development Co. Ltd. Sodium salicylate (C7H5NaO3), cetyltrimethylammonium bromide (CTAB), and benzyl dimethylammonium chloride (BDAC) were purchased from Sigma Aldrich Life Science and High Technology Co. Ltd. Deionized water (DI water) was used throughout the experiments. All the Wt, pA315T, and A315E proteins (purity >98%) were purchased from Shanghai Science Peptide Biological Technology Co., Ltd.Synthesis of gold nanorods (Au NRs)
Colloidal Au seeds were prepared by the reduction of auric acid (HAuCl4) with a strong reducing agent (NaBH4) in the presence of CTAB. Typically, 5.0 mL 0.5 mM HAuCl4 was mixed with 5.0 mL 0.2 M CTAB solution. Then, 0.6 mL 0.01 M NaBH4 (ice-cold, freshly prepared) was quickly injected into the mixture under vigorous stirring. The seed solution was stirred for 2 minutes; the colour changed from yellow to yellowish-brown. Then the solution was left undisturbed for 30 minutes before use. Basically, we prepared two kinds of growth solutions: one with sodium salicylate, salicylic acid and potassium bromide as additives and the other with sodium oleate and HCl as additives; hence two sets of Au NRs with different ARs were synthesized. To prepare the first kind of Au NR growth solution, 9 g of CTAB with a well-defined amount of an aromatic additive (sodium salicylate, NaSal 0.8 g, KBr 3.5 g, salicylic acid 1.75 g) were dissolved in 250 mL DI water at 60 °C. The solution was cooled to 30 °C and then 1.8 mL of 4.0 mM AgNO3 was added. The mixture was kept undisturbed at 30 °C for 15 minutes, followed by the addition of 250 mL 1.0 mM HAuCl4. The solution became colourless after 15 minutes and 1.25 mL 64 mM AA was added. Finally, 0.8 mL of the seed solution was injected into the growth solution and the mixture solution was vigorously stirred for another 30 seconds and then left undisturbed at 30 °C for 12 hours. The resulting Au NRs were collected by centrifugation at 8500 rpm for 25 minutes followed by the removal of the supernatant and finally dispersed in 30 mL of water. For the second growth solution, 9 g CTAB were mixed with 1.2 g sodium oleate (NaOL). The mixture was dissolved into 250 mL DI water at 60 °C. After adding AgNO3 (12 mL, 4 mM), the solution was cooled down to 30 °C and 250 mL 0.001 M HAuCl4 solution was added, and the whole mixture was slowly stirred at 400 rpm for 1.5 hours. Then 1 mL 0.064 M AA and 0.8 mL Au seed solution were injected. The whole mixture was left undisturbed for 12 hours at 30 °C. Au NRs were collected by centrifugation at 7000 rpm for 20 minutes and dispersed into water.Silver coating method
The Ag shell coating was successful using a binary surfactant mixture (CTAB/BDAC). In a typical procedure, 2 mL of the as-prepared Au NRs were sequentially added to 2.5 mL BDAC (0.15 M), 0.051 g CTAB, 21 mL H2O, 0.2 mL AgNO3 (0.02 M), and 2 mL AA (0.1 M), and finally 4 mL H2O was added. After that, the mixture was heated in an oven at 80 °C for 15 hours. For size control of the Ag shell, different concentrations (0.01–0.03 M) and volumes (0.2, 0.3, 0.4, and 0.5 mL) of AgNO3 were used. To study the effect of the time of reaction and temperature, we controlled the reaction in the temperature range from 70 to 100 °C for 6 hours. During the Ag shell coating, both oil bath (with stirring) and solvothermal approaches were used to determine which approach was more efficient. After the reaction, Au@Ag NCs were collected by centrifugation at 7000 rpm for 20 minutes and then washed with water once and finally dispersed in DI water.Characterization
Results and discussion
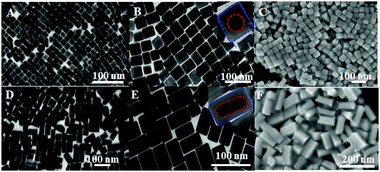
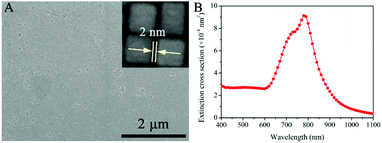
In the synthesis of Au@Ag core/shell NCs, two sizes of Au NRs with different ARs were chosen as the starting materials. As shown in Fig. 1A, Au NRs with ARs ∼ 1 and 2 as cores were produced (Au-1, Fig. S1A, and Au-2, Fig. S1B, ESI†). Au@Ag core/shell NCs were formed by depositing Ag on the Au core. X-ray diffraction (XRD) analysis confirmed the Au@Ag NCs (Fig. 1B), namely, the cubic phase Au (JCPDS No. 04-0784) and cubic phase Ag (JCPDS No. 04-0783). The peaks were assigned to diffraction from the (200) and (111) planes of face-centered-cubic (fcc) Au and Ag, respectively. It is worth noting that the ratio between the intensities of the (200) and (111) diffraction peaks was higher than the conventional value (0.67 versus 0.4), indicating that our Ag nanocuboids were abundant in {100} facets.Low resolution transmission electron microscopy (LRTEM) images of the Au@Ag NCs with different ARs (Fig. 2A, B D and E) indicated that sharp-featured Au@Ag core/shell NCs with high uniformity were synthesized successfully. Furthermore, the AR of the Au@Ag core/shell NCs can be precisely tailored from 1 (Au@Ag-1, Fig. 2A and B) to 2 (Au@Ag-2, Fig. 2D and E). The mean lengths and widths were 40 ± 3 nm and 42 ± 3 nm for Au@Ag-1 and 104 ± 5 nm and 52 ± 6 nm for Au@Ag-2, respectively. Fig. 2C and F shows the scanning electron microscopy (SEM) images of the Au@Ag NCs with different ARs. Combined with TEM results, it has clearly demonstrated that the as-prepared Au@Ag NCs with different ARs both had sharp features. In addition, the SEM image (Fig. 3A) showed that the array of Au@Ag NCs can self-assemble into an ordered structure on the surface with ca. 2 nm nanogaps between the adjacent Au@Ag NCs. As illustrated in high resolution TEM (HR-TEM) images (Fig. S4, ESI†), Au@Ag NCs showed highly crystalline and well-defined lattice fringes. The indexed lattice spacing for the Ag shell of 0.232 nm was in good agreement with the interplanar distances of the (200) planes for fcc Ag (JCPDS No. 04-0783).
The high resolution lattice contrast difference at the interface confirmed the direct contact between the Au core and Ag shell regardless of the core shape. The HRTEM images and scanning TEM (STEM) images (Fig. S4C and D, ESI†) of the Au@Ag core/shell NCs with different ARs also further confirmed the clear interface and the independent control of the size and shape for the Au core and Ag shell. Energy-dispersive X-ray (EDX) line profiling (Fig. S4B, ESI†) and the elemental mapping under STEM mode (Fig. S4C and D, ESI†) revealed that Au and Ag atoms were both homogeneously distributed throughout the Au@Ag core/shell NCs, suggesting that Ag was epitaxially grown on the Au core.
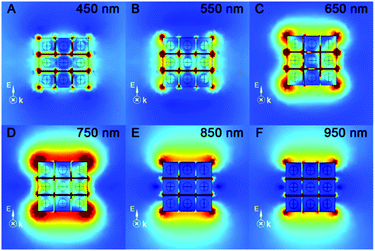
The ultraviolet–visible–near infrared (UV-vis-NIR) spectra of the as-prepared Au-1/2 NR and Au@Ag-1/2 NC colloids (Fig. S5, ESI†) have demonstrated the extinction peaks. The longitudinal mode SPR peaks of Au-1 and Au-2 appeared at 710 and 730 nm, respectively. After coating, they blue-shifted to 460 and 680 nm with an obvious broadening. In order to theoretically confirm the “hot spot” and enhanced E-field on the Au@Ag NCs as the SERS substrate, we performed FEM simulation to study the UV-vis-NIR extinction (Fig. 3B) and the E-field enhancement of the Au@Ag NC assemblies at different wavelengths (Fig. 4).
Because the Au@Ag-1 NCs had more corners and edges in the unit area compared with the Au@Ag-2 NCs, we studied the extinction properties of Au@Ag-1 NCs as SERS active substrate materials only. The theoretical simulation of the Au@Ag-1 NC assemblies indicated the maximal LSPR extinction appearing at 760–800 nm (Fig. 3B and Fig. S5A, ESI†), which dramatically red-shifted to the NIR region compared with the Au@Ag NC colloid because of the out-of-cuboid LSPR coupling at the nanogaps of the Au@Ag core/shell NC assemblies.
According to a reported study, when LSPR NPs come into close proximity to each other (<5 nm), the LSPR coupling at the nanogaps can enhance the E-fields of the plasmonic NP system.22 Hence, the formation of the Au@Ag-1 NC assembly can enhance the E-field not only via the strong LSPR effect of Au core, Ag shell and Au/Ag in-cuboid LSPR coupling, but also via the Au@Ag NC out-of-cuboid LSPR coupling generated at the nanogaps. The in-cuboid and out-of-cuboid LSPR coupling E-field enhancement can help in improving SERS performances for the Au@Ag core/shell NCs as active substrate materials. Considering the strong E-field enhancement induced LSPR of the Au@Ag-1 NCs in the NIR region, the ultrasensitive SERS detection of amyloid proteins was carried out by 785 nm laser excitation. We took SERS spectra of Wt, pA315T and A315E TDP-43 monomers in the 600–1800 cm−1 range (Fig. 5) at 10 pM using both the Au@Ag-1 NCs and Si wafers as substrates. The Au@Ag-1 NC substrate yielded good signal-to-noise spectra with an enhancement factor of 1.4 × 10¹⁰ (SI-1 and Fig. S6, ESI†). By contrast, the Raman signals of the proteins (10 pM) on the Si substrate can barely be seen. The assignments of the bands in the SERS spectra of TDP-43 proteins are shown in Table S1 (ESI†).
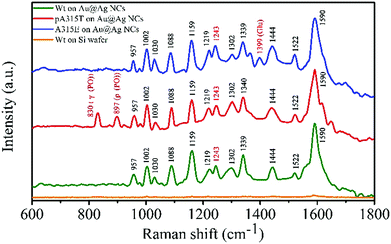 | ||
| Fig. 5 SERS spectra of Wt (10 pM), pA315T (10 pM), and A315E (10 pM) TDP-43 monomers on Au@Ag core/shell NC assemblies and Si wafer substrates. | ||
The Raman bands were assigned on the basis of the existing literature pertaining to the spectra of amino acids and proteins.23 Aromatic rings, amides, and carboxylic group vibrations dominated the SERS spectrum of TDP-43. For 10 pM TDP-43, we observed Raman bands associated with the aromatic side chains at 1002, 1030, 1159, and 1590 cm−1 for Phe residues. The presence of these bands indicated that the aromatic side chains were in a favourable position with respect to the Au@Ag NC surfaces. The striking differences of the TDP-43 Wt, pA315T and A315E SERS spectra were the appearance of bands at 830 and 897 cm−1 of pA315T and at 1399 cm−1 of A315E, which can be attributed to the phosphate group24 and the Glu residues, respectively.25,26 In addition, the peak at 1243 cm−1 indicated the random coil structure for Wt, pA315T and A315E monomers in water.27,28 The ultrasensitive single-point mutation SERS detection for proteins was fit for the His and Pro residues as well. The rapid, accurate and ultrasensitive detection of single-point mutations in proteins is a huge challenge in biochemistry, and it is an urgent need in both basic research and clinical applications. These results demonstrated the feasibility of ultrasensitive detection of single-point mutations in proteins by SERS, which has few reports until now.
Conclusions
In summary, Au@Ag core/shell NCs with sharp features and different ARs were successfully synthesised. Theoretical and experimental results demonstrate that the sharp features and in-cuboid, out-of-cuboid LSPR coupling of the Au@Ag core/shell NCs can significantly improve the E-field enhancement in SERS detection. More significantly, we achieved label-free SERS detection for different mutants of TDP-43 proteins at 10 pM, which is a big step forward in ultra-sensitive and rapid low-abundance protein detection.Conflicts of interest
There are no conflicts to declare.Acknowledgements
This work was supported by the National Natural Science Foundation of China (51631001, 91323301, 21643003 and 51501010). We thank Prof Chen Wang of the National Centre for Nanoscience and Technology, China, for SERS measurements and helpful discussions.Notes and references
- L. A. Lane, X. Qian and S. Nie, Chem. Rev., 2015, 115, 10489 CrossRef PubMed.
- S. L. Kleinman, B. Sharma, M. G. Blaber, A. Henry, N. Valley, R. G. Freeman, M. J. Natan, G. C. Schatz and R. P. Van Duyne, J. Am. Chem. Soc., 2013, 135, 301 CrossRef PubMed.
- J. Li, J. R. Anema, T. Wandlowskic and Z. Q. Tian, Chem. Soc. Rev., 2015, 44, 8399 RSC.
- W. Niu, Y. A. A. Chua, W. Zhang, H. Huang and X. Lu, J. Am. Chem. Soc., 2015, 137, 10460 CrossRef PubMed.
- B. J. Wiley, Y. Chen, J. M. McLellan, Y. Xiong, Z. Li, D. Ginger and Y. Xia, Nano Lett., 2007, 7, 1032 CrossRef PubMed.
- Y. G. Sun and Y. N. Xia, Science, 2002, 298, 2176 CrossRef PubMed.
- M. J. Mulvihill, X. Y. Ling, J. Henzie and P. Yang, J. Am. Chem. Soc., 2010, 132, 268 CrossRef PubMed.
- R. Jin, Y. Cao, C. A. Mirkin, K. L. Kelly, G. C. Schatz and J. Zheng, Science, 2001, 294, 1901 CrossRef PubMed.
- H. Yoo, J. E. Millstone, S. Li, J. Jang, W. Wei, J. Wu, G. C. Schatz and C. A. Mirkin, Nano Lett., 2009, 9, 3038 CrossRef PubMed.
- L. Chen, F. Ji, Y. Xu, L. He, Y. Mi, F. Bao, B. Sun, X. Zhang and Q. Zhang, Nano Lett., 2014, 14, 7201 CrossRef PubMed.
- P. J. Huang, L. K. Chau, T. S. Yang, L. L. Tay and T. T. Lin, Adv. Funct. Mater., 2009, 19, 242 CrossRef.
- H. Wang, C. S. Levin and N. J. Halas, J. Am. Chem. Soc., 2005, 127, 14992 CrossRef PubMed.
- D. K. Lim, K. S. Jeon, J. H. Hwang, H. Kim, S. Kwon, Y. D. Suh and J. M. Nam, Nat. Nanotechnol., 2011, 6, 452 CrossRef PubMed.
- C. Gao, Y. Hu, M. Wang, M. Chi and Y. Yin, J. Am. Chem. Soc., 2014, 136, 7474 CrossRef PubMed.
- Q. Zhang, W. Li, C. Moran, J. Zeng, J. Chen, L. P. Wen and Y. Xia, J. Am. Chem. Soc., 2010, 132, 11372 CrossRef PubMed.
- A. Barhoumi and N. J. Halas, J. Am. Chem. Soc., 2010, 132, 12792 CrossRef PubMed.
- J. Chen, L. Guo, B. Qiu, Z. Lin and T. Wang, Mater. Chem. Front., 2018, 2, 835 RSC.
- Y. Hu, Y. Huang, C. Tan, X. Zhang, Q. Lu, M. Sindoro, X. Huang, W. Huang, L. Wang and H. Zhang, Mater. Chem. Front., 2017, 1, 24 RSC.
- A. Abedini, F. Meng and D. P. Raleigh, J. Am. Chem. Soc., 2007, 129, 113001 CrossRef PubMed.
- M. Xu, Z. Zhu, J. Liu, Y. Yang, J. Y. Wu and C. Wang, J. Struct. Biol., 2013, 181, 11 CrossRef PubMed.
- L. Guerrini, R. Arenal, B. Mannini, F. Chiti, R. Pini, P. Matteini and R. A. Alvarez-Puebla, ACS Appl. Mater. Interfaces, 2015, 7, 9420 CrossRef PubMed.
- W. Bao, M. Melli, N. Caselli, F. Riboli, D. S. Wiersma, M. Staffaroni, H. Choo, D. F. Ogletree, S. Aloni, J. Bokor, S. Cabrini, F. Intonti, M. B. Salmeron, E. Yablonovitch, P. J. Schuck and A. Weber-Bargioni, Science, 2012, 338, 1317 CrossRef PubMed.
- G. V. P. Kumar, B. A. A. Reddy, M. Arif, T. K. Kundu and C. Narayana, J. Phys. Chem. B, 2006, 110, 16787 CrossRef PubMed.
- E. Podstawka-Proniewicz, N. Piergies, D. Skołuba, P. Kafarski, Y. Kim and L. M. Proniewicz, J. Phys. Chem. A, 2011, 115, 11067 CrossRef PubMed.
- T. Brulé, H. Yockell-Lelièvre, A. Bouhélier, J. Margueritat, L. Markey, A. Leray, A. Dereux and E. Finot, J. Phys. Chem. C, 2014, 118, 17975 CrossRef.
- I. Choi, Y. S. Huh and D. Erickson, Microfluid. Nanofluid., 2012, 12, 663 CrossRef.
- I. Chou, M. Benford, H. T. Beier and G. L. Coté, Nano Lett., 2008, 8, 1729 CrossRef PubMed.
- D. Kurouski, T. Deckert-Gaudig, V. Deckert and I. K. Lednev, J. Am. Chem. Soc., 2012, 134, 13323 CrossRef PubMed.
Footnotes |
| † Electronic supplementary information (ESI) available. See DOI: 10.1039/c8qm00185e |
| ‡ These authors contributed equally. |
| This journal is © the Partner Organisations 2018 |

