Few-layer graphitic shells networked by low temperature pyrolysis of zeolitic imidazolate frameworks†
Yinxiang
Chen
a,
Wei
Zhang
a,
Xiangfen
Jiang
 *a,
Yusuf Valentino
Kaneti
 b,
Daiming
Tang
b,
Xuebin
Wang
b,
Daiming
Tang
b,
Xuebin
Wang
 c,
Abdulmohsen Ali
Alshehri
d,
Jungmok
You
e,
Yusuke
Yamauchi
 befg and
Ming
Hu
 *a
*a
aState Key Laboratory of Precision Spectroscopy (East China Normal University), Shanghai, 200241, China. E-mail: mhu@phy.ecnu.edu.cn
bInternational Center for Materials Nanoarchitectonics (WPI-MANA), National Institute for Materials Science (NIMS), 1-1 Namiki, Tsukuba, 305-0044, Japan
cCollege of Engineering and Applied Sciences, Nanjing University, Jiangsu Province, Nanjing, China
dDepartment of Chemistry, King Abdulaziz University, P.O. Box. 80203, Jeddah 21589, Saudi Arabia
eDepartment of Plant & Environmental New Resources, Kyung Hee University, 1732 Deogyeong-daero, Giheunggu, Yongin-si, Gyeonggi-do 446-701, South Korea
fAustralian Institute for Innovative Materials (AIIM), University of Wollongong, NSW 2500, Australia
gSchool of Chemical Engineering & Australian Institute for Bioengineering and Nanotechnology (AIBN), The University of Queensland, Brisbane, QLD 4072, Australia
First published on 22nd January 2018
Abstract
Few-layer graphitic shell networks show great promise in energy storage applications such as electrochemical accommodation of alkaline ions. However, the networking and graphitization processes remain a challenge because of the complicated procedures and high temperature used for fabrication. In this work, we report a simple synthetic method by employing low-temperature solid-state pyrolysis of ZIF-67 crystals to weave graphitic shells consisting of 3–10 layers into capsules. Owing to their unique structure, the few-layer graphitic shell networks show excellent electrochemical performance for fast sodium ion storage.
1. Introduction
Several carbon family members, such as diamond, fullerene, graphite, carbon nanotubes, and graphene, have been extensively studied owing to their unique properties.1–24 Graphitic shells, i.e. carbon onions, are spherical particles with curled layers.25–28 Their high electrical conductivity and unique microstructure drive the graphitic shells to show great promise in lubrication, catalysis, and electrochemical energy storage (EES) applications.29–34 To date, several synthetic approaches have been reported, such as arc discharge, electron beam irradiation, catalytic decomposition of carbon-containing precursors, heat treatment of nano-diamonds, mechanical milling, carbon ion beam implantation, and detonation reactions.35–45 However, the graphitic shells obtained using these methods are usually present in isolated or aggregated forms. Therefore, a large amount of voids/interfaces exist among the graphitic shells (Scheme 1a) which hinder electron/ion transport, therefore causing obstacles in applications which require good connectivity between the graphitic shells.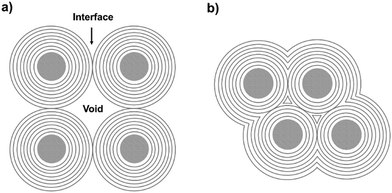 | ||
| Scheme 1 (a) Aggregates of carbon onion particles with many voids/interfaces among the particles. (b) Graphitic shell networks with less voids/interfaces. | ||
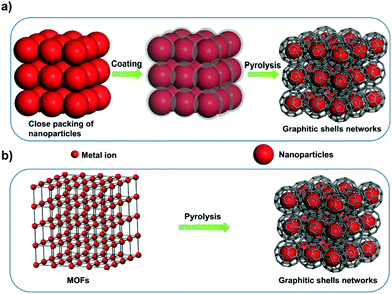
Interconnecting the graphitic shells into networks is a possible way to minimize the amount of voids/interfaces (Scheme 1b). So far, most of the fabrication methods have depended on a rational strategy (Fig. 1a): (i) close packing of catalytic/non-catalytic nanoparticles with carbon-rich precursors anchored on the surface or deposited in interstitial voids and (ii) carbonization of these precursors to form networks.46 Apparently, this strategy requires complicated operations to realize close packing and subsequent coating of the catalytic nanoparticles. In addition, the use of high-temperature (>1000 °C) treatment cannot be avoided. Therefore, the development of a simple way to fabricate graphitic shell networks at a low temperature is highly needed.
We note that some particular types of metal–organic frameworks (MOFs) contain catalytic metal ions/clusters (i.e. Co, Fe, Ni, etc.) which are located in the whole frameworks periodically (Fig. 1b). Furthermore, the metal ions/clusters are surrounded by carbon-rich organic molecules.47–65 Herein, the direct pyrolysis of these MOFs can lead to amorphous carbons embedded with catalytic metal nanoparticles firstly. Then, the graphitization of the amorphous carbons near these nanoparticles can lead to the formation of graphitic shell networks. Although this concept seems to be straightforward, the obtained graphitic carbons usually consist of thick graphitic layers (more than 30 layers) and not few-layer graphitic shells (Fig. S1, ESI†). After analyzing the carbonization process, we deduce that the high temperature (usually >800 °C to guarantee high graphitic degree) employed in pyrolysis of MOFs may cause serious aggregation of the metal nanoparticles and fast graphitization of carbons, hindering the preferred graphitization which occurs around the well-distributed metal nanoparticles. Therefore, we assume that a gradual evolution of graphitic shell networks can be realized by reducing the pyrolysis temperature. As a demonstration of this concept, we report the synthesis of few-layer graphitic shell networks through the low-temperature pyrolysis (450 °C) of a Co-containing MOF, such as zeolitic imidazolate frameworks (ZIF-67). An interesting structural evolution process is proposed on the basis of ex situ characterization. The obtained graphitic shell capsules exhibit excellent electrical conductivity and show good promise as an anode material for Na-ion batteries. Furthermore, a prototype half-cell shows stable charge–discharge cycling performance.
2. Experimental section
Materials
Co(NO3)2·6H2O, methanol and nano-diamonds were purchased from Sinopharm Chemical Reagent Co. 2-Methylimidazole was purchased from Alfa Aesar. All the products were used without further purification.Synthesis of ZIF-67
Co(NO3)2·6H2O (5.88 g) was dissolved in 500 mL of methanol to form solution A. 2-Methylimidazole (6.626 g) was dissolved in another 500 mL of methanol to form solution B. Then, solution B was poured into solution A under magnetic stirring for 10 min and aged for 24 h at room temperature. The product was collected by centrifugation and washed with methanol three times. Finally, the sample was dried at 100 °C under vacuum for 24 h.Synthesis of graphitic shell networks
The as-prepared ZIF-67 particles were directly carbonized at 450 °C for 48 h under N2 protection. Then, the products were treated with HCl (37%) and washed with deionized water several times. Eventually, the samples were dried at 100 °C under vacuum for 24 h.Synthesis of carbon onion particles
The nano-diamonds were directly carbonized at 1200 °C for 5 h, and labeled as carbon onion particles.Characterization
Morphological studies of the samples were performed using both field emission scanning electron microscope (FESEM, Hitachi S-4800), and transmission electron microscope (TEM, JEOL JEM-2100 F). Wide-angle powder X-ray diffraction (XRD) patterns were collected using a Rigaku Smartlab diffractometer with mono-chromated Cu-Kα radiation (35 kV, 25 mA). N2 adsorption–desorption isotherms were measured by an Autosorb IQ Gas Sorption System at 77 K. The Raman spectra were collected using a Thermo Fisher DXR. X-ray photoelectron spectroscopy (XPS) analysis was performed using a Thermo Fisher X-ray photoelectron spectrometer system equipped with an Al radiation probe (K-alpha, Thermo Scientific ESCALAB 250 Xi USA).Electrochemical tests
A coin cell (CR 2032) was used as a testing battery. To prepare the working electrode, the as-obtained material (80%), Ketjen Black (10%), and poly(vinylidenedifluoride) (10%) were mixed in N-methyl-2-pyrrolidone (NMP). The slurry was coated onto a copper current collector and dried at 100 °C overnight in a vacuum oven. The typical mass loading of the electrode was about 2 mg cm−2. Glass fibers (GF/D) from What-man® were utilized as a separator.Sodium-ion batteries (SIBs)
Sodium metal was utilized as both the counter and reference electrodes. The electrolyte was 1 M NaClO4 in ethylene carbonate (EC) and propylene carbonate (PC) (1![[thin space (1/6-em)]](https://www.rsc.org/images/entities/char_2009.gif) :
:![[thin space (1/6-em)]](https://www.rsc.org/images/entities/char_2009.gif) 1 in volume) with 5% of fluorinated ethylene carbonate (FEC). All coin cells were assembled in an argon-filled glove box with moisture and oxygen levels below 0.1 ppm. The galvanostatic charge/discharge profiles were investigated using a Land CT 2001A battery test system (Wuhan, China). The cyclic voltammetry (CV) curves were measured on a CHI electrochemical workstation (CHI, 660 E). The mass of the active material was based on the mass of the sample without counting Co (about 15% in the electrode).
1 in volume) with 5% of fluorinated ethylene carbonate (FEC). All coin cells were assembled in an argon-filled glove box with moisture and oxygen levels below 0.1 ppm. The galvanostatic charge/discharge profiles were investigated using a Land CT 2001A battery test system (Wuhan, China). The cyclic voltammetry (CV) curves were measured on a CHI electrochemical workstation (CHI, 660 E). The mass of the active material was based on the mass of the sample without counting Co (about 15% in the electrode).
3. Results and discussion
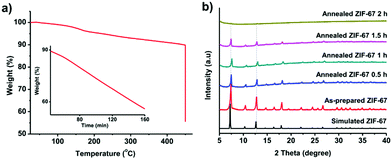
We firstly prepared the ZIF-67 crystals which serve as precursors for the formation of graphitic shell networks. Fig. S2 (ESI†) shows the scanning electron microscopy (SEM) image of the as-prepared ZIF-67 crystals. The obtained ZIF-67 crystals exhibit polyhedral morphology with an average size of 600 ± 100 nm. The powder X-ray diffraction (PXRD) pattern confirms that the obtained ZIF-67 crystals exhibit zeolitic structure with high crystallinity and purity (Fig. S3, ESI†). As our concept is based on the in situ graphitization around the auto-generated Co nanoparticles, it is important to avoid self-graphitization of the carbons which are far away from the Co nanoparticles by setting the annealing temperature to be as low as possible. For instance, annealing of the ZIF-67 crystals at 800 °C for 48 h resulted in thick graphitic domains rather than forming few-layered shells as shown in Fig. S1 (ESI†).To find the lowest decomposition temperature for ZIF-67 crystals, we employed thermogravimetric (TG) analysis (Fig. 2a). We noted that a slight weight loss of ZIF-67 occurred at 450 °C. As such, we kept the temperature at 450 °C for 2 h under N2 atmosphere. The weight loss of ZIF-67 reached up to 45 wt%, indicating complete decomposition of the ZIF-67 crystals (inset of Fig. 2a). The collapse of the framework was supported by the time-dependent ex situ PXRD patterns (Fig. 2b). The intensity of the diffraction peaks of the ZIF-67 crystals gradually decreased upon heating at 450 °C, and finally disappeared after 2 h. The collapse of the structure and the color change of the samples (from purple to black, Fig. S4, ESI†) suggest that a temperature of 450 °C is sufficient to convert ZIF-67 into amorphous carbons.
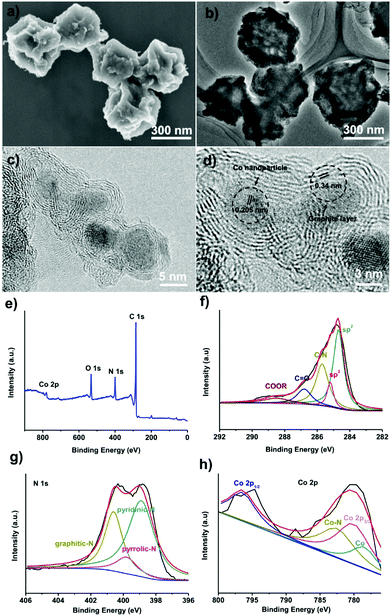
To convert the obtained amorphous carbons into graphitic shell networks, we annealed the ZIF-67 particles at 450 °C for 48 h. The SEM images of the annealed samples are shown in Fig. 3a. Compared with the initial ZIF-67 polyhedral-like particles, the annealed particles are folded and creased. The TEM image in Fig. 3b suggests that these particles are not dense, but are highly porous and thin instead. These morphological characteristics are typical for dried capsules, implying that the ZIF-67-derived carbons have been successfully converted into capsules.66,67 More detailed structural characterization of the capsules was conducted by high-resolution TEM (HRTEM). The HRTEM image in Fig. 3c reveals that these capsules contain well-dispersed crystalline nanoparticles surrounded by 3–10 layers. The lattice distance of the nanoparticles is measured to be 0.205 nm, which matches well with the d-spacing of the (111) plane of cubic cobalt, indicating that the observed nanoparticles are Co nanoparticles.68 The average particle size of the Co nanoparticles is 5 ± 3 nm (Fig. S5, ESI†). The interlayer spacing is measured to be 0.34 nm, corresponding to the (002) plane of graphite (Fig. 3d).69 The graphitic shells are not isolated but rather are interconnected with each other to form continuous networks. Recently, carbon nanotubes have been observed after the pyrolysis of MOFs.70–73 In our case, we did not observe carbon nanotubes, which is probably due to the absence of a reducing gas such as hydrogen (H2).
The surface composition of the capsules was investigated by X-ray photoelectron spectroscopy (XPS). The surface of the capsules contains C, N, O, and Co elements (Fig. 3e). The C1s spectrum suggests that around 84% of the carbon is sp2-bonded carbon (Fig. 3f).74 The C![[double bond, length as m-dash]](https://www.rsc.org/images/entities/char_e001.gif) O bond and –COOR bond are caused by the surface oxidization of carbons during the acidic etching.75,76 The C–N bond confirms that the carbons are doped with N atoms. The N1s spectrum shows that nitrogen exists mainly in the form of pyridinic-N (398.5 ± 0.2 eV), pyrrolic-N (399.8 ± 0.2 eV), and graphitic-N (401.1 ± 0.2 eV) (Fig. 3g).77,78 The Co2p spectrum can be assigned as Co2p1/2, Co2p3/2 and CoO,79,80 suggesting that the Co on the surface of the capsule is oxidized by the oxygen in air (Fig. 3h). On the basis of the XPS analysis, graphitic shell networks have been successfully fabricated by annealing the ZIF-67 crystals at 450 °C for 48 h.
O bond and –COOR bond are caused by the surface oxidization of carbons during the acidic etching.75,76 The C–N bond confirms that the carbons are doped with N atoms. The N1s spectrum shows that nitrogen exists mainly in the form of pyridinic-N (398.5 ± 0.2 eV), pyrrolic-N (399.8 ± 0.2 eV), and graphitic-N (401.1 ± 0.2 eV) (Fig. 3g).77,78 The Co2p spectrum can be assigned as Co2p1/2, Co2p3/2 and CoO,79,80 suggesting that the Co on the surface of the capsule is oxidized by the oxygen in air (Fig. 3h). On the basis of the XPS analysis, graphitic shell networks have been successfully fabricated by annealing the ZIF-67 crystals at 450 °C for 48 h.
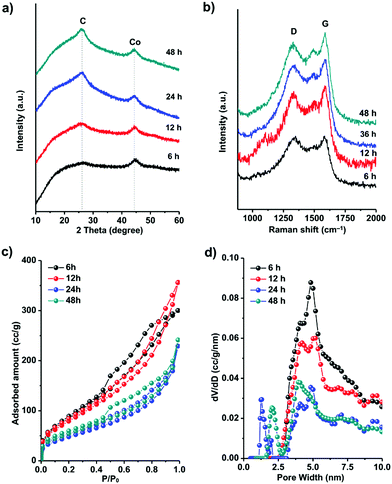
To understand the formation process of these graphitic shell networks, time-dependent characterization of the intermediate samples was carried out. The SEM images of the annealed samples are shown in Fig. 4. After 6 h, the samples became folded and creased with highly porous textures, confirming that the carbon capsules were formed (Fig. 4a-1 and a-2). The magnified SEM image illustrates the formation of Co nanoparticles according to the dispersed nanoparticles shown on the capsules (Fig. 4a-3). However, no concentric rings were observed around the nanoparticles (Fig. 4a-4). Graphitic domains gradually generated around the nanoparticles (Fig. 4b-4) evolved into curled graphitic layers (Fig. 4c-4), and finally turned into concentric rings around the nanoparticles (Fig. 4d-4). This process indicates that the Co nanoparticles were formed first, then the graphitization and bending of the graphitic layers occurred with the catalysis of the Co nanoparticles. We note that the size distribution of the Co nanoparticles is almost constant during the annealing process (from 5 ± 3 nm to 5 ± 2 nm) (Fig. S6, ESI†). The protective effect of the carbon shells on the Co nanoparticles may be the reason for the limited growth of the Co nanoparticles, because the diffusion of the Co nanoparticles was confined by these shells. We measured the PXRD profiles of these capsule-like samples (Fig. 5a). A broad peak at ∼44.2° appeared after 6 h. Such a diffraction peak can be indexed to the (111) plane of cubic cobalt,77 confirming the formation of Co nanoparticles at this time, which is similar to the conclusion drawn from the TEM analysis. No peaks belonging to graphitic carbons could be detected at this reaction time, suggesting that the formed carbons are amorphous. With the elongation of the annealing time, the half-height width and the intensity of the peak at ∼44.2° did not change significantly, suggesting that the Co nanoparticles did not grow larger during the annealing stage. From 12 h, a broad peak at around 26° emerged, indicating the formation of (002) graphite interlayers.80,81 A gradual sharpening of the (002) peak of graphite interlayers was observed. These results suggest that the graphitization of carbons follows the generation of the Co nanoparticles, thus implying the catalytic role of the Co nanoparticles during the formation of the graphitic shells.
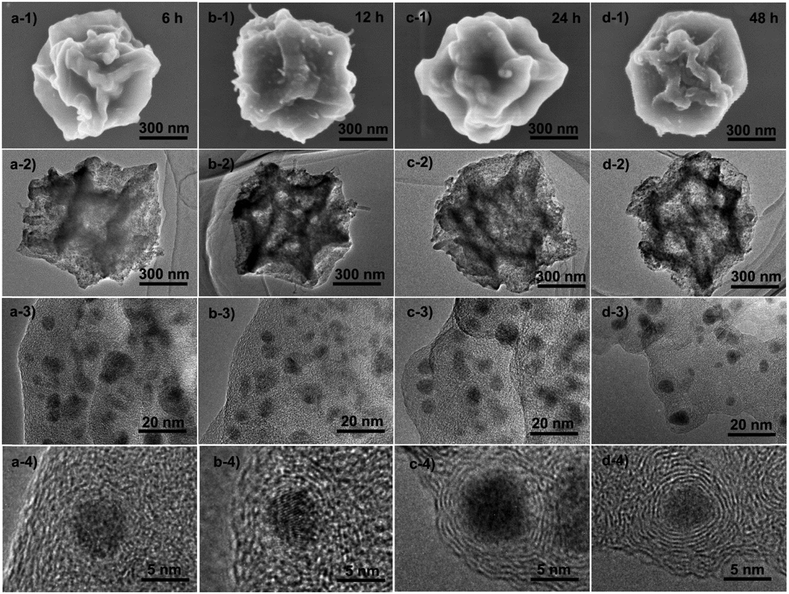 | ||
| Fig. 4 Ex situ SEM and TEM characterization of the samples obtained by the time-dependent pyrolysis of ZIF-67 crystals at 450 °C for (a) 6 h, (b) 12 h, (c) 24 h and (d) 48 h. | ||
The Raman spectra of all the samples are shown in Fig. 5b. The peaks near 1345 cm−1 are defect-/disorder-induced peaks (D mode).82 The peak at 1585 cm−1 belongs to the G mode which is characteristic of sp2-hybridized carbon.83 The formation of graphene layers induces sharpening of the G peaks with prolonged annealing time. The slight difference between the positions of the G peak of the capsules (1584 cm−1) and graphite (1593 m−1) is probably caused by the curvature of the graphene layers in the graphitic shells.82,83 The ratio between the intensities of the G mode and the D mode represents the graphitic degree of the carbons. From 6 h to 48 h, the IG/ID (shown in Table 1) increased gradually, corresponding to the transformation from amorphous carbon capsules (6 h) into graphitic shell networks (48 h).
| Samples | S BET (m2 g−1) | V t (cm3 g−1) | I D/IG |
|---|---|---|---|
| Annealed ZIF-67 6 h | 324 | 0.45 | 0.85 |
| Annealed ZIF-67 12 h | 288 | 0.48 | 0.87 |
| Annealed ZIF-67 24 h | 176 | 0.36 | 0.94 |
| Annealed ZIF-67 48 h | 198 | 0.29 | 0.99 |
The evolution of the specific surface area and porosity during the formation of the graphitic shell networks was analyzed by N2 sorption analysis (Fig. 5c). The adsorption–desorption isotherms of the capsules obtained after annealing for 6 h and 12 h show a significant increase of the uptake from 0.4 to 0.8P/P0, indicating the existence of mesopores which are mainly due to the amorphous carbons. In contrast, the graphitic shells obtained after 24 h and 48 h show a small amount of uptake in this P/P0 range, suggesting the smaller amount of mesopores. The disappearance of the mesopores is caused by the connection of the graphene rings. The pore-size distribution profiles of the carbons were calculated by the NLDFT method (Fig. 5d). The carbons obtained after 6 h of annealing contain mesopores centered at 5 ± 1 nm. With the elongation of the annealing time, the amount of mesopores decreases while micropores centered at 1.2 ± 0.5 nm emerge. The total pore volumes and the Brunauer–Emmett–Teller (BET) specific surface areas of all the samples are listed in Table 1. The decrease in the specific surface area with prolonged annealing time is due to the formation of closed graphitic shell structures which are not fully accessible for N2 molecules.
On the basis of the above characterizations, a mechanism for the formation of the graphitic shell networks is proposed as depicted in Fig. 6. For a ZIF-67 crystal, all the Co2+ ions are coordinated with or separated by 2-methylimidazole molecules. The bonds inside the 2-methylimidazole molecules can be broken by heating, yielding carbons. In the meantime, the frameworks of ZIF-67 are destroyed, generating free Co atoms which aggregate into Co nanoparticles which are dispersed inside the amorphous carbon matrix. The Co nanoparticle triggers the transformation of the nearby carbon atoms into graphitic structures. The curvature of the Co nanoparticles directs the development of the graphitic structures in a shell-type, leading to the formation of graphitic shell networks. In contrast, ZIF-8 (the node is Zn instead of Co in ZIF-67) was calcined at 450 °C for 6 h using the same procedure. As shown in Fig. S7 (ESI†), there is little change after calcination except for a slight shrinkage. The Raman spectrum and PXRD profile (Fig. S8, ESI†) prove that the initial frameworks of the ZIF-8 particles still exist, confirming the vital role of Co nanoparticles.
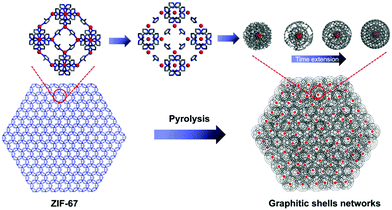 | ||
| Fig. 6 Schematic illustration of the formation of the graphitic shell networks from a ZIF-67 crystal. | ||
To understand how the capsule structure is formed, we simplify the graphitic shell networks into an ideal model by setting all the Co nanoparticles to be 6 nm in size, and 6 layers of graphene surrounding each of the Co nanoparticles. In addition, we assume that there is no elemental loss during the pyrolysis process because the evaporation of C and Co at 450 °C may not be significant. After calculation, a ZIF-67 crystal with a size of 600 nm is expected to lose 76% of the initial volume, as shown in Fig. S9–S11 (ESI†). As a result, the obtained graphitic shell networks become empty, thus forming capsule-like structures.
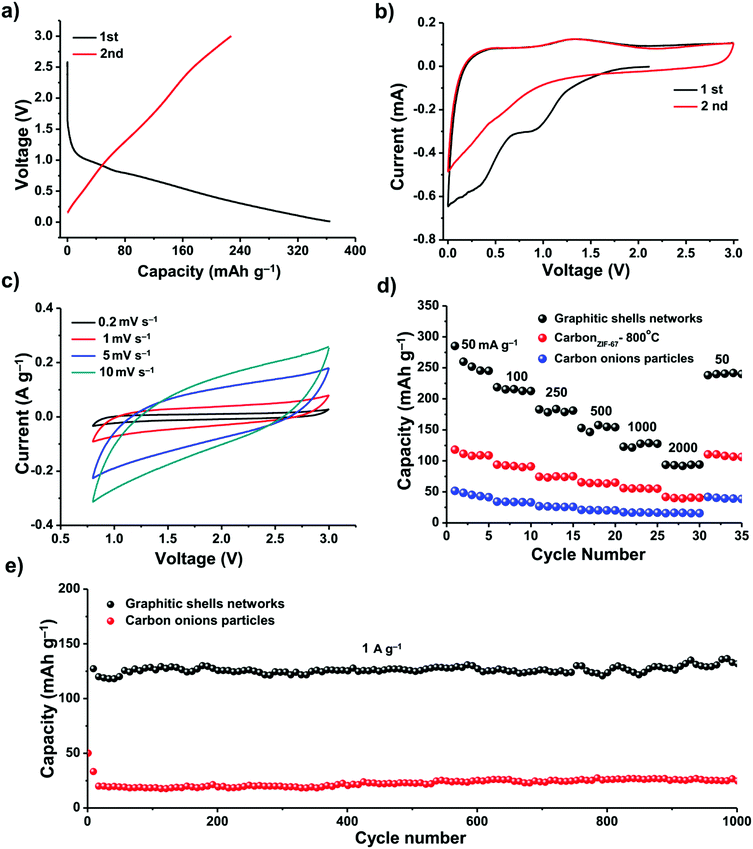
We investigated the electrochemical performance of these graphitic shell networks for EES applications. Sodium-ion batteries (SIBs) have been considered as a potential replacement for lithium-ion batteries (LIBs) because of their abundance and similar working principle to LIBs. However, the larger radius of the Na+ ions compared to Li+ ions presents a major obstacle for the use of graphite electrodes in SIBs.82–85 The narrow d-spacing (0.335 nm) makes graphite unsuitable for the reversible intercalation of Na+ ions. Therefore, finding more suitable hosts for sodium ions is of utmost importance when developing electrodes for SIBs. We assembled a carbon/Na half-cell for the SIBs. For comparison, carbon onion particles derived from nano-diamonds by calcination at 1200 °C for 5 h (Fig. S12, ESI†) and carbon derived from ZIF-67 at 800 °C for 48 h (abbreviated as carbonZIF-67-800 °C, Fig. S1, ESI†) were also tested. The as-prepared carbon onions have concentric rings; however, they are well-isolated from each other. The cyclic voltammetry (CV) profiles and the galvanostatic discharge/charge curves of the graphitic shell networks and carbon onion particles between 0.001 and 3.000 V (vs. Na+/Na) at a current density of 50 mA g−1 are shown in Fig. 7. The galvanostatic discharge/charge curves exhibit large irreversible capacity in the first two cycles for both samples, which can be attributed to decomposition of the electrolyte and the formation of a solid electrolyte interphase (SEI) film.84 The graphitic shell networks show a reversible discharge capacity of around 240 mA h g−1. The initial Coulombic efficiency of the graphitic shell networks is 62% (Fig. 7a).
The CV curves of the graphitic shell networks show a quasi-rectangular shape (Fig. 7b and c), implying a pseudocapacitive behavior.85 The kinetics of both samples were investigated, and the results could be obtained using the formula i = Cv. It is known that the equation i = Cvb can determine the type of ion storage during electrochemical energy storage.86 When b is smaller than 1, the ion storage behavior is battery-type.87 When b is equal to 1, the ion storage behavior is capacitor-type.88 The results in our case suggest that the graphitic shell networks show a pseudo-capacitor-type ion storage, which is different from the battery-type ion intercalation. The pseudocapacitor-type ion storage indicates that the Na+ ions are stored at the surface of the graphitic shells. As the graphitic shell networks are made up of few-layer concentric graphitic rings, the diffusion of the Na+ ions into the interlayer is fast. Hence, the Na+ ions can interact with the graphene layer, leading to a pseudocapacitor-type ion storage.89
The pseudocapacitor-type Na-ion storage enhances the rate performance of the electrode (Fig. 7d). The specific capacities of the graphitic shell networks, carbonZIF-67-800 °C and carbon onion particles at 50 mA g−1 are 240, 125, and 50 mA h g−1, respectively. When the current density was increased up to 2000 mA g−1, the capacity of the graphitic shell networks dropped down to 90 mA h g−1. In contrast, the carbonZIF-67-800 °C and carbon onion particles could deliver very low capacities (40 and 10 mA h g−1). For all the samples, the specific capacities can be recovered at a low current density of 50 mA g−1.
The graphitic shell networks showed much better cycling capacity at a high current density (1000 mA g−1) (Fig. 7e). The electrode containing the graphitic shell networks delivered a discharge capacity of 120 mA h g−1 in the first cycle, and retained a reversible capacity of 120 mA h g−1 after 1000 cycles, corresponding to a capacity retention ratio of 100%. The Coulombic efficiency approached 99% over 1000 cycles. In contrast, the electrode made using the carbon onion particles could only deliver a very low capacity of 20 mA h g−1 after 1000 cycles.
We compared the graphitic shell networks with other carbon materials. For instance, the sample annealed for 6 h has a larger porosity (0.45 cm3 g−1) than the final graphitic shell networks (0.29 cm3 g−1). However, the additional pores did not make a contribution to the specific capacity of the anode regardless of the current densities (Fig. S13, ESI†). The reason is that the pores in the sample annealed for 6 h are larger than 3 nm which are too large for the storage of Na+ ions.90 We also tested the performance of commercial graphite (Fig. S14, ESI†). The specific capacities of commercial graphite are lower than any other samples reported in this manuscript, which is mainly due to the difficulty in accommodating Na+ ions. A comparison was also made between the graphitic shell networks and some other carbons reported for SIB tests as listed in Table S1 (ESI†). It can be seen that the overall performance of the graphitic shell networks is very good in terms of reversible capacity after long term cycling.
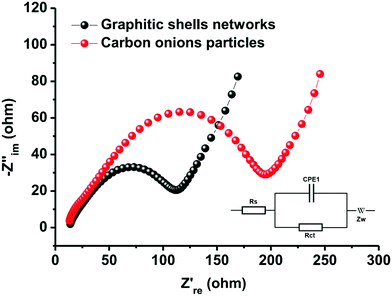
The excellent rate performance and cycling stability of the graphitic shell networks are mainly contributed by the continuous graphitic networks. It is well-known that the inner resistance strongly affects polarization. The higher the inner resistance, the larger the polarization and the poorer the cycling stability and rate performance. The connected graphitic domains promote the facile transport of electrons in the networks. On the other hand, the electrodes made of discrete carbon onion particles contain many electrode/electrolyte interfaces. These interfaces hinder the transport of electrons and alkali metal ions, thus leading to large resistance. To confirm this theory, electrochemical impedance spectroscopy (EIS) measurements were carried out to record internal information of the assembled electrodes. Fig. 8 shows that both samples have classical Nyquist diagrams which consist of a semicircle in the high- and middle-frequency regions and a linear part in the low-frequency regions.91–93 The semicircle in the high-frequency range can be related to electronic conductivity of the electrodes and to charge-transfer in the middle-frequency range, whereas the linear part in the low-frequency regions can be attributed to the diffusion of ions in the electrodes. The charge-transfer resistances (Rct) of the electrodes assembled from the graphitic shell networks and carbon onion particles are 73 and 125 Ω, respectively. The small Rct value of the graphitic shell networks demonstrates that the continuous graphitic networks can facilitate better charge transfer in the electrode compared to the carbon onion particles, thereby confirming the good electrical conductivity of the graphitic shell networks.
4. Conclusion
In summary, we have reported a facile method to synthesize graphitic shell networks by the low-temperature pyrolysis of ZIF-67. The as-synthesized continuous graphitic shell networks show excellent electrochemical performance as electrodes for SIBs with good cycling stability and high capacity retention at high rates. This work demonstrates the potential of complex carbon structures derived from MOFs as impressive candidates for EES applications.Conflicts of interest
There are no conflicts to declare.Acknowledgements
This work was supported by the National Natural Science Foundation of China (Grant No. 21473059) and Large Instruments Open Foundation of East China Normal University. This work was supported by the Deanship of Scientific Research (DSR), King Abdulaziz University, Jeddah, under grant No. (KEP-1-130-39). The authors, therefore, gratefully acknowledge the DSR technical and financial support.References
- Y. Fang, Y. Lv, R. Che, H. Wu, X. Zhang, D. Gu, G. Zheng and D. Zhao, J. Am. Chem. Soc., 2013, 135, 1524–1530 CrossRef CAS PubMed.
- B. Liu, H. Shioyama, T. Akita and Q. Xu, J. Am. Chem. Soc., 2008, 130, 5390–5391 CrossRef CAS PubMed.
- J. Liu, A. G. Rinzler, H. Dai, J. H. Hafner, R. K. Bradley, P. J. Boul, A. Lu, T. Iverson, K. Shelimov and C. B. Huffman, Science, 1998, 280, 1253–1256 CrossRef CAS PubMed.
- G. Dennler, M. C. Scharber and C. J. Brabec, Adv. Mater., 2009, 21, 1323–1338 CrossRef CAS.
- W. Gao, L. B. Alemany, L. Ci and P. M. Ajayan, Nat. Chem., 2009, 1, 403–408 CrossRef CAS PubMed.
- D. Deng, L. Yu, X. Chen, G. Wang, L. Jin, X. Pan, J. Deng, G. Sun and X. Bao, Angew. Chem., Int. Ed., 2013, 52, 371–375 CrossRef CAS PubMed.
- K. H. An, W. S. Kim, Y. S. Park, J.-M. Moon, D. J. Bae, S. C. Lim, Y. S. Lee and Y. H. Lee, Adv. Funct. Mater., 2001, 11, 387–392 CrossRef CAS.
- S. Stankovich, D. A. Dikin, G. H. Dommett, K. M. Kohlhaas, E. J. Zimney, E. A. Stach, R. D. Piner, S. T. Nguyen and R. S. Ruoff, Nature, 2006, 442, 282–286 CrossRef CAS PubMed.
- P.-X. Hou, H. Orikasa, T. Yamazaki, K. Matsuoka, A. Tomita, N. Setoyama, Y. Fukushima and T. Kyotani, Chem. Mater., 2005, 17, 5187–5193 CrossRef CAS.
- J. Zhao, Y. Jiang, H. Fan, M. Liu, O. Zhuo, X. Wang, Q. Wu, L. Yang, Y. Ma and Z. Hu, Adv. Mater., 2017, 29, 8 Search PubMed.
- Q. Wu, L. Yang, X. Wang and Z. Hu, Acc. Chem. Res., 2017, 50, 435–444 CrossRef CAS PubMed.
- J. Zhao, H. Lai, Z. Lyu, Y. Jiang, K. Xie, X. Wang, Q. Wu, L. Yang, Z. Jin and Y. Ma, Adv. Mater., 2015, 27, 3541–3545 CrossRef CAS PubMed.
- P. Bairi, K. Minami, W. Nakanishi, J. P. Hill, K. Ariga and L. K. Shrestha, ACS Nano, 2016, 10, 6631–6637 CrossRef CAS PubMed.
- L. K. Shrestha, L. Adhikari, R. G. Shrestha, M. P. Adhikari, R. Ad-hikari, J. P. Hill, R. R. Pradhananga and K. Ariga, Sci. Technol. Adv. Mater., 2016, 17, 483–492 CrossRef CAS PubMed.
- Y.-X. Wang, J. Yang, W. Lai, S.-L. Chou, Q.-F. Gu, H. K. Liu, D. Zhao and S. X. Dou, J. Am. Chem. Soc., 2016, 138, 16576–16579 CrossRef CAS PubMed.
- B. Kong, L. Zu, C. Peng, Y. Zhang, W. Zhang, J. Tang, C. Selomulya, L. Zhang, H. Chen and Y. Wang, J. Am. Chem. Soc., 2016, 138, 16533–16541 CrossRef CAS PubMed.
- B. Szczęśniak, J. Choma and M. Jaroniec, Adv. Colloid Interface Sci., 2017, 243, 46–59 CrossRef PubMed.
- P. Xia, B. Zhu, J. Yu, S. Cao and M. Jaroniec, J. Mater. Chem. A, 2017, 5, 3230–3238 CAS.
- W.-M. Zhang, X.-L. Wu, J.-S. Hu, Y.-G. Guo and L.-J. Wan, Adv. Funct. Mater., 2008, 18, 3941–3946 CrossRef CAS.
- Y. S. Hu, L. Kienle, Y. G. Guo and J. Maier, Adv. Mater., 2006, 18, 1421–1426 CrossRef CAS.
- Y. Yu, L. Gu, C. L. Wang, A. Dhanabalan, P. A. van Aken and J. Maier, Angew. Chem., Int. Ed., 2009, 48, 6485–6489 CrossRef CAS PubMed.
- Y. Yu, L. Gu, C. B. Zhu, P. A. van Aken and J. Maier, J. Am. Chem. Soc., 2009, 131, 15984–15985 CrossRef CAS PubMed.
- K. Xie, X. T. Qin, X. Z. Wang, Y. N. Wang, H. S. Tao, Q. Wu, L. J. Yang and Z. Hu, Adv. Mater., 2012, 24, 347–352 CrossRef CAS PubMed.
- J. Zhao, H. W. Lai, Z. Y. Lyu, Y. F. Jiang, K. Xie, X. Z. Wang, Q. Wu, L. J. Yang, Z. Jin, Y. W. Ma, J. Liu and Z. Hu, Adv. Mater., 2015, 27, 3541–3545 CrossRef CAS PubMed.
- S. Iijima, J. Cryst. Growth, 1980, 50, 675–683 CrossRef CAS.
- D. Ugarte, Nature, 1992, 359, 707 CrossRef CAS PubMed.
- H. W. Kroto, J. R. Heath, S. C. O'Brien, R. F. Curl and R. E. Smalley, Nature, 1985, 318, 162–163 CrossRef CAS.
- I. Suarez-Martinez, N. Grobert and C. P. Ewels, Carbon, 2012, 50, 741–747 CrossRef CAS.
- A. Hirata, M. Igarashi and T. Kaito, Tribol. Int., 2004, 37, 899–905 CrossRef CAS.
- L. Joly-Pottuz, N. Matsumoto, H. Kinoshita, B. Vacher, M. Belin, G. Montagnac, J. Martin and N. Ohmae, Tribol. Int., 2008, 41, 69–78 CrossRef CAS.
- N. Keller, N. I. Maksimova, V. V. Roddatis, M. Schur, G. Mestl, Y. V. Butenko, V. L. Kuznetsov and R. Schlögl, Angew. Chem., Int. Ed., 2002, 41, 1885–1888 CrossRef CAS PubMed.
- G. Wu, M. Nelson, S. Ma, H. Meng, G. Cui and P. K. Shen, Carbon, 2011, 49, 3972–3982 CrossRef CAS.
- D. Pech, M. Brunet, H. Durou, P. Huang, V. Mochalin, Y. Gogotsi, P.-L. Taberna and P. Simon, Nat. Nanotechnol., 2010, 5, 651–654 CrossRef CAS PubMed.
- I. Kovalenko, D. G. Bucknall and G. Yushin, Adv. Funct. Mater., 2010, 20, 3979–3986 CrossRef CAS.
- N. Sano, H. Wang, M. Chhowalla, I. Alexandrou and G. Amaratunga, Nature, 2001, 414, 506–507 CrossRef CAS PubMed.
- H. Lange, M. Sioda, A. Huczko, Y. Zhu, H. Kroto and D. Walton, Carbon, 2003, 41, 1617–1623 CrossRef CAS.
- F. Banhart, T. Füller, P. Redlich and P. Ajayan, Chem. Phys. Lett., 1997, 269, 349–355 CrossRef CAS.
- C. He, N. Zhao, C. Shi, X. Du and J. Li, Mater. Chem. Phys., 2006, 97, 109–115 CrossRef CAS.
- M. Choi, I. S. Altman, Y. J. Kim, P. V. Pikhitsa, S. Lee, G. S. Park, T. Jeong and J. B. Yoo, Adv. Mater., 2004, 16, 1721–1725 CrossRef CAS.
- M. Zeiger, N. Jäckel, M. Aslan, D. Weingarth and V. Presser, Carbon, 2015, 84, 584–598 CrossRef CAS.
- V. L. Kuznetsov, A. L. Chuvilin, Y. V. Butenko, I. Y. Mal'kov and V. M. Titov, Chem. Phys. Lett., 1994, 222, 343–348 CrossRef CAS.
- T. Cabioc’h, M. Jaouen, E. Thune, P. Guerin, C. Fayoux and M. Denanot, Surf. Coat. Tehnol, 2000, 128, 43–50 CrossRef.
- E. Thune, T. Cabioc'h, P. Guérin, M.-F. Denanot and M. Jaouen, Mater. Lett., 2002, 54, 222–228 CrossRef CAS.
- W. Wu, Z. Zhu, Z. Liu, Y. Xie, J. Zhang and T. Hu, Carbon, 2003, 41, 317–321 CrossRef CAS.
- V. Kuznetsov, A. Chuvilin, E. Moroz, V. Kolomiichuk, S. K. Shaikhutdinov, Y. V. Butenko and I. Y. Mal'kov, Carbon, 1994, 32, 873–882 CrossRef.
- Y. Jiao, D. Han, L. Liu, L. Ji, G. Guo, J. Hu, D. Yang and A. Dong, Angew. Chem., Int. Ed., 2015, 54, 5727–5731 CrossRef CAS PubMed.
- M. Eddaoudi, J. Kim, N. Rosi, D. Vodak, J. Wachter, M. O'keeffe and O. M. Yaghi, Science, 2002, 295, 469–472 CrossRef CAS PubMed.
- H. Furukawa, K. E. Cordova, M. O’Keeffe and O. M. Yaghi, Science, 2013, 341, 1230444 CrossRef PubMed.
- H. Furukawa, N. Ko, Y. B. Go, N. Aratani, S. B. Choi, E. Choi, A. Ö. Yazaydin, R. Q. Snurr, M. O’Keeffe and J. Kim, Science, 2010, 329, 424–428 CrossRef CAS PubMed.
- M. Hu, J. Reboul, S. Furukawa, N. L. Torad, Q. Ji, P. Srinivasu, K. Ariga, S. Kitagawa and Y. Yamauchi, J. Am. Chem. Soc., 2012, 134, 2864–2867 CrossRef CAS PubMed.
- W. Zhang, X. Jiang, X. Wang, Y. V. Kaneti, Y. Chen, J. Liu, J. S. Jiang, Y. Yamauchi and M. Hu, Angew. Chem., Int. Ed., 2017, 56, 8435–8440 CrossRef CAS PubMed.
- G. Huang, L. Yang, X. Ma, J. Jiang, S. H. Yu and H. L. Jiang, Chem. – Eur. J., 2016, 22, 3470–3477 CrossRef CAS PubMed.
- H. B. Wu, S. Wei, L. Zhang, R. Xu, H. H. Hng and X. W. D. Lou, Chem. – Eur. J., 2013, 19, 10804–10808 CrossRef CAS PubMed.
- B. Y. Guan, L. Yu and X. W. D. Lou, Energy Environ. Sci., 2016, 9, 3092–3096 CAS.
- H.-L. Jiang and Q. Xu, Chem. Commun., 2011, 47, 3351–3370 RSC.
- R. Q. Zou, H. Sakurai and Q. Xu, Angew. Chem., Int. Ed., 2006, 45, 2542–2546 CrossRef CAS PubMed.
- Q. Wang, X. Feng, S. Wang, N. Song, Y. Chen, W. Tong, Y. Han, L. Yang and B. Wang, Adv. Mater., 2016, 28, 5837–5843 CrossRef CAS PubMed.
- N. L. Torad, M. Hu, Y. Kamachi, K. Takai, M. Imura, M. Naito and Y. Yamauchi, Chem. Commun., 2013, 49, 2521–2523 RSC.
- C. Liang, Z. Li and S. Dai, Angew. Chem., Int. Ed., 2008, 47, 3696–3717 CrossRef CAS PubMed.
- B. Liu, H. Shioyama, H. L. Jiang, X. B. Zhang and Q. Xu, Carbon, 2010, 48, 456–463 CrossRef CAS.
- W. Xia, A. Mahmood, R. Q. Zou and Q. Xu, Energy Environ. Sci., 2015, 8, 1837–1866 CAS.
- Y. Z. Chen, C. M. Wang, Z. Y. Wu, Y. J. Xiong, Q. Xu, S. H. Yu and H. L. Jiang, Adv. Mater., 2015, 27, 5010–5016 CrossRef CAS PubMed.
- Y. Li, Y.-X. Zhou, X. Ma and H.-L. Jiang, Chem. Commun., 2016, 52, 4199–4202 RSC.
- S. Horike, D. Umeyama, M. Inukai, T. Itakura and S. Kitagawa, J. Am. Chem. Soc., 2012, 134, 7612–7615 CrossRef CAS PubMed.
- S. Horike, W. Chen, T. Itakura, M. Inukai, D. Umeyama, H. Asakura and S. Kitagawa, Chem. Commun., 2014, 50, 10241–10243 RSC.
- M. Björnmalm, J. Cui, N. Bertleff-Zieschang, D. Song, M. Faria, M. A. Rahim and F. Caruso, Chem. Mater., 2017, 29, 289–306 CrossRef.
- J. Cui, J. J. Richardson, M. Björnmalm, M. Faria and F. Caruso, Acc. Chem. Res., 2016, 49, 1139–1148 CrossRef CAS PubMed.
- H. Hu, L. Han, M. Yu, Z. Wang and X. W. D. Lou, Energy Environ. Sci., 2016, 9, 107–111 CAS.
- J. Tang, R. R. Salunkhe, J. Liu, N. L. Torad, M. Imura, S. Furukawa and Y. Yamauchi, J. Am. Chem. Soc., 2015, 137, 1572–1580 CrossRef CAS PubMed.
- A. Aijaz, J. Masa, C. Rösler, W. Xia, P. Weide, A. J. R. Botz, R. A. Fischer, W. Schuhmann and M. Muhler, Angew. Chem., Int. Ed., 2016, 55, 4087–4091 CrossRef CAS PubMed.
- B. Y. Xia, Y. Yan, N. Li, H. B. Wu, X. W. Lou and X. Wang, Nat. Energy, 2016, 1, 15006 CrossRef CAS.
- J. Meng, C. Niu, L. Xu, J. Li, X. Liu, X. Wang, Y. Wu, X. Xu, W. Chen, Q. Li, Z. Zhu, D. Zhao and L. Mai, J. Am. Chem. Soc., 2017, 139, 8212–8221 CrossRef CAS PubMed.
- P. Su, H. Xiao, J. Zhao, Y. Yao, Z. Shao, C. Li and Q. Yang, Chem. Sci., 2013, 4, 2941–2946 RSC.
- Z.-L. Yu, S. Xin, Y. You, L. Yu, Y. Lin, D.-W. Xu, C. Qiao, Z.-H. Huang, N. Yang and S.-H. Yu, J. Am. Chem. Soc., 2016, 138, 14915–14922 CrossRef CAS PubMed.
- S. Stankovich, R. D. Piner, X. Chen, N. Wu, S. T. Nguyen and R. S. Ruoff, J. Mater. Chem., 2006, 16, 155–158 RSC.
- Y. Sun, X. Hu, W. Luo and Y. Huang, J. Phys. Chem. C, 2012, 116, 20794–20799 CAS.
- R. Lv, T. Cui, M. S. Jun, Q. Zhang, A. Cao, D. S. Su, Z. Zhang, S. H. Yoon, J. Miyawaki and I. Mochida, Adv. Funct. Mater., 2011, 21, 999–1006 CrossRef CAS.
- W. Xia, J. Zhu, W. Guo, L. An, D. Xia and R. Zou, J. Mater. Chem. A, 2014, 2, 11606–11613 CAS.
- Y. Z. Chen, C. Wang, Z. Y. Wu, Y. Xiong, Q. Xu, S. H. Yu and H. L. Jiang, Adv. Mater., 2015, 27, 5010–5016 CrossRef CAS PubMed.
- Z. Hasan, D.-W. Cho, C.-M. Chon, K. Yoon and H. Song, Chem. Eng. J., 2016, 298, 183–190 CrossRef CAS.
- R. R. Salunkhe, J. Tang, Y. Kamachi, T. Nakato, J. H. Kim and Y. Yamauchi, ACS Nano, 2015, 9, 6288–6296 CrossRef CAS PubMed.
- A. C. Ferrari, Solid State Commun., 2007, 143, 47–57 CrossRef CAS.
- J. Cebik, J. K. McDonough, F. Peerally, R. Medrano, I. Neitzel, Y. Gogotsi and S. Osswald, Nanotechnology, 2013, 24, 205703 CrossRef PubMed.
- Z. Jian, W. Luo and X. Ji, J. Am. Chem. Soc., 2015, 137, 11566–11569 CrossRef CAS PubMed.
- P. Simon, Y. Gogotsi and B. Dunn, Science, 2014, 343, 1210–1211 CrossRef CAS PubMed.
- V. Augustyn, J. Come, M. A. Lowe, J. W. Kim, P.-L. Taberna, S. H. Tolbert, H. D. Abruna, P. Simon and B. Dunn, Nat. Mater., 2013, 12, 518–522 CrossRef CAS PubMed.
- C. Chen, Y. Wen, X. Hu, X. Ji, M. Yan, L. Mai, P. Hu, B. Shan and Y. Huang, Nat. Commun., 2015, 6, 6929 CrossRef CAS PubMed.
- J. Come, P. L. Taberna, S. Hamelet, C. Masquelier and P. Simon, J. Electrochem. Soc., 2011, 158, 1090–1093 CrossRef.
- H. Wang, H. S. Casalongue, Y. Liang and H. Dai, J. Am. Chem. Soc., 2010, 132, 7472–7477 CrossRef CAS PubMed.
- D. A. Stevens and J. R. Dahn, J. Electrochem. Soc., 2001, 148, A803–A811 CrossRef CAS.
- K. Tang, L. Fu, R. J. White, L. Yu, M.-M. Titirici, M. Antonietti and J. Maier, J. Mater. Chem., 2012, 2, 873–877 CAS.
- Y. Oumellal, N. Delpuech, D. Mazouzi, N. Dupre, J. Gaubicher, P. Moreau, P. Soudan, B. Lestriez and D. Guyomard, J. Mater. Chem., 2011, 21, 6201–6208 RSC.
- A. Ponrouch and M. R. Palacin, J. Power Sources, 2012, 212, 233–246 CrossRef CAS.
Footnote |
| † Electronic supplementary information (ESI) available. See DOI: 10.1039/c7qm00500h |
| This journal is © the Partner Organisations 2018 |

