
Effective bandgap narrowing of Cu–In–Zn–S quantum dots for photocatalytic H2 production via cocatalyst-alleviated charge recombination
Lili
Tan†
a,
Yanhong
Liu†
a,
Baodong
Mao
 *a,
Bifu
Luo
a,
Guan
Gong
a,
Yuanzhi
Hong
b,
Biyi
Chen
a and
Weidong
Shi
*a
*a,
Bifu
Luo
a,
Guan
Gong
a,
Yuanzhi
Hong
b,
Biyi
Chen
a and
Weidong
Shi
*a
aSchool of Chemistry and Chemical Engineering, Jiangsu University, Zhenjiang 212013, P. R. China. E-mail: maobd@ujs.edu.cn; swd1978@ujs.edu.cn
bSchool of Materials Science and Engineering, Jiangsu University, Zhenjiang, 212013, P. R. China
First published on 9th November 2017
Abstract
The development of single-component photocatalysts with narrow bandgaps (2.0–3.0 eV) has been one of the most important goals for photocatalytic H2 production, for which I–III–VI multinary sulfides play an important role due to their widely tunable composition-dependent bandgap. However, simultaneous bandgap narrowing and photocatalytic activity enhancement in the I–III–VI sulfides are often difficult to achieve due to increased defect states. Here, a series of Cu–In–Zn–S quantum dots (QDs) were synthesized by a facile hydrothermal method focusing on a more profound understanding of bandgap tuning and the subsequent effect on the photocatalytic process by controlling the Cu content. The bandgap of the QDs can be effectively tuned from 2.90 eV to 1.98 eV with an increasing Cu![[thin space (1/6-em)]](https://www.rsc.org/images/entities/char_2009.gif) :In ratio from 0.05:10 to 2.5:10 and a color change from light yellow to dark red. The QDs show photocatalytic H2 production activity even without any cocatalyst, but it quickly starts to decrease with the Cu/In ratio over 0.1:10 (bandgap of 2.59 eV), which highly limits the potential for visible light photocatalysis. Interestingly, Pt-loading effectively enhanced not only the tolerance of Cu incorporation, but also enabled a high H2 production activity even with further bandgap narrowing down to ∼2 eV. The best photocatalytic performance of 456.4 μmol h−1 g−1 was achieved for the Cu:In:Zn ratio of 1:10:5 with a bandgap of 2.27 eV. This increased tolerance of Cu content may result from a combined effect of charge separation by Pt as the cocatalyst that alleviated the Cu-induced charge recombination. The enhanced charge separation was proved by the photoluminescence quenching of the QDs with the cocatalyst. Electrochemical impedance spectroscopy was further used to study the charge separation properties of this photocatalytic system. This is the first observation of the cocatalyst-enhanced tolerance of Cu resulting from the competition of cocatalyst-induced charge separation and defect-induced charge recombination in multinary sulfides, which provides an interesting view and design guideline for the development of narrow bandgap photocatalysts.
:In ratio from 0.05:10 to 2.5:10 and a color change from light yellow to dark red. The QDs show photocatalytic H2 production activity even without any cocatalyst, but it quickly starts to decrease with the Cu/In ratio over 0.1:10 (bandgap of 2.59 eV), which highly limits the potential for visible light photocatalysis. Interestingly, Pt-loading effectively enhanced not only the tolerance of Cu incorporation, but also enabled a high H2 production activity even with further bandgap narrowing down to ∼2 eV. The best photocatalytic performance of 456.4 μmol h−1 g−1 was achieved for the Cu:In:Zn ratio of 1:10:5 with a bandgap of 2.27 eV. This increased tolerance of Cu content may result from a combined effect of charge separation by Pt as the cocatalyst that alleviated the Cu-induced charge recombination. The enhanced charge separation was proved by the photoluminescence quenching of the QDs with the cocatalyst. Electrochemical impedance spectroscopy was further used to study the charge separation properties of this photocatalytic system. This is the first observation of the cocatalyst-enhanced tolerance of Cu resulting from the competition of cocatalyst-induced charge separation and defect-induced charge recombination in multinary sulfides, which provides an interesting view and design guideline for the development of narrow bandgap photocatalysts.
Introduction
Hydrogen energy, as a high efficiency and clean energy, has been one of the most hot research topics to relieve energy shortage and environmental pollution. Photocatalytic water splitting for H2 production has been the “Holy Grail” in the last few decades, which can convert sustainable solar energy into H2 in a photocatalytic system1–5 using semiconductor materials to catalyze water splitting,6–10 such as TiO2, SrTiO3 and BiVO4 photocatalysts.11–13 However, a broad practical application is still limited due to the large bandgap of these materials that only respond to a small range of solar light spectrum. It is essential to develop appropriate photocatalysts that are capable of absorbing expanded visible light for photocatalytic H2 production. CdS(II–VI) exhibits prominent optical and physical properties, but the Cd element is harmful for the environment and its wide application is limited.14The narrow-bandgap metal chalcogenides have drawn great interest for photocatalytic H2 production, benefiting from the utilization of visible light owing to the higher level of the valence band from the S 3p orbital. The Cd-free CuInS2 and related solid solution semiconductors15–19 have attracted ever booming attention due to the wider response range of solar light for photocatalytic H2 generation, tunable bandgap and excellent optical characteristics.20–22 Compared to bulk materials, quantum dots (QDs) not only exhibit a short distance of electron–hole diffusion owing to the small size that facilitates the efficient separation of electron–hole pairs and weakens the negative impact of interior recombination centers,23–26 but also show stable dispersion prohibiting the aggregation of the photocatalysts to guarantee a high surface area.27 On the other hand, an enormous amount of research has been performed for tuning the composition of metal cation precursors such as zinc, copper, or indium ion in alloyed Cu–In–Zn–S materials, which were able to adjust the band energy levels for enhanced photocatalytic activity.28–33 Nevertheless, the band structure is more sensitive to the Cu component, and thus the absorption is more easy to cover the whole solar spectrum by the regulation of Cu content.34,35 However, increasing the Cu content even to relatively low levels results in the deactivation of the photocatalysts, both bulk and nanostructured, which was ascribed to the defect-induced charge recombination.36,37 The effect of Cu for multinary Cu–In–Zn–S QDs on photocatalytic H2 evolution performance is still a subject of debate and its demonstration is of great interest.
Herein, a series of Cu–In–Zn–S QDs was obtained by a modified hydrothermal approach38 and the H2 evolution performance was investigated by adjusting the Cu content. H2 production was enhanced dramatically with the introduction of Cu and achieved an optimum value with a Cu:In:Zn molar ratio of 0.1:10:5, but quickly started to decrease with further increase of Cu. Interestingly, Pt-loading results in the shift of the activity trend that reaches the maximum with the Cu:In:Zn molar ratio of 1:10:5. This 10 times increase of the tolerance of Cu incorporation was ascribed to the competition between the defect-induced charge recombination and cocatalyst-induced charge separation. Photoluminescence (PL) quenching of the QDs upon Pt-loading suggests the efficient separation of the charge carriers caused by the cocatalyst. Based on these results, a probable mechanism was proposed for the enhanced photocatalytic performance via the bandgap narrowing and the effect of competition between the defect-induced charge recombination and cocatalyst-induced charge separation. This observation provides a new insight and design principle for the development of narrow bandgap photocatalysts.
Experimental section
Chemicals
Copper acetate (Cu(OAc)2·H2O), zinc acetate (Zn(OAc)2·2H2O), sodium sulfide nonahydrate (Na2S·9H2O), sodium sulfite (Na2SO3) and sodium hydroxide (NaOH) were purchased from Aladdin (China). Thioacetamide (CH3CSNH2), indium nitrate (In(NO3)3·4.5H2O), L-cysteine (HSCH2CH(NH2)CO2H), and absolute ethanol were purchased from Sinopharm Chemical Reagent Co. Ltd. All chemicals were used for synthetic experiments without any purification.Synthesis of Cu–In–Zn–S QDs
A simple hydrothermal method was used for synthesizing Cu–In–Zn–S QDs according to the literature with some revisions.39 Copper acetate, zinc acetate and indium nitrate were chosen as copper, zinc and indium cation precursors, respectively. The quantities of Zn and In sources were kept constant, while that of Cu was varied systematically. Thioacetamide was used as the sulfur source and L-cysteine was used as the stabilizer. In a typical approach, copper acetate (0.1357 g), zinc acetate (0.186 g) and indium nitrate (0.649 g) were first dissolved in 4.0 mL of H2O to form a metal cation precursor solution (for Cu:In:Zn = 1; 10; 5). The stabilizing reagent solution including 0.605 g of L-cysteine and 3.5 mL of H2O was poured into the metal cation precursor solution. The pH value of the mixture was adjusted to 8.5 with 1 M NaOH to obtain a clear solution after sonication for 15 min. Next, thioacetamide (0.244 g) dissolved in 6.5 mL H2O was added to the above solution. The mixed solution was uniformly dispersed under magnetic stirring and transferred into Teflon-lined stainless-steel autoclaves, which were maintained at 110 °C for 4 hours. The resulting QD samples were precipitated out by the addition of an equal volume of ethanol and centrifuged at 10000 rpm for 10 min. The supernatant was decanted, and the lower sediment was re-dispersed in a minimal amount of deionized water. Then a large amount of ethanol (5 mL) was added to precipitate the QDs and the solution was isolated by centrifugation. In this way, the process was repeated 3 times for washing the samples with deionized water and absolute ethanol. Finally, the Cu–In–Zn–S QDs with a Cu:In:Zn molar ratio of 1:10:5 samples were preserved in deionized water for further characterization. The ratio of metal cations was controlled to obtain a series of samples with different Cu contents with a Cu:In:Zn molar ratio of x:10:5 (x = 0.05, 0.1, 0.25, 0.5, 1.0, 1.5, 2.0, and 2.5) that were denoted as CIZS-0.05, CIZS-0.1, CIZS-0.25, CIZS-0.5, CIZS-1.0, CIZS-1.5, CIZS-2.0, and CIZS-2.5, respectively. The syntheses were conducted under the same conditions.
Characterization
The powder X-ray diffraction (XRD) patterns were obtained using an X-ray diffractometer (D8 Advance, Bruker, Germany) operating with Cu-Kα (λ = 1.54056 Å) radiation at a scanning rate of 5° min−1 in the 2θ range of 10°–80° to obtain the crystal structure of the samples. The morphology and size were tested by using a Tecnai G2 F30 S-Twin (FEI) transmission electron microscope (TEM) with an accelerating voltage of 300 kV. The photoluminescence (PL) spectra of these samples were analyzed on a Cary Eclipse fluorescence spectrophotometer with an excitation wavelength of 450 nm. UV-visible diffuse reflection spectra (UV-vis DRS) were recorded on a Cary 8454 spectrophotometer with BaSO4 as the reference. X-ray photoelectron spectroscopy (XPS) was performed using a Thermo ESCALAB 250 X (America) electron spectrometer with 150 W Al X-ray sources. The electrochemical impedance spectra were obtained using a CHI 660B electrochemical workstation (CH Instruments, Inc., China) with a standard three-electrode cell at room temperature.Photocatalytic performance evaluation
The photocatalytic activities of the as-prepared QDs for H2 production were assessed by using a CEL-SPH2N online analysis system for H2 production by photocatalytic decomposition of water with Pyrex top-irradiation reaction ware linked to a glass closed-gas circulation system that was used to collect the evolved gas. Typically, the QDs (0.1 g) were dispersed in 100 mL solution of 0.35 M Na2S and 0.25 M Na2SO3 as sacrificial reagents, and the resulting solution was sonicated for 30 min. Next, the reaction solution was added to the photoreactor, which was sealed and connected to a circulation device. Nitrogen gas was continuously passed through the system and maintained for 30 min before the start of photocatalysis to exclude air in the reaction system. After that, the reaction system was vacuumed to further remove the dissolved oxygen before irradiation, so that the H2 production experiment was performed under vacuum. The photoreactor was illuminated with a 300 W Xe lamp with a cut-off filter of λ ≥ 425 nm. The amount of H2 produced from water splitting was measured at one-hour intervals via an online gas chromatograph (GC-7900) with a thermal conductivity detector (TCD). In this way, the photocatalytic reaction continued for five hours. For comparison, 2 wt% of Pt cocatalyst was also photodeposited on the QDs by adding a certain amount of H2PtCl6 to the reaction solution and illuminating for 30 min. And then photocatalysis was performed under the same experimental conditions as that of the pristine QDs without Pt. The photocatalytic H2 production of the Cu–In–Zn–S QDs was also performed in the absence of the sacrificial reagents in order to test its potential for overall water splitting.Results and discussion
XRD was used to study the crystal structure of the as-prepared samples. As illustrated in Fig. 1a, three peaks were observed at about 27.7, 47.5, and 55.7°, which can be indexed to the (112), (204), and (312) crystal planes of the chalcopyrite phase of Cu0.412In0.412Zn0.175S (JCPDS no. 47-1371), respectively. It is worth mentioning that other related chalcopyrite phase materials, such as CuInS2 and ZnS, have similar diffraction patterns with a slight shift of the peak position, so the precise indexation of the I–III–VI materials is often difficult. The XRD patterns remain almost the same in spite of the increased Cu content, demonstrating that the main lattice structure was not affected by the Cu incorporation. Unanimously the half peak width of these materials indicated similar dimensions of QDs with the varied Cu content, which is consistent with previous reports that the proportion of metal cations made no difference in the size of the nanoparticles.40,41 The prominent peaks at 27.7° slightly shifted to a higher 2θ value with an increase in Cu content. This may be caused by the cationic interdiffusion of Cu into the Cu–In–Zn–S nanostructure, resulting in a slight decrease of the lattice parameters due to the smaller ionic radius of Cu+ (77 pm) than that of In3+ (80 pm).42 It demonstrated that copper was successfully introduced into the lattice of the QDs. The impurity peaks of copper sulfides or oxides were not observed, suggesting that no other phases were formed in the preparation process. | ||
| Fig. 1 (a) XRD patterns of CIZS-0.1, CIZS-1 and CIZS-2 QDs. TEM images of the CIZS-0.1 (b), CIZS-1 (c) and CIZS-2 (d). The inset in panel (c) is the HRTEM image of the CIZS-1 QDs. | ||
In addition, the EDX spectra of the QDs show the presence of Cu in the QDs indicating that Cu has been successfully incorporated into the QDs. The atomic ratios of the cations in the samples are listed in Table 1. The Cu content in the QDs increased from 0.50% to 18.00% for the CIZS-0.05 to CIZS-2.5 samples, which is higher but roughly proportional to the initial ratio in the precursor. Moreover, the attained In/Zn molar ratios in the products are around 1:1, which are different from the starting In/Zn ratios of 2:1 in the precursor solution that may be due to the different intrinsic reactivity of metal ions with sulfur.43 It was also observed that the Zn content decreased from 50.90% to 33.50% with the increase of the Cu content from 0.50% to 18.00%, which may be the result of selective partial cation exchange of Cu over Zn in the growing process, whereas the In3+ ions are relatively more stable against cation exchange as observed in other work.44
| Factors | Cu | In | Zn |
|---|---|---|---|
| CIZS-0.05 | 0.50 | 48.60 | 50.90 |
| CIZS-0.1 | 1.28 | 50.84 | 47.88 |
| CIZS-0.25 | 4.20 | 54.20 | 41.60 |
| CIZS-0.5 | 5.19 | 53.30 | 41.51 |
| CIZS-1 | 8.88 | 53.78 | 37.34 |
| CIZS-1.5 | 13.50 | 53.20 | 33.30 |
| CIZS-2 | 15.50 | 51.20 | 33.30 |
| CIZS-2.5 | 18.00 | 48.50 | 33.50 |
TEM was used to study the morphology of the QDs. As shown in Fig. 1b–d, it can be observed that the spherical particles are relatively uniform with sizes of about 3–5 nm. The QDs with varied ratios of Cu (from CIZS-0.1, CIZS-1 to CIZS-2) display similar particle sizes, indicating that the dimensions of the QDs show no obvious change with adjusting the Cu content. The HRTEM image of CIZS-1 in the inset of Fig. 1c shows clearly a successive crystal lattice for the entire particle, indicating that the QDs possess relatively high crystallinity. The spacing of two adjacent fringes is 3.1 Å, which is indexed to the (112) plane of the tetragonal phase of the QDs. These results indicate that the CIZS QDs were obtained successfully. In Fig. 2, the high angle annular dark field scanning transmission electron microscopy (HAADF-STEM) image of CIZS-1 QDs after photodepositing the Pt cocatalyst shows a uniform distribution of the Cu, In, Zn, and S elements and minute quantities of Pt, indicating that the Pt cocatalyst successfully loaded on the QDs.
 | ||
| Fig. 2 HAADF-STEM image and the spatially resolved mapping of the Cu, In, Zn, S and Pt elements of the CIZS-1 QDs with loading of 2 wt% Pt. | ||
The chemical state of the CIZS-0.1 and CIZS-1 QDs was further investigated by XPS. As shown in Fig. 3a, two peaks of Cu 2p for CIZS-0.1 were observed at the binding energies of 931.8 and 951.7 eV, which are assigned to the monovalent Cu. There is no characteristic peak of Cu2+ at the binding energy of 942 eV, illustrating that only Cu+ exists in the QDs.45 The peak intensity of the CIZS-1 QDs is obviously stronger than that of the CIZS-0.1 QDs, demonstrating the increased copper incorporation into the QDs. In Fig. 3b, XPS of the In 3d shows two peaks located at 444.8 eV (In 3d5/2) and 452.4 eV (In 3d3/2), in good accordance with trivalent In.46 The peaks shown at 1021.8 and 1045.0 eV correspond to Zn 2p1/2 and Zn 2p3/2, respectively (Fig. 3c), indicating the presence of divalent Zn. Fig. 3d shows the XPS spectrum of sulfur deconvoluted to two characteristic peaks. These peaks with binding energies of 161.5 and 162.6 eV originate from S 2p3/2 and S 2p1/2 orbitals, respectively, which indicate that the chemical state of S is −2 in the QDs. The observed peaks of the corresponding elements are in accordance with previously reported Cu–In–Zn–S materials.45,46
 | ||
| Fig. 3 XPS spectra of the CIZS-0.1 and CIZS-1 QDs: (a) Cu 2p, (b) Zn 2p, (c) In 3d, and (d) S 2p. The black line is for CIZS-0.1 and the red line is for CIZS-1. | ||
To better understand the effect of the Cu content on the band energy structure and optical properties of the QDs, UV-vis DRS and PL spectra were systematically investigated. Fig. 4a shows the absorption spectra of the QDs. The absorption edge gradually shifts to a longer wavelength from 494 to 696 nm with the increasing ratio of Cu (CIZS-0.05 to CIZS-2.5), indicating that absorption was enormously promoted in the visible light range along with continuous bandgap narrowing with the introduction of Cu. Fig. 4b shows the color change of QDs from light yellow (CIZS-0.05) to dark red (CIZS-2.5) with the increase in Cu content, giving direct evidence that Cu has a prominent influence on light absorption. As shown in Fig. 4c, the bandgap of the QDs was further estimated from the Tauc plot, αhν = A(hν − Eg)1/2, where Eg, α, ν, and h represent the optical bandgap, absorption coefficient, light frequency, and Planck constant, respectively. It can be easily found that the bandgaps of these materials decrease with the expansion of Cu from 0.05 to 2.5. Table 2 shows the bandgaps of the CIZS QD samples, in which the bandgap decreases from a wide gap of 2.90 eV to a narrow gap of 1.98 eV with the increase in Cu content, suggesting that the introduction of Cu brings an excellent bandgap tuning ability for utilizing solar light in the visible light range. This may be due to the lifting of the valence band which results from the contribution of the Cu 3d orbital that is higher than the S 3p orbital.47
 | ||
| Fig. 4 (a) UV-vis DRS, (b) photograph of QD powder, (c) corresponding Tauc plots for bandgap estimation of all samples, (d) Mott–Schottky plots, (e) band structures of the CIZS-0.1, CIZS-1 and CIZS-2 QDs, and (f) normalized PL spectra (λex = 360 nm) of all the samples. | ||
| Sample CIZS-x | 0.05 | 0.1 | 0.25 | 0.5 | 1 | 1.5 | 2 | 2.5 |
| Bandgap/eV | 2.90 | 2.59 | 2.41 | 2.33 | 2.27 | 2.12 | 2.08 | 1.98 |
The Mott–Schottky plots of the QDs were used to estimate the flat band potential in the 0.5 M K2SO4 electrolyte system as shown in Fig. 4d. The obtained linear fittings show the intercepts at −0.710, −0.778, −0.848 V versus the Ag/AgCl electrode (or −0.503, −0.571, and −0.641 V vs. NHE) for the CIZS-0.1, CIZS-1, and CIZS-2 QDs, respectively.48 Combining with the bandgap values, it can be seen that both the conduction band and valence band (2.087, 1.699, and 1.399 V for CIZS-0.1, CIZS-1, and CIZS-2) are simultaneously affected by the introduction of Cu (Fig. 4e). Moreover, it was also reported that the continuousness of the valence band can be improved by hybridization of Cu 3d and S 3p orbitals.49 Generally, the absorption edge and the band structure of the alloyed semiconductor QDs can be affected by the constituent composition in several aspects.50 And the QDs with diverse optical bandgaps possess different light absorption properties and driving powers for splitting water to evolve H2. The tuned PL of QDs was also observed through the control of the Cu content as shown in Fig. 4f. The emission peak exhibits a significant red shift from 517 nm to 711 nm with an increasing Cu/In ratio from 0.05:10 to 2.5:10. This phenomenon of the red shift is in good accordance with that of the absorption spectra.51
To further investigate the influence of Cu on the QDs, photocatalytic water splitting for H2 production was carried out using the QDs. Three sets of experiments were carried out using pure QDs without Pt with sacrificial reagents, QDs with Pt and sacrificial reagents, and QDs with Pt in pure water without sacrificial reagents. For the first two sets of tests, 0.25 M sodium sulfite and 0.35 M sodium sulfide served as sacrificial reagents to prohibit the photocorrosion of sulfide photocatalysts. Fig. 5a displays the evolved H2 using the QDs with different contents of Cu in the absence of cocatalysts. The amount of H2 increases for all the QDs along with the irradiation time and the value is 458.7 μmol g−1 for CIZS-0.1 in 5 h, which is the best photocatalytic performance observed among all samples. Fig. 5b shows the rate of H2 production for the as-prepared QDs. The best rate of H2 evolution of 91.8 μmol h−1 g−1 was observed for CIZS-0.1, which is 1.9 times higher than that of CIZS-0.05. The H2 production rate increased with the increase of the Cu component first due to the bandgap narrowing from the effect of the Cu content and then started to decrease that may result from a number of non-radiative carrier recombination centers caused by excess Cu defects.36,37
 | ||
| Fig. 5 Time-dependent H2 evolution curves (a) and H2 production rates (b) using the pure CIZS-0.05, CIZS-0.1, CIZS-0.5, CIZS-1, and CIZS-2 QDs without any cocatalyst. The H2 evolution curves (c) and H2 production rates (d) of the QDs with 2 wt% Pt as the cocatalyst. The photocatalytic reaction was performed with 100 mg of photocatalysts dispersed in 0.1 L of 0.35 M Na2S and 0.25 M Na2SO3 under irradiation of a solar simulator (100 mW cm−2) with a 420 nm cut-off filter. | ||
The amount and rate of H2 production for the QDs loaded with 2 wt% Pt cocatalysts show a distinctively different varying trend, as shown in Fig. 5c and d. Fig. 5c shows the optimum H2 production of 2282.2 μmol g−1 from CIZS-1-Pt within 5 h that is 2.0 times higher than that of CIZS-0.1-Pt, while that of the CIZS-1 is about 2 times lower than that of CIZS-0.1 without Pt (Fig. 5b) in the photocatalytic reaction system. As shown in Fig. 5d, the best rate of H2 generation is 456.4 μmol h−1 g−1 for Pt loaded CIZS-1, indicating that Pt loading changes the performance trend of the QDs and, more importantly, increases the tolerance of Cu incorporation. On the one hand, the QDs with Pt loading display a higher hydrogen production rate than the pristine QDs. The enhanced photocatalytic activity can be ascribed to the cocatalytic effect of Pt, which resulted from a decreased hydrogen production barrier as well as the increased charge separation at the QD/Pt interfaces.52,53 More importantly, the H2 production rate of CIZS-1-Pt is 11.1 times faster than that of pure CIZS-1, while that of CIZS-0.1-Pt is only 2.5 times faster than that of CIZS-0.1, suggesting that the promotion effect for the more heavily doped CIZS-1 is much greater than that for CIZS-0.1 under the same conditions. This means that the tolerance of Cu incorporation for the QDs was promoted by Pt loading. It is important to note that the cocatalyst-induced charge separation excellently releases the defect-induced charge recombination and results in an improved tolerance of Cu in the narrow-bandgap photocatalysts, even down to ∼2 eV (CIZS-2).
The potential of overall water splitting of the Pt loaded QDs was further tested for photocatalytic H2 generation in pure water in the absence of the sacrificial reagents. As shown in Fig. 6a, the amount of H2 production is 22.6 μmol g−1 in 5 h for CIZS-1 that is 2.0 times over that of CIZS-0.1 in a pure water photocatalytic system, which is in accordance with the situation with both the cocatalyst and the sacrificial reagents. This suggests that the CIZS QDs are efficient photocatalysts for H2 production even without the sacrificial reagents. Fig. 6b shows that the trend of different photocatalysts for H2 production increases from 1.4 μmol h−1 g−1 (CIZS-0.1) to 2.6 μmol h−1 g−1 (CIZS-1) and then reduces to 0.9 μmol h−1 g−1 (CIZS-2), which is a steady trend regardless of whether there are sacrificial reagents in the photocatalytic system, further demonstrating the key role of cocatalyst-induced charge separation during photocatalysis. This indicates that H2 generation actually originates from photocatalysis via QDs rather than the sacrificial reagents. This also demonstrates the potential of these narrow bandgap sulfides for overall water splitting upon a more profound study of the interaction between the semiconductors and cocatalysts.
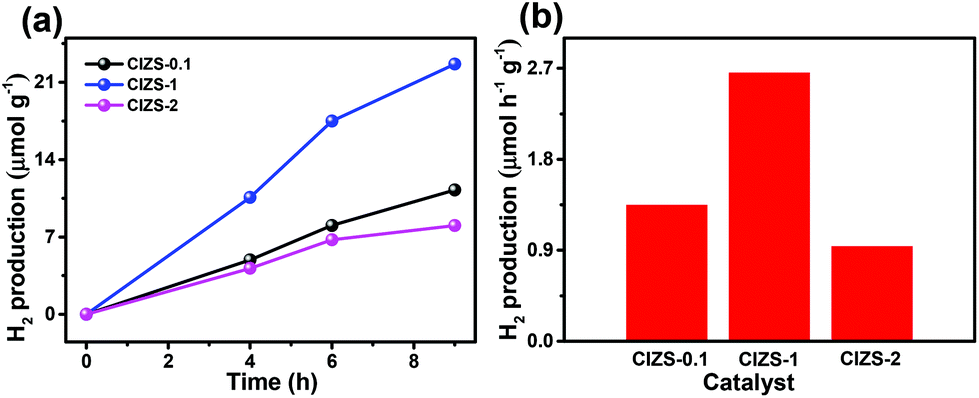 | ||
| Fig. 6 (a) Photocatalytic H2 generation and (b) the H2 production rate from overall water splitting using CIZS-0.1, CIZS-1, and CIZS-2 samples in a pure water system with 2 wt% Pt as the cocatalyst. | ||
The photocatalytic stability of photocatalysts is essential for practical applications. A cycle photocatalysis test was used to determine the photostability of CIZS-1 with and without Pt loading. After each run, the photocatalyst was recovered and re-dispersed into aqueous solution containing fresh Na2S and Na2SO3 as hole scavengers. Fig. 7a shows that the H2 generation decreases 30% after three successive recycling tests in the absence of the Pt cocatalyst, which may be attributed to the photocorrosion of the sulfides. The loss of photocatalysts in the recycling process may be another reason for this activity reduction due to the difficulty in collection of the small-sized QDs. Fig. 7b shows the recycling stability test of CIZS-1 loading with 2 wt% Pt under visible light irradiation. After three recycling attempts, the amount of H2 production reduces 15%, which illustrates that the photocatalytic stability is improved with the existence of the cocatalyst due to the improved separation of the photoinduced charge carriers.
 | ||
| Fig. 7 Cycle runs of photocatalytic H2 production over the CIZS-1 QDs (a) without any cocatalyst, and (b) with 2 wt% Pt as the cocatalyst. | ||
Based on the results, a plausible mechanism for photocatalysis was proposed. As shown in Scheme 1, the bandgap was reduced from 2.59 to 2.27 eV, as the Cu content increased from 0.1 to 1, giving a superior bandgap with enhanced absorption of visible light. With extra Cu, a lower photocatalytic activity was caused by the defects that act as a recombination center for the photogenerated charge carriers, similar to the literature results.31 With Pt as the cocatalyst, photoexcited electrons in photocatalyst materials were rapidly transferred to the Pt sites on the surface of photocatalysts to reduce water, which competes with trapping and recombination processes caused by excessive Cu in the CIZS QDs. It is generally known that QDs with a small particle size possess more active sites on the surface, facilitating hydrogen production. For the multinary sulfide QDs without cocatalysts, the active sites are usually believed to be the surface S atoms for accepting the photogenerated electrons and reducing the adsorbed H+ to H2 according to the literatures.54–58 With Pt loading, the active sites for generating H2 changed from the QDs to the Pt sites after loading Pt due to a higher redox potential.53,59–61 The photogenerated electrons in the QDs can be effectively grabbed by the Pt active sites and reduce the adsorbed H+ on the surface into H2. In this way, Pt dramatically promotes the separation of photogenerated electron and hole pairs. The Cu defect-induced charge recombination can be effectively relieved by a cocatalyst-induced charge transfer, which remarkably improves the activity of photocatalytic H2 evolution that is crucial for the narrow-bandgap sulfides. Although substantial work has been conducted on the effect of Cu content in a number of multinary sulfide photocatalysts, both bulk and nanostructured, this cocatalyst-enhanced tolerance of Cu has not been reported before. A possible reason may be that many studies only investigated the photocatalytic activity either with Pt or without Pt, rather than a systematic comparison of both cases as presented in this work. Additionally, the high-level Cu content in traditional bulk or nanoflower sulfide photocatalysts may result in the nonuniform distribution and possible agglomeration of Cu that adds additional difficulty in the demonstration of the competing effects of Cu.36,37
 | ||
| Scheme 1 Schematic demonstration of the relaxation processes in the Cu–In–Zn–S QDs with an increased Cu content and with Pt loading. | ||
As discussed above, the improved photocatalytic activity was attributed to the improved transfer of the photoinduced carriers to the cocatalyst, which alleviates the defect-induced charge recombination. PL measurement and the photoelectrochemical tests were utilized to further verify the mechanism. It was observed that the PL quantum yield essentially decreased from 5.9% to 3.1% with the increase in the ratio of Cu:In from 0.05:10 to 2:10 under the excitation wavelength of 450 nm measured without Pt loading (Fig. 8a). To a certain extent, this reduction indicated the increased amount of defect states caused by extra Cu. The impedance radius of CIZS-1 is larger than that of CIZS-0.1, suggesting that CIZS-1 exhibits higher current resistance that may be attributed to a higher rate of charge recombination (Fig. 8b). Excessive copper may cause more recombination centers of charge carriers. Furthermore, the PL spectra of the samples are shown in Fig. 8c. Obviously, the PL intensity of the QDs loaded with 2 wt% Pt is lower than that of the unmodified QD catalysts, suggesting that the radiative recombination of excited electron–hole pairs is quenched due to the effective transfer of photogenerated electrons from the catalyst to the Pt cocatalyst.
 | ||
| Fig. 8 (a) PL quantum yield of QD samples with varied Cu contents before loading Pt. (b) Nyquist plots of the CIZS-0.1 and CIZS-1 QDs. (c) PL spectra of the CIZS-1 and CIZS-1-Pt samples. | ||
Conclusions
In summary, the alloyed Cu–In–Zn–S QDs were successfully prepared by a one-pot hydrothermal approach with varied amounts of Cu. The bandgap was effectively narrowed with an increase in the content of Cu in the QDs. The CIZS-0.1 QDs showed the best photocatalytic performance of 91.8 μmol h−1 g−1 in the absence of cocatalysts. After loading the Pt cocatalyst, the highest H2 production rate of 456.4 μmol h−1 g−1 was observed for CIZS-1 QDs under visible light irradiation. The change in the performance trend and the 10-times enhanced tolerance of Cu incorporation were mainly attributed to the competing effect of Cu-defect-induced charge recombination and cocatalyst-induced charge separation, which facilitates the visible light absorption and separation of the charge carriers. This study on the influencing factor of the Cu amount has a profound significance in the development of narrow-bandgap sulfide photocatalysts for H2 production.Conflicts of interest
The authors declare no competing financial interest.Acknowledgements
We would like to acknowledge support from the National Natural Science Foundation of China (21501072 and 21522603), the Jiangsu Specially-Appointed Professors Program, the Chinese–German Cooperation Research Project (GZ1091), the Natural Science Foundation of Jiangsu Province (BK20150489), the “Innovative and Entrepreneurial Doctor” Program of Jiangsu Province, the China Postdoctoral Science Foundation (2016M590419), the Jiangsu Province Postdoctoral Foundation (1501027A), and the Start Funding of Jiangsu University (15JDG011 and 15JDG027).References
- A. Fujishima and K. Honda, Nature, 1972, 238, 37 CrossRef CAS PubMed.
- J. Kou, C. Lu, J. Wang, Y. Chen, Z. Xu and R. S. Varma, Chem. Rev., 2017, 117, 1445 CrossRef CAS PubMed.
- L. Zang, Acc. Chem. Res., 2015, 48, 2705 CrossRef CAS PubMed.
- D. Kang, T. W. Kim, S. R. Kubota, A. C. Cardiel, H. G. Cha and K. S. Choi, Chem. Rev., 2015, 115, 12839 CrossRef CAS PubMed.
- Y. Hong, Z. Fang, B. Yin, B. Luo, Y. Zhao, W. Shi and C. Li, Int. J. Hydrogen Energy, 2017, 42, 6738 CrossRef CAS.
- P. Zhang, T. Wang, X. Chang and J. Gong, Acc. Chem. Res., 2016, 49, 911 CrossRef CAS PubMed.
- J. Yang, D. Wang, H. Han and C. Li, Acc. Chem. Res., 2013, 46, 1900 CrossRef CAS PubMed.
- V. Singh, I. J. C. Beltran, J. C. Ribot and P. Nagpal, Nano Lett., 2014, 14, 597 CrossRef CAS PubMed.
- Y. Hong, C. Li, Z. Fang, B. Luo and W. Shi, Carbon, 2017, 121, 463 CrossRef CAS.
- B. Luo, M. Chen, Z. Zhang, J. Xu, D. Li, D. Xu and W. Shi, Dalton Trans., 2017, 46, 8431 RSC.
- Y. Mi, L. Wen, R. Xu, Z. Wang, D. Cao, Y. Fang and Y. Lei, Adv. Energy Mater., 2016, 6, 1501496 CrossRef.
- T. K. Townsend, N. D. Browning and F. E. Osterloh, ACS Nano, 2012, 6, 7420 CrossRef CAS PubMed.
- A. Iwase, S. Yoshino, T. Takayama, Y. H. Ng, R. Amal and A. Kudo, J. Am. Chem. Soc., 2016, 138, 10260 CrossRef CAS PubMed.
- H. Song, Acc. Chem. Res., 2015, 48, 491 CrossRef CAS PubMed.
- M. D. Regulacio and M. Y. Han, Acc. Chem. Res., 2016, 49, 511 CrossRef CAS PubMed.
- L. Shang, C. Zhou, T. Bian, H. Yu, L. Z. Wu, C. H. Tung and T. Zhang, J. Mater. Chem. A, 2013, 1, 4552 CAS.
- J. Chen, F. Xin, X. Yin, T. Xiang and Y. Wang, RSC Adv., 2014, 5, 3833 RSC.
- B. Mao, C. H. Chuang, J. Wang and C. Burda, J. Phys. Chem. C, 2011, 115, 8945 CAS.
- G. Xu, S. Zeng, B. Zhang, M. T. Swihart, K. T. Yong and P. N. Prasad, Chem. Rev., 2016, 116, 1 CrossRef PubMed.
- I. Tsuji, Y. Shimodaira, H. Kato, H. Kobayashi and A. Kudo, Chem. Mater., 2010, 22, 1402 CrossRef CAS.
- S. M. Kobosko, D. H. Jara and P. V. Kamat, ACS Appl. Mater. Interfaces, 2017, 9, 33379 CAS.
- T. Kandiel, D. H. Anjum, P. Sautet, T. L. Bahers and K. Takanabe, J. Mater. Chem. A, 2015, 3, 8896 CAS.
- C. Ye, M. D. Regulacio, S. H. Lim, Q. H. Xu and M. Y. Han, Chem. – Eur. J., 2012, 18, 11258 CrossRef CAS PubMed.
- X. Yu, X. An, A. Shavel, M. Ibáñez and A. Cabot, J. Mater. Chem. A, 2014, 2, 12317 CAS.
- A. Zhang, C. Dong, L. Li, J. Yin, H. Liu, X. Huang and J. Ren, Sci. Rep., 2015, 5, 15227 CrossRef CAS PubMed.
- P. C. Lin, P. Y. Wang, Y. Y. Li, C. C. Hua and T. C. Lee, Int. J. Hydrogen Energy, 2013, 38, 8254 CrossRef CAS.
- X. Yuan, J. Hua, R. Zeng, D. Zhu, W. Ji, P. Jing, X. Meng, J. Zhao and H. Li, Nanotechnology, 2014, 25, 435202 CrossRef PubMed.
- J. Zhang, R. Xie and W. Yang, ChemInform, 2011, 42, 3357 Search PubMed.
- K. E. Knowles, K. H. Hartstein, T. B. Kilburn, A. Marchioro, H. D. Nelson, P. J. Whitham and D. R. Gamelin, Chem. Rev., 2016, 116, 10821 CrossRef PubMed.
- M. Kruszynska, H. Borchert, A. Bachmatiuk, M. H. Rümmeli, B. Büchner, J. Parisi and J. Kolnyolesiak, ACS Nano, 2012, 6, 5889 CrossRef CAS PubMed.
- S. Shen, L. Zhao, Z. Zhou and L. Guo, J. Phys. Chem. C, 2008, 112, 16148 CAS.
- S. Kundu and A. Patra, Chem. Rev., 2017, 117, 712 CrossRef CAS PubMed.
- K. Iwashina, A. Iwase, Y. H. Ng, R. Amal and A. Kudo, J. Am. Chem. Soc., 2014, 137, 604 CrossRef PubMed.
- A. Teitelboim, N. Meir, M. Kazes and D. Oron, Acc. Chem. Res., 2016, 49, 902 CrossRef CAS PubMed.
- G. H. Carey, A. L. Abdelhady, Z. Ning, S. M. Thon, O. M. Bakr and E. H. Sargent, Chem. Rev., 2015, 115, 12732 CrossRef CAS PubMed.
- W. J. Lee, H. J. Yu, J. H. Wi, D. H. Cho, W. S. Han, J. Yoo, Y. Yi, J. H. Song and Y. D. Chung, ACS Appl. Mater. Interfaces, 1944, 8, 22151 CrossRef PubMed.
- B. B. Srivastava, S. Jana and N. Pradhan, J. Am. Chem. Soc., 2011, 133, 1007 CrossRef CAS PubMed.
- L. Jing, S. V. Kershaw, Y. Li, X. Huang, Y. Li, A. L. Rogach and M. Gao, Chem. Rev., 2016, 116, 10623 CrossRef CAS PubMed.
- G. Gong, Y. Liu, B. Mao, B. Wang, L. Tan, D. Li, Y. Liu and W. Shi, RSC Adv., 2016, 6, 99023 RSC.
- B. Chen, S. Chang, D. Li, L. Chen, Y. Wang, T. Chen, B. Zou, H. Zhong and A. L. Rogach, Chem. Mater., 2015, 27, 5949 CrossRef CAS.
- P. K. Santra, P. V. Nair, K. G. Thomas and P. V. Kamat, J. Phys. Chem. Lett., 2013, 4, 722 CrossRef CAS PubMed.
- P. K. Santra and P. V. Kamat, J. Am. Chem. Soc., 2012, 135, 877 CrossRef PubMed.
- I. Tsuji, H. Kato, H. Kobayashi and A. Kudo, J. Phys. Chem. B, 2005, 109, 7323 CrossRef CAS PubMed.
- B. D. Mao, C. H. Chuang, F. Lu, L. X. Sang, J. J. Zhu and C. Burda, J. Phys. Chem. C, 2013, 117, 648 CAS.
- S. Kim, M. Kang, S. Kim, J. H. Heo, J. H. Noh, S. H. Im, S. I. Seok and S. W. Kim, ACS Nano, 2013, 7, 4756 CrossRef CAS PubMed.
- Z. Liu, A. Tang, M. Wang, C. Yang and F. Teng, J. Mater. Chem. C, 2015, 3, 10114 RSC.
- S. D. Perera, H. Zhang, X. Ding, A. Nelson and R. D. Robinson, J. Mater. Chem. C, 2014, 3, 1044 RSC.
- G. T. Pan, S. Chong and K. L. Pan, Clean Technol. Environ. Policy, 2017, 19, 1557 CrossRef CAS.
- H. Kaga, Y. Tsutsui, A. Nagane, A. Iwase and A. Kudo, J. Mater. Chem. A, 2015, 3, 21815 CAS.
- P. H. Chuang, C. C. Lin and R. S. Liu, ACS Appl. Mater. Interfaces, 2014, 6, 15379 CAS.
- W. W. Xiong, G. H. Yang, X. C. Wu and J. J. Zhu, ACS Appl. Mater. Interfaces, 2013, 5, 8210 CAS.
- X. Zhang, J. Zhao and L. Guo, J. Alloys Compd., 2014, 582, 617 CrossRef CAS.
- M. Sathish, B. Viswanathan and R. Viswanath, Int. J. Hydrogen Energy, 2006, 31, 891 CrossRef CAS.
- M. D. Regulacio and M. Y. Han, Acc. Chem. Res., 2016, 49, 511 CrossRef CAS PubMed.
- Y. Li, G. Chen, Q. Wang, X. Wang, A. Zhou and Z. Shen, Adv. Funct. Mater., 2010, 20, 3390 CrossRef CAS.
- M. Jagadeeswararao, S. Dey, A. Nag and C. N. R. Rao, J. Mater. Chem. A, 2015, 3, 8276 CAS.
- W. Fu, M. Liu, F. Xue, X. Wang, Z. Diao and L. Guo, RSC Adv., 2016, 6, 80361 RSC.
- B. Mao, C. H. Chuang, C. McCleese, J. Zhu and C. Burda, J. Phys. Chem. C, 2014, 118, 13883 CAS.
- Z. W. Seh, J. Kibsgaard, C. F. Dickens, I. Chorkendorff, J. K. Norskov and T. F. Jaramillo, Science, 2017, 355, 4998 CrossRef PubMed.
- K. Wenderich and G. Mul, Chem. Rev., 2016, 116, 14587 CrossRef CAS PubMed.
- H. Tada, T. Kiyonaga and S. Naya, Chem. Soc. Rev., 2009, 38, 1849 RSC.
Footnote |
| † These authors contributed equally to this work. |
| This journal is © the Partner Organisations 2018 |