
Biosynthesis of amino acid functionalized silver nanoparticles for potential catalytic and oxygen sensing applications†
Abhishek
Chandra
and
Man
Singh
 *
*
School of Chemical Sciences, Central University of Gujarat, Gandhinagar-382030, India. E-mail: mansingh50@hotmail.com; abhishekchandra.15@gmail.com
First published on 28th November 2017
Abstract
A green approach to the biosynthesis of amino acid functionalized silver nanoparticles (AgNPs) using Neem gum is reported herein. To the best of our knowledge, this is the first attempt at biosynthesizing AgNPs. The AgNPs show good colloidal stability with surfactants and dyes. The reduction of Methylene blue (MB) by SnCl2 in micellar media, and Congo red/4-nitrophenol by NaBH4 validate the high catalytic efficiency of the AgNPs. This is the first report, as far as we know, on a detailed kinetic study of AgNPs catalyzed MB reduction in cationic, anionic and nonionic micellar media. The highest MB reduction rate was observed in anionic micellar medium with tryptophan functionalized AgNPs. The AgNPs were responsible for the backward oxidation of reduced MB in acidic nonionic micellar medium, which is the first ever demonstration of a one-cycle redox MB clock reaction involving silver nanoparticles. The clock reaction elucidated the potential use of the AgNPs as low-cost sensors for oxygen leakage in vacuum-packed food packages, and for creating an oxygen deficient environment in acidic aqueous and micellar media, where catalyst poisoning by O2 prevails. The deactivation of the catalytic activity of tryptophan functionalized AgNPs observed during the Congo red and 4-nitrophenol reduction may find application in catalytic reduction where improved selectivity is required. With the possibility of the large-scale production of the AgNPs on an economic platform, the AgNPs may thus hold great promise in effective and eco-friendly wastewater treatment, with potential application in oxygen sensing.
1. Introduction
In the design of a new synthetic route for the production of metal nanoparticles, the key factors that merit important consideration include the utilization of nontoxic chemicals, renewable materials and environmentally benign solvents. Compared to physical and chemical processes, biological systems-based synthetic routes for the production of nanoparticles (NPs) are economical and do not pose potential biological and environmental risks.1,2 The production of NPs using plants, as compared to other biological resources, is advantageous on account of the enhanced scalability and safety.3 Plant extracts provide more flexible control over the size, shape, crystallinity, and size distribution of the NPs, with faster synthesis and easy purification.4–6 Many methods have been reported for the synthesis of copper, gold, silver, platinum and iron NPs using plant extracts.7–10 In these methods, the carbonyl, hydroxyl and carboxylic functional groups present in the plant extract facilitate metal ion complexation and reduction. Further, the proteins and polysaccharides present in plant extracts increase the stability and functionality of the NPs.11Compared to other metallic nanoparticles, silver NPs demonstrate superior optical sensing, catalytic and antimicrobial properties. To exhibit these properties efficiently, silver NPs need to be stable and compatible in different aqueous environments, avoiding aggregation and corrosion. Their synthesis methods using plant extracts from leaves,12–16 fruit,17–21 gum,22–26 flowers,27,28 seeds,29–31 and other sources32–36 are well-established, but there are gaps in knowledge regarding their colloidal stability in aqueous media of high ionic strength, variable pH, surfactants, and dyes.
Since the chemical routes to silver NPs synthesis are expensive and hazardous, the discovery and use of new natural resources toward their synthesis is greatly needed. Neem gum (NG) is a water-soluble plant gum exudate from the Azadirachta indica bark and contains proteins, complex polysaccharides and many organic compounds that could facilitate the Ag+ ion reduction to Ag(0).37–41 Such features of NG have encouraged us to use this natural resource as a reductant for the biosynthesis and stabilization of silver nanoparticles (AgNPs). However, due to the complexity of the active functional groups in NG, good colloidal stability of the biosynthesized AgNPs may be difficult to achieve. Amino acids are known to form coordinate complexes with Ag+ ions through various sites such as >C![[double bond, length as m-dash]](https://www.rsc.org/images/entities/char_e001.gif) O, –NH2, –COOH, thiol, imidazole and indole groups.42–44 The formation of the Ag+–amino acid complexes may thus provide a compact domain for the controlled nucleation of Ag nuclei with defined shape and increased stability. Amino acids like histidine (His), tryptophan (Trp), methionine (Met), asparagine (Asp), glutamic acid (Glu) and alanine (Ala) have strong affinity for Ag+ ions;42 they are present in very small amounts in NG, but are not in sufficient amounts to provide the controlled nucleation of Ag.38 Therefore, in order to achieve controlled nucleation with defined shape and enhanced stability in various aqueous environments, the AgNPs are functionalized with Ala, Trp, Met, His, Glu, and Asp, and are noted as f-AgNPs.
O, –NH2, –COOH, thiol, imidazole and indole groups.42–44 The formation of the Ag+–amino acid complexes may thus provide a compact domain for the controlled nucleation of Ag nuclei with defined shape and increased stability. Amino acids like histidine (His), tryptophan (Trp), methionine (Met), asparagine (Asp), glutamic acid (Glu) and alanine (Ala) have strong affinity for Ag+ ions;42 they are present in very small amounts in NG, but are not in sufficient amounts to provide the controlled nucleation of Ag.38 Therefore, in order to achieve controlled nucleation with defined shape and enhanced stability in various aqueous environments, the AgNPs are functionalized with Ala, Trp, Met, His, Glu, and Asp, and are noted as f-AgNPs.
Despite the structural potential of amino acids to interact with silver, and the presence of electron rich active components in plant extracts, there have been no reports on their combined impact on silver NPs formation, their colloidal stability and applicability. Our studies on the f-AgNPs would thus lead the way in establishing an operational link between the AgNPs and the structural activities of amino acids and electron rich active components in plant extracts. This study is the first of its kind to investigate the effects of pH, ionic strength, surfactant, and dyes on the colloidal stability of the f-AgNPs, and it fills the gap regarding AgNPs science and the correlation with natural resources for the advanced understanding of bio-nanomaterials; furthermore, this study widens the applicability of the AgNPs. We have also initiated studies based on the effects of cationic, anionic and nonionic surfactants on the f-AgNPs colloidal stability. A similar model has been extended to cationic and anionic dyes, and such studies are yet to be reported.
The good colloidal stability of the AgNPs prompted us to use them as catalysts for reduction reactions. The catalytic efficiency of the AgNPs was studied for the reduction of Methylene blue (MB) by acidic SnCl2 in aqueous and micellar media, and for the reduction of Congo red and 4-nitrophenol by NaBH4 in aqueous media. Very limited work has been reported on silver NPs catalyzed MB reduction in micellar media and the detailed kinetics. Ghosh et al. demonstrated the silver and gold NPs catalyzed reduction of MB by NaBH4 in the presence of sodium arsenate in a sodium dodecyl sulfate (SDS) micellar system.45 However, the focus of their work was on the quantitative estimation of arsenic and hence, no kinetic investigation was offered on the NPs catalyzed MB reduction in anionic micellar systems. Pal et al. studied micellar catalyzed MB reduction by ascorbate ions and observed that cationic micellar catalysis in the presence of ascorbate ion was much higher than the reduction rate in the presence of silver NPs in aqueous solution.46 Here also, no kinetic study was carried out on the silver NPs catalyzed MB reduction in micellar systems. Jiang and co-workers in their study on silver NPs supported on silica spheres catalyzed dye reduction showed that cationic, anionic and nonionic surfactants decrease the reduction rate of the dyes by deactivating or poisoning the catalyst.47 Furthermore, the earlier reports on the redox MB clock reaction were fast and reversible up to many cycles,48–50 and therefore, kinetic studies on the backward oxidation of reduced MB to oxidized MB were not possible. Previously, the MB clock reaction did not have any practical application other than as an example of a simple and crowd-pleasing demonstration of a clock reaction. In this study, for the first time, we report the kinetics of the backward oxidation of reduced MB and illustrate a possible practical application of the one cycle redox MB clock reaction in the presence of the AgNPs as low cost sensors for oxygen leakage in vacuum-sealed packages. The catalyzed MB reduction revealed that some of the f-AgNPs could be successfully used to create an O2 deficient environment in acidic aqueous and micellar media, where catalyst poisoning by O2 prevails.
In this study, the combined science of AgNPs in association with NG and amino acids on catalytic reduction have revealed some new findings, such as pseudo-second order kinetics for MB reduction, increased MB reduction rate in anionic micellar medium, and selective catalytic reduction, which to the best of our knowledge, have not been reported before with silver NPs. The present work has therefore opened a new domain in the biosynthesis of AgNPs, wherein plant extracts in combination with amino acids, flavonoids, proteins and many others may act as valuable natural resources and could be used for manipulating AgNPs surface activities with wider and potential applications.
2. Experimental section
2.1. Materials and methods
Neem gum (NG) was collected from neem trees located at Gandhinagar, India. The following were procured from Sigma-Aldrich and used as received: L-alanine (Ala) (A7469), D-tryptophan (Trp) (T9753), L-methionine (Met) (M9625), L-histidine (His) (H8000), L-glutamic acid (Glu) (G1251), L-asparagine (Asp) (A0884), AgNO3 (209139), NaOH (S8045), HCl (320331), NaCl (S7653), dodecyltrimethylammonium bromide (DTAB) (D5047), sodium dodecyl sulfate (SDS) (L6026), octyl β-D-glucopyranoside (OGP) (O8001), dioctyl sulfosuccinate sodium salt (AOT) (D1685), Tween-20 (T-20) (P1379), sodium borohydride (NaBH4) (71320), 4-nitrophenol (4-NP) (1048), stannous chloride (SnCl2) (208256), Congo red (CR) (C6277), and Methylene blue (MB) (28514).2.2. Synthesis of amino acid functionalized silver nanoparticles (f-AgNPs)
For the synthesis of f-AgNPs, to 10 mL (2.75% w/v) aqueous NG, 100 μL (1.75 M) of aqueous AgNO3 and 10 mL (0.1 M) of aqueous Ala/Trp/Met/His/Glu/Asp were added. The resulting reaction mixture was transferred to a 50 mL centrifuge tube (Tarson) and incubated for 20 min at 373.15 K. The f-AgNPs dispersion thus obtained was purified by centrifugation at 17![[thin space (1/6-em)]](https://www.rsc.org/images/entities/char_2009.gif) 500g for 20 min, followed by re-dispersion in 100 mL of Milli-Q water. For the synthesis of non-functionalized AgNPs, in place of 10 mL (0.1 M) of aqueous amino acid, 10 mL of water was used. All the dispersions were stored in airtight amber colored bottles at 4 °C, to be used in later experiments. The NPs thus synthesized were non-functionalized AgNPs, and amino acid functionalized AgNPs (f-AgNPs): Ala-AgNP (Ala functionalized AgNPs), Trp-AgNP (Trp functionalized AgNPs), Met-AgNP (Met functionalized AgNPs), His-AgNP (His functionalized AgNPs), Glu-AgNP (Glu functionalized AgNPs), and Asp-AgNP (Asp functionalized AgNPs).
500g for 20 min, followed by re-dispersion in 100 mL of Milli-Q water. For the synthesis of non-functionalized AgNPs, in place of 10 mL (0.1 M) of aqueous amino acid, 10 mL of water was used. All the dispersions were stored in airtight amber colored bottles at 4 °C, to be used in later experiments. The NPs thus synthesized were non-functionalized AgNPs, and amino acid functionalized AgNPs (f-AgNPs): Ala-AgNP (Ala functionalized AgNPs), Trp-AgNP (Trp functionalized AgNPs), Met-AgNP (Met functionalized AgNPs), His-AgNP (His functionalized AgNPs), Glu-AgNP (Glu functionalized AgNPs), and Asp-AgNP (Asp functionalized AgNPs).
UV-visible spectroscopy was used to optimize the reaction parameters such as NG and AgNO3 concentration and reaction time. To optimize the NG and AgNO3 concentration, 10 mL (0.21 to 3% w/v) aqueous NG was added to 100 μL (1.75 M) aqueous AgNO3, and (2.5 to 100 μL) 1.75 M aqueous AgNO3 was added to 10 mL (2.75% w/v) aqueous NG, followed by incubation for 20 min at 373.15 K. For reaction time optimization, spectra were recorded every min for the reaction mixture containing 10 mL (2.75% w/v) aqueous NG and 100 μL (1.75 M) aqueous AgNO3, incubated at 373.15 K.
2.3. Surface functionalization efficiency of amino acids for f-AgNPs
UV-visible absorbance spectroscopy was used to investigate the surface functionalization efficiency (S.F.E.) of the respective amino acids. The development of a purple colored (Ruhemann's purple) complex on reaction of ninhydrin with free α-amino groups of amino acids was the genesis of the S.F.E. In the determination of S.F.E., the supernatants obtained from all the washing cycles of the individual f-AgNPs were mixed together and an aqueous ethanolic solution of ninhydrin was added. The reaction mixture was maintained at 373.15 K for 15 min, for completion of the reaction. The absorbance of the reaction mixtures at 570 nm (λmax of amino acid–ninhydrin complex) was recorded and the concentrations of the respective amino acids in the supernatant were calculated using the standard curve (absorbance vs. concentration) for the amino acids. S.F.E. was calculated using the following formula:where, [Amino acid]i and [Amino acid]s are the concentration of amino acid used for f-AgNPs synthesis, and the concentration of amino acid in the supernatant, respectively.

The absorbance spectra of the purple colored amino acid–ninhydrin complex could be sensitive to the other reactive moieties present in the medium. Since the AgNPs supernatants may contain some reactive moieties (due to NG) that may affect the spectra of the colored complexes, the standard curve of the amino acid–ninhydrin complexes was obtained by dissolving different concentrations of amino acids in the supernatant obtained after washing the non-functionalized AgNP. An aqueous ethanolic solution of ninhydrin was added and the reaction mixture was maintained at 373.15 K for 15 min. The absorbances of these amino acid containing reaction solutions were recorded at 570 nm using a UV-visible spectrophotometer. In all the S.F.E. experiments, the absorbance measurements were performed in triplicate and the overall solution volume and quantity of ninhydrin used were kept constant. Fig. S1† depicts the standard curve for the alanine–ninhydrin complex, illustrating the unreacted Ala concentration during Ala-AgNP synthesis.
For the f-AgNPs, the S.F.E. of Ala, Trp, Met, His, Glu, and Asp were found to be 64.59, 72.09, 78.07, 64.33, 54.13, and 59.58%, respectively. Thus, when 10−3 moles of the amino acids were used to synthesize 100 mL aqueous dispersions of f-AgNPs, 57.54 mg Ala, 147.23 mg Trp, 116.49 mg Met, 99.81 mg His, 79.63 mg Glu, and 78.72 mg Asp were involved in the formation and surface functionalization of Ala-AgNP, Trp-AgNP, Met-AgNP, His-AgNP, Glu-AgNP, and Asp-AgNP, respectively. Interestingly, NG did not develop the purple color on reaction with ninhydrin, indicating the absence of free amino groups.
2.4. Structural characterization of AgNPs
The UV-visible absorbance spectra were recorded using a UV-visible spectrophotometer, Spectro 2060 plus at 298.15 K. For AgNPs morphology, high-resolution transmission electron microscopy (HR-TEM) was performed using a JEOL JEM-2100 HR-TEM, at 180 kV. X-ray diffraction (XRD) was performed on a Bruker D8 Focus instrument of Cu-Kα wavelength (λ = 1.54 Å), with scanning over a 2θ range of 20–90°, with 0.017° step size. For high-resolution UHV X-ray photoelectron spectroscopy (XPS), an Omicron ESCA+ was used for the compositional confirmation of the AgNPs. The Al Kα radiation of energy 1486.7 eV was operated at 15 kV and 20 mA throughout the measurements. The high-resolution XPS spectra were obtained at pass energy of 20 eV. For the XPS analysis, dried powder samples of AgNPs were mounted on carbon-coated tape. A Malvern Zetasizer 3000 was used to determine the size distribution, polydispersity index (PDI) and zeta potential of the AgNPs. The FTIR spectra were recorded using a PerkinElmer Spectrum 65 series FTIR Spectrophotometer. For FTIR sample preparation, the AgNPs dispersions were dried in a vacuum oven for 24 h at 313.15 K. The dried samples (2 mg) were blended with KBr (200 mg) and pressed into pellets. The pellets were placed in the sample holder and FTIR spectra were recorded in the range 4000–400 cm−1 in transmission mode. The FTIR spectra were derived from the average of 64 scans with 1 cm−1 resolution. The 1H NMR studies were performed on a Bruker Advance 500 MHz instrument at 298.15 K. The second derivative FTIR calculations and Gaussian curve fitting analyses were made using the OriginPro 8 software. The total silver concentration of the AgNPs stock suspension was measured in triplicate by an inductively coupled plasma optical emission spectrometer (ICP-OES; model: 7300 DV, PerkinElmer) against a standard AgNO3 solution.2.5. Colloidal stability of AgNPs
2.6. Catalytic activity of AgNPs
The catalytic efficiency of AgNPs in the reduction of MB by acidic SnCl2 in aqueous/surfactant micellar media, and reduction of CR and 4-NP by NaBH4 in aqueous media were monitored using UV–visible spectroscopy, as reported in the ESI.†3. Results and discussion
3.1. Synthesis of AgNPs
The formation of AgNP by the reduction of Ag+ ions with aqueous NG was illustrated by the concomitant color change of the reaction mixture. As the biosynthesis proceeded, a change in color from colorless to yellowish occurred within 2 min, but a brown color appeared after 20 min (Fig. 1a). The spectra of the dispersion had a characteristic absorption maximum at 420 nm (Fig. 1), attributed to the surface plasmon resonance (SPR) band of silver NPs. For the production of AgNP, the optimum conditions of NG and AgNO3 concentration and reaction time were determined by UV–visible spectroscopy. Fig. 1 shows the UV–visible spectra recorded for the optimized (a) NG concentration, (b) AgNO3 concentration and (c) reaction time. Fig. 1b depicts the UV–visible spectra of AgNP produced using 100 μL (1.75 M) AgNO3 with different NG concentrations, after 20 min incubation at 373.15 K. The population of AgNP increased with increasing NG concentration, depicted by increased absorbance (Fig. 1b). The highest absorbance at 420 nm with 2.75% (w/v) NG illustrates the conversion of all Ag+ ions into Ag(0), and the subsequent decrease in absorbance with >2.75% (w/v) NG illustrates the aggregation of the AgNP. The production of AgNP with 2.75% (w/v) NG was also studied by varying the AgNO3 concentration, as depicted in Fig. 1c. The absorbance increased with increasing AgNO3 concentration, due to the enhancement in the oxidation of hydroxyl groups by Ag+ ions. No change in the absorbance was observed with >100 μL (1.75 M) AgNO3, illustrating that at this AgNO3 concentration, all the reducing agents present in NG were consumed, with no further reduction of Ag+ ion being possible. The synthesis was also assessed by varying the reaction time at fixed NG and AgNO3 concentrations (Fig. 1d). The reducing ability of NG increased with increasing incubation period, possibly because more and more hydroxyl groups were converted to carbonyl groups through oxidation by dissolved oxygen present in water, which in turn reduced the Ag+ ions. The initial blue shift in the SPR peak of AgNP, observed within 3 min of incubation (Fig. 1d), indicates the initiation of a controlled nucleation rate, resulting in decreased particle size. No change in the SPR peak position from 3 min onwards implies the progression of nucleation at a constant rate. Meanwhile, no change in the absorbance after 20 min of incubation indicates complete consumption of the precursors. Thus, based on the optimal results from AgNP synthesis, 10 mL (2.75% w/v) of aqueous NG with 100 μL (1.75 M) aqueous AgNO3 and 20 min as reaction time were used to synthesize the f-AgNPs with 10 mL (0.1 M) aqueous Ala/Trp/Met/His/Glu/Asp.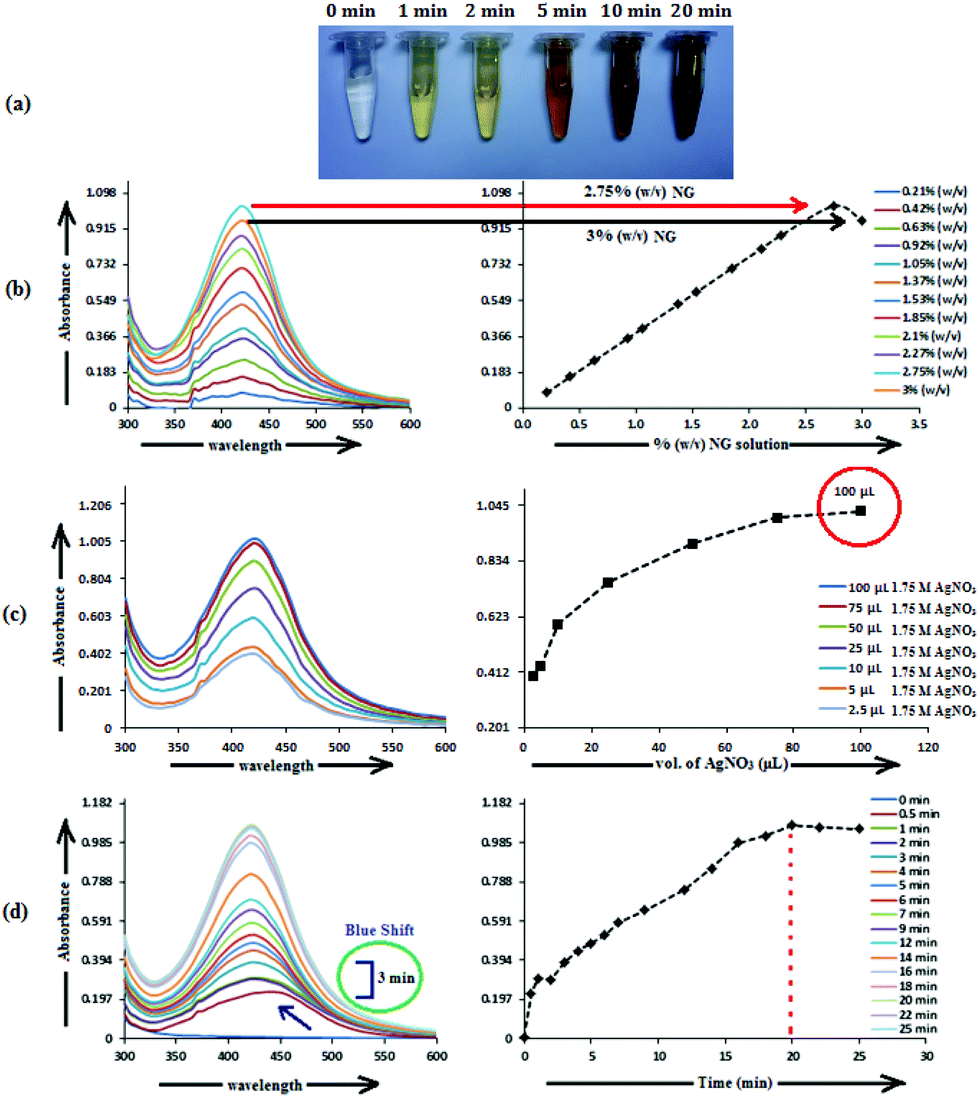 | ||
| Fig. 1 (a) Color change of the reaction mixture during the biosynthesis of AgNP, (b) the optimization plot for NG concentration, (c) the optimization plot for AgNO3 concentration, and (d) the optimization plot for reaction time for the biosynthesis of AgNP. | ||
3.2. Characterization of AgNPs
The HR-TEM micrographs revealed that AgNP were irregular shaped, while the f-AgNPs were primarily spherical shaped with no agglomeration (Fig. 2), and size ranging from 5 nm to 50 nm (Table 1). The hydrodynamic diameter of the AgNPs, measured by DLS showed an average diameter of 14–39 nm, with relatively narrow size distribution (PDI) (Table 1). It appears that the amino acids, with their high complexation ability toward the Ag+ ion, resulted in ordered nucleation of the Ag nuclei, thereby providing a narrow size distribution for the f-AgNPs. Furthermore, the amino acids could have associated around the NG constituents at the f-AgNPs surface by H-bonding, thereby preventing further nucleation. In the absence of amino acids, disordered nucleation could have resulted in a wider size distribution for the AgNP colloids (Table 1). Amino acids therefore play a monitoring role during the nucleation and growth process of the f-AgNPs and based on their affinity towards Ag+ ions, they vary the size distribution of the f-AgNPs. Fig. S2† depicts the HR-TEM micrographs of AgNPs, revealing capping by proteins and polysaccharides in NG, wherein Trp-AgNP and His-AgNP exhibit thick layers of capping over their surfaces.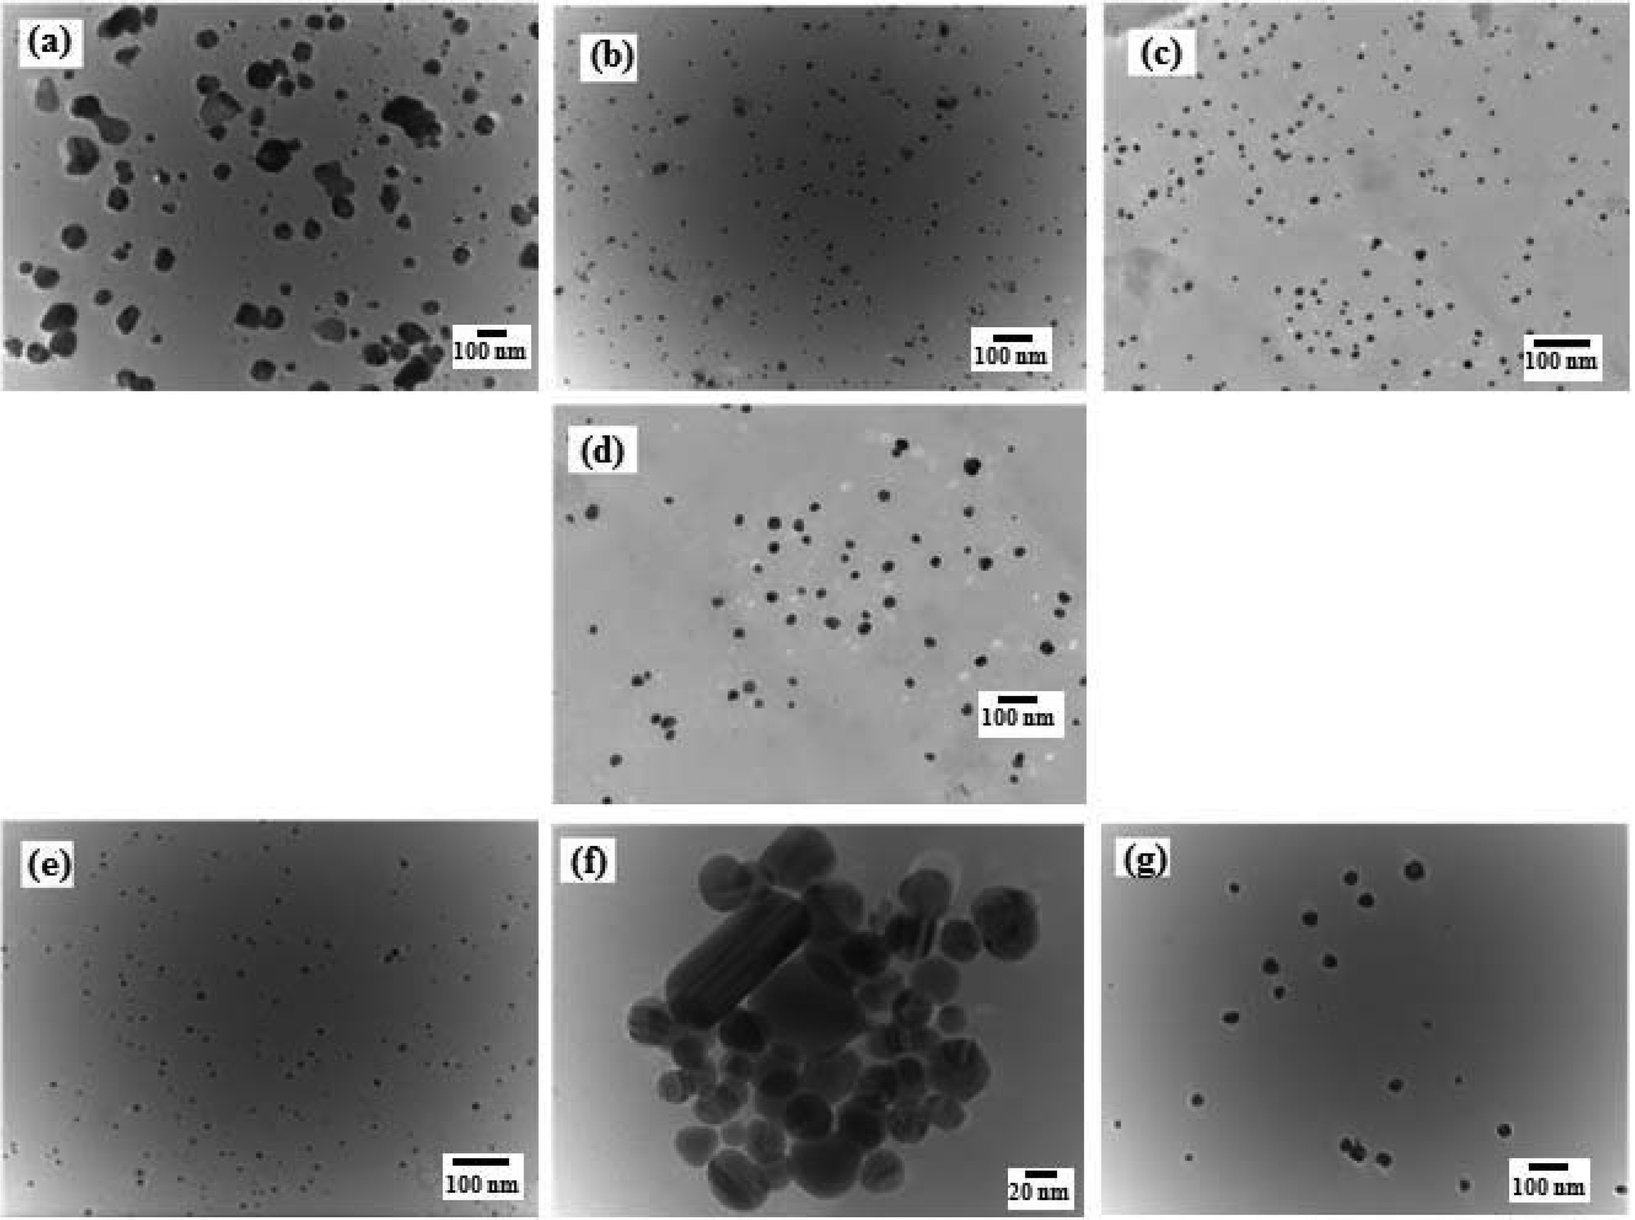 | ||
| Fig. 2 HR-TEM micrographs of (a) AgNP (b) Ala-AgNP (c) Trp-AgNP (d) Met-AgNP (e) His-AgNP (f) Glu-AgNP (g) Asp-AgNP. | ||
| AgNPs | Size range in nm (HR-TEM) | Average diameter in nm (DLS) | PDI | Zeta potential (mV) |
|---|---|---|---|---|
| AgNP | 5–50 | 39 ± 24 | 0.602 ± 0.078 | −20.68 ± 1.01 |
| Ala-AgNP | 5–40 | 40 ± 7 | 0.176 ± 0.025 | −40.98 ± 1.56 |
| Trp-AgNP | 5–20 | 14 ± 3 | 0.215 ± 0.029 | −80.84 ± 2.73 |
| Met-AgNP | 15–35 | 34 ± 9 | 0.268 ± 0.035 | −53.93 ± 2.15 |
| His-AgNP | 5–20 | 25 ± 8 | 0.333 ± 0.041 | −72.22 ± 2.12 |
| Glu-AgNP | 20–30 | 30 ± 8 | 0.283 ± 0.039 | −63.85 ± 2.29 |
| Asp-AgNP | 10–40 | 38 ± 12 | 0.499 ± 0.067 | −47.50 ± 1.89 |
For investigating the crystalline structure of the AgNPs, XRD analysis was performed. The XRD patterns of the AgNPs are shown in Fig. 3. The d-spacings obtained from XRD are consistent with the standard cubic Ag2O and Ag phases. The sharp diffraction peaks indicate the high crystallinity of the Ag2O and Ag crystallites, and were indexed to fcc cubic silver (JCPDS PDF 04-0783)51 and cubic Ag2O (JCPDS 76-1393),52 reported in Table S1.† The sizes of Ag and Ag2O crystallites were calculated using the Debye–Scherrer equation (Table S1†). The cubic Ag planes are in close agreement with the unit cell of the fcc structure (JCPDS file no. 87-0720)53 with a lattice parameter of a = 4.09 Å. The Ag2O planes are in close agreement with the unit cell of a hexagonal structure (JCPDS file no. 76-1393) with a lattice parameter of a = 4.76 Å. The 100% intensity peak of Ag (111) planes illustrate the maximum concentration of Ag crystallites in Trp-AgNP and His-AgNP. Fig. S3† elucidates the percentage of Ag and Ag2O crystallite planes in the AgNPs. Ala, Trp and His seem to be responsible for Ag (200) plane formation in Ala-AgNP, Trp-AgNP and His-AgNP, respectively. Furthermore, Trp and His assist in Ag (111) plane formation, while Ala, Glu, and Asp assist in Ag2O (111) plane formation. Moreover, Trp, Met and His strongly suppress the Ag2O (110) plane formation in the f-AgNPs. Therefore, during the nucleation and growth stages of the f-AgNPs, amino acids introduce peculiar features into their crystalline structures, which may improve their functionality and stability. Fig. S2† illustrates the HR-TEM micrograph of AgNPs depicting the lattice spacing of the Ag (111)/Ag2O (110) plane, in good agreement with the XRD results. The biosynthesis of the Ag/Ag2O nanocomposites thus observed in this work establishes a functional linkage between their formation and the structural activities of amino acids and the electron rich active components of plant extracts, and adds to an otherwise limited area of literature.54,55
 | ||
| Fig. 3 XRD patterns of (a) AgNP (b) Ala-AgNP (c) Trp-AgNP (d) Met-AgNP (e) His-AgNP (f) Glu-AgNP (g) Asp-AgNP. | ||
The capping of f-AgNPs by proteins and polysaccharides in NG and their functionalization with amino acids introduce electron rich sites at the surface of the f-AgNPs. With these electron rich sites, a negatively charged electrostatic double-layer is formed around the f-AgNPs colloids in water. The overall negative charge carried by these electrostatic double-layers governs the colloidal stability of the f-AgNPs. Hence, zeta potential measurement of the f-AgNPs colloids is inevitable, providing a clear view of their stability. NG contains complex polysaccharides that are rich in uronic acid, which is for the most part in the form of D-glucuronic acid and aldobiuronic acid.37–41 The negative zeta potential of the AgNPs (Table 1) may therefore be due to the negatively charged carboxyl groups present in the complex polysaccharides of NG, which get adsorbed over the surface of the AgNPs. The higher negative zeta potential observed for the f-AgNPs may be due to their functionalization with amino acids. Since amino acids contain the carboxyl group, the surface functionalization with amino acids may thus increase the concentration of carboxyl groups adsorbed at the f-AgNPs surface, thereby making their surface more negatively charged. A high value of zeta potential denotes a high electrical charge on the surface of AgNPs, which can cause a strong electrostatic repulsive force among the nanoparticles to prevent agglomeration, and increase colloidal stability. Thus, functionalization with amino acids may have resulted in the higher colloidal stability of the f-AgNPs compared to the AgNP (non-functionalized).
The AgNPs surface chemistry was further explored by FTIR spectroscopy. Fig. 4 shows the FTIR spectra of NG, AgNP, and Trp-AgNP. The FTIR spectra of Trp-AgNP are also the representative spectra of f-AgNPs, since the f-AgNPs spectra were similar. The IR spectrum of NG shows specific peaks at 1076, 1307, 1554, 1644, 2090, 2934 and 3394 cm−1. The stretching vibration band at 1307 cm−1 indicates the C–N aromatic functional groups of proteins in NG.56 The peak at 1644 cm−1 in the amide I band (1700–1600 cm−1) corresponds to CO stretching modes, while the peak at 1554 cm−1 in the amide II band (1600–1500 cm−1) is due to the N–H bending and C–N stretching modes of the peptide linkages of proteins in NG.57 The bands at 1076 and 3394 cm−1 indicate the presence of amine and hydroxyl groups, respectively.58 The broad band at 2090 cm−1 could be assigned to various carbonyl species, while the band at 2934 cm−1 corresponds to asymmetric stretching and scissoring vibrations of various methylene groups present in NG.23 In comparison with the FTIR spectrum of NG, major shifts for the AgNPs were observed in the regions of 1700–1500 cm−1 and 3500–3300 cm−1, suggesting the presence of carbonyl, carboxyl, hydroxyl and amino groups at their surface. The changes associated with the vibrational energies of these groups present in NG and amino acids may provide detailed information on their association with the AgNPs. In view of this, the FTIR spectra of NG, AgNP, and Trp-AgNP were deconvoluted in the regions of 1700–1500 cm−1 and 3500–3300 cm−1, and a Gaussian multiple-peak-fitting procedure was employed after baseline correction (Fig. S4†). The multiple peaks resulting from the deconvolution indicate changes associated with the vibrational energies of carbonyl, carboxyl, hydroxyl and amino groups, while the area under the deconvoluted peaks may represent the qualitative changes associated with their composition. The relative changes (peak center and peak area) perceived in the deconvoluted spectra of AgNP and Trp-AgNP, when compared with of that NG (Fig. S4†) confirmed that the carbonyl, carboxyl, hydroxyl, and amine groups resulting from amino acid and NG proteins are strongly bound to the AgNPs surfaces. These spectral changes mostly originated from to changes in N–H bending, C–N stretching and CO stretching vibrations of the amide linkage of proteins, carboxylic stretching vibrations of uronic acid, O–H stretching vibrations of polyphenols and stretching vibrations of –C–O–C– linkages of flavonoids present in NG along with N–H, carbonyl and carboxylic stretching vibrations in amino acids. The variable area under the deconvoluted peaks (Fig. S4†) for AgNP and Trp-AgNP indicate that their growth process is regulated by changing the interaction dynamics induced by amino acids. No specific band at ∼877 cm−1 corresponding to Ag–O bonds was observed in the FTIR spectra of AgNPs, contrary to the XRD results that showed the presence of Ag2O. This may be due to the strong binding of amino acids to the f-AgNPs surfaces and robust capping by the polysaccharides and proteins of NG (see Fig. S1†).
 | ||
| Fig. 4 FTIR spectra of NG, AgNP, and Trp-AgNP. | ||
For better understanding the surface chemistry of the AgNPs and their interactions with NG and amino acids, X-ray photoelectron spectroscopy (XPS) analysis was performed. Fig. 5 shows the fully scanned spectrum of the AgNPs in the range of 200 eV to 800 eV. In the XPS survey spectra, the atoms of C, N, O and Ag were detected, with no other peaks, indicating the high purity of the AgNPs. The high-resolution Ag 3d spectrum of the AgNPs (Fig. S5†) demonstrated two peaks at ≈368 eV (Ag 3d5/2) and ≈374 eV (Ag 3d3/2) with a peak splitting of ≈6.0 eV, which corresponds to metallic silver (Ag0).59 The peak shape of the Ag 3d5/2 and Ag 3d3/2 levels suggest that a single Gaussian peak function cannot be successfully applied to fit each Ag 3d level. Therefore, each Ag 3d level was deconvoluted into two splitting peaks, and the corresponding binding energies are tabulated in Table S2.† The deconvoluted curve of the Ag 3d5/2 level were well fitted by two peaks centered at ≈368.2 eV and ≈367.3 eV, corresponding to Ag0 and Ag2O, respectively,60,61 illustrating the presence of both forms of silver in the AgNPs and supporting the XRD results. The estimated percentage of Ag0 and Ag2O in the AgNPs was calculated from the ratio of the area under the curve of the splitting peaks of Ag 3d5/2 level and are reported in Table S3.† Table S3† indicates that Trp-AgNP, Met-AgNP, and His-AgNP have >70% Ag0 content, while AgNP, Ala-AgNP, and Asp-AgNP have <40%.
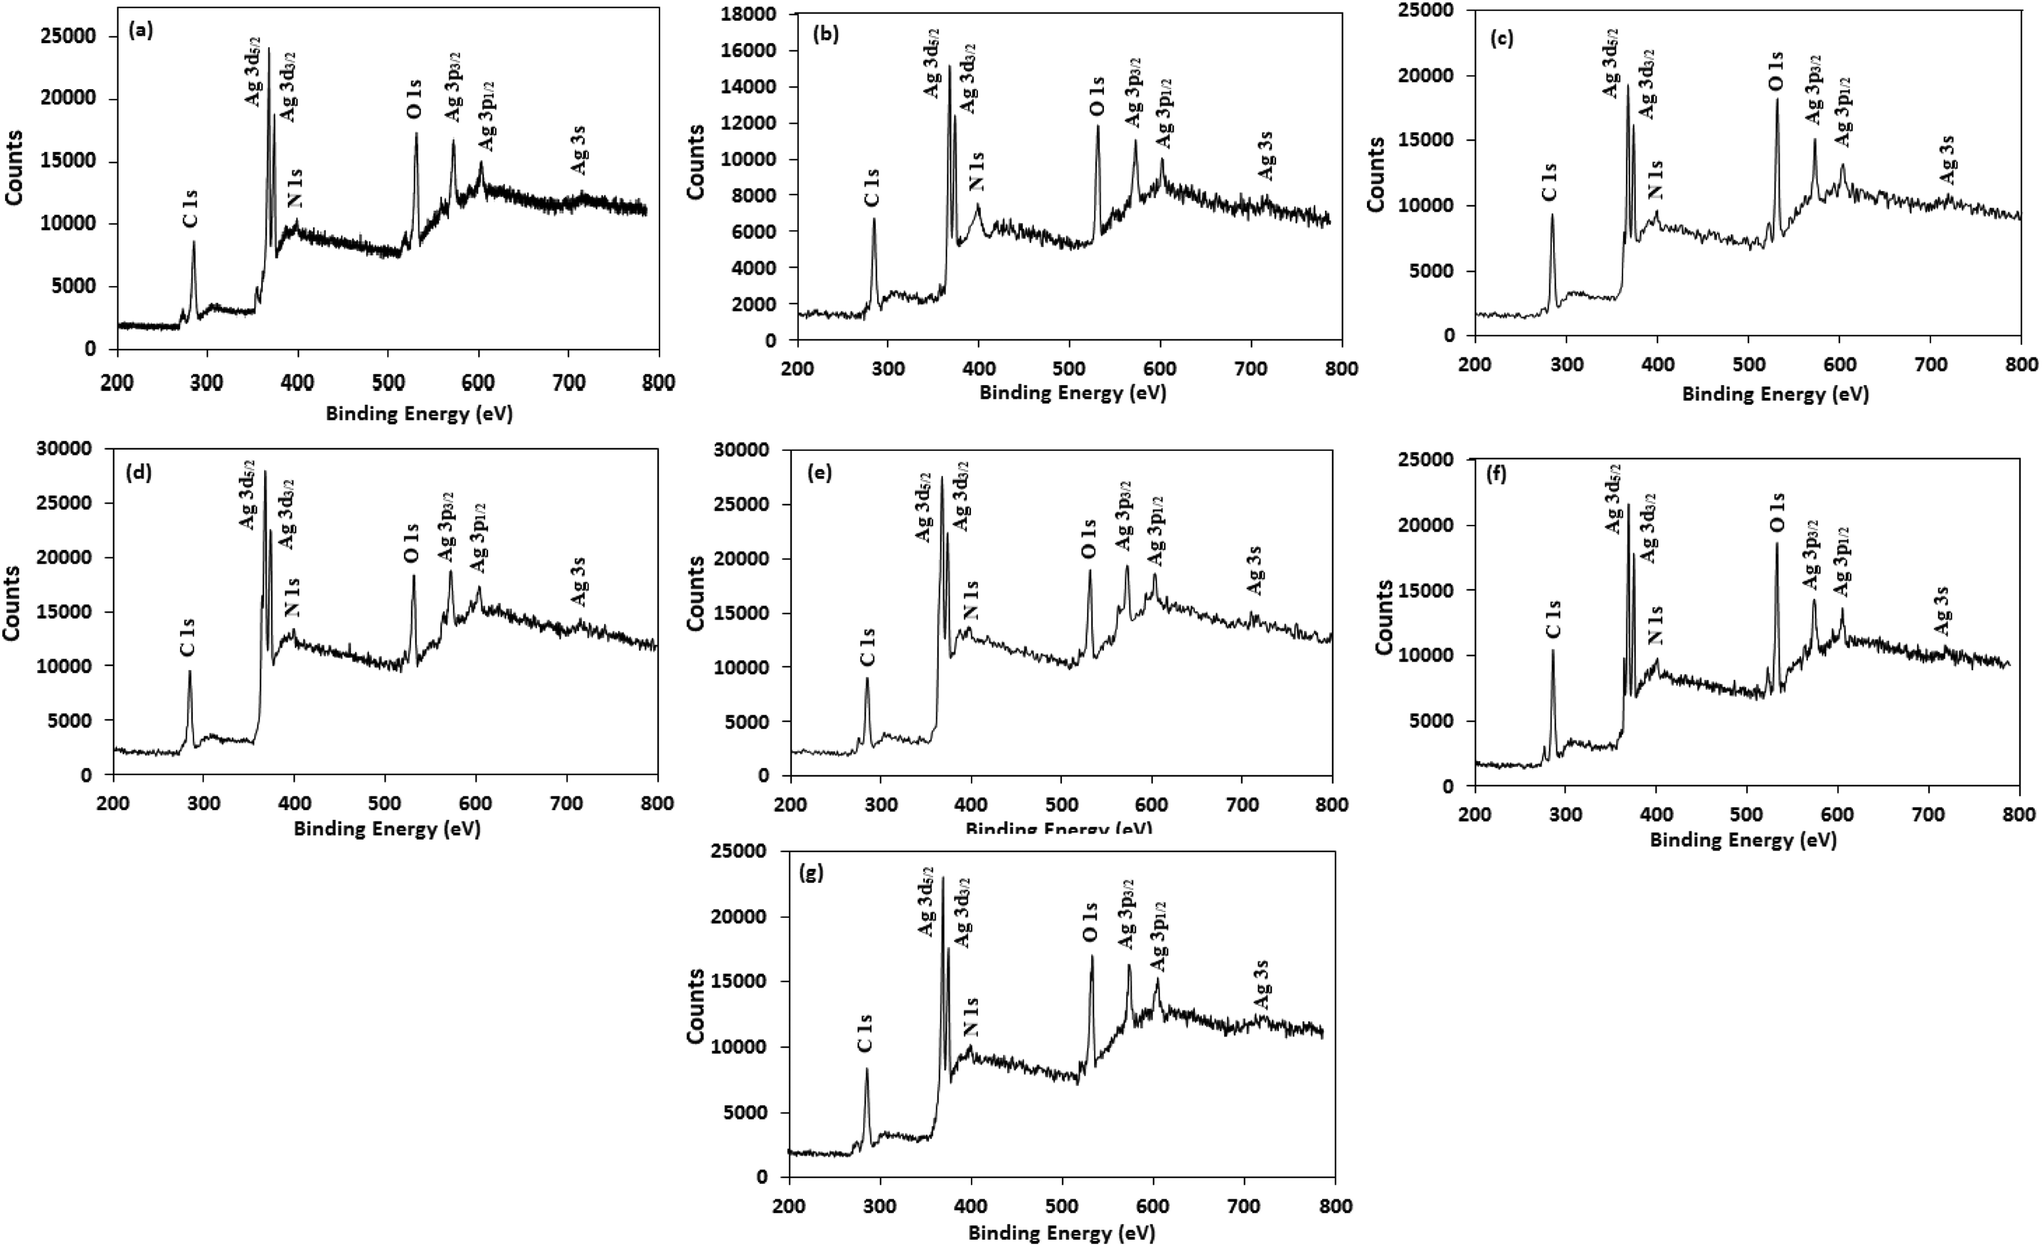 | ||
| Fig. 5 XPS spectral analysis of (a) AgNP (b) Ala-AgNP (c) Trp-AgNP (d) Met-AgNP (e) His-AgNP (f) Glu-AgNP and (g) Asp-AgNP showing full scans. | ||
Fig. S5† shows the deconvoluted O 1s spectrum of the AgNPs, and the corresponding binding energies are tabulated in Table S2.† The peak at ≈532.9 eV is assigned to the C–OH, C–O, and CO bonds available for silver ions to bind with,62 and is present only in the f-AgNPs spectra (Fig. S5†), implying their functionalization by amino acids, which are rich in these bonds. Functionalization is further supported by the presence of the peak at 532–533 eV in the f-AgNPs spectrum, which is attributed to the oxygen associated with the surface hydroxyl groups from the carboxylic groups of the amino acids,63 and is absent in the AgNP spectrum (Fig. S5†). The additional peaks observed in the deconvoluted O 1s spectrum of the AgNPs in the range 528–532 eV suggest the presence of O2− in Ag2O and Ag–O bond formation.64
Fig. S5† illustrates the deconvoluted C 1s spectrum of the AgNPs, and the corresponding binding energies are tabulated in Table S2.† The C 1s spectra were deconvoluted into two distinct peaks for AgNP, His-AgNP and Trp-AgNP, while into three distinct peaks for Ala-AgNP, Met-AgNP, Glu-AgNP and Asp-AgNP. In the C 1s spectrum, the peaks at ≈284.4 eV, ≈285, ≈286, ≈289, and ≈290 eV are attributed to CC, C–C, C–O/C–N, CO, and O–CO, respectively.65 The AgNP spectrum does not have peaks at ≈286 and ≈290 eV, whereas for the f-AgNPs, their spectra have at least one of their peaks at ≈286 or ≈290 eV. This further provides strong evidence for the f-AgNPs being functionalized by the amino acids, since they have the C–O/C–N and O–CO functional bonds.
Fig. S5† shows the deconvoluted N 1s spectrum of the AgNPs, and the corresponding binding energies are tabulated in Table S2.† The deconvoluted peak at ≈399.2 eV for f-AgNPs (except Ala-AgNP) is due to the C–N unit of the amino acids, signifying the interaction between these N atoms and the f-AgNPs.66 The peak at ≈398.4 eV in the AgNP and Ala-AgNP spectra suggest the presence of charged nitrogen atoms,67 implying an electrostatic interaction with the Ag0 surface. The peak at ≈402.4 eV for Trp-AgNP is attributed to N-oxide, while the peak at 400.1 eV for Met-AgNP is attributed to amide nitrogen.68 The deconvoluted N 1s spectrum of the AgNPs further revealed that the area under the curve of the deconvoluted peaks was highest for Asp-AgNP, and least for AgNP. Since AgNP is capped by proteins and polysaccharides, while the f-AgNPs are additionally functionalized with amino acids, the N content is therefore the least in AgNP. Furthermore, among the amino acids used in this study, only Asp contains two –NH2 groups, and therefore the N content was highest in Asp-AgNP.
To validate the percentage of Ag0 and Ag2O content in each of the AgNPs as obtained from the XPS analysis, UV-visible spectroscopic experiments were conducted. The basis of these experiments is that Ag2O (brown) dissolves in excess aqueous ammonia yielding a clear, transparent solution, represented by the following equation:
| Ag2O(s) + 4NH3 + H2O → 2[Ag(NH3)2]OH(aq) |
To a known volume of AgNPs aqueous dispersion (containing 1.68 mM Ag+ ions as estimated from ICP-OES), an excess amount of aqueous ammonia (25% w/v) was added and stirred at 750 rpm for 30 min in the dark. The AgNPs dispersion thus obtained only contained Ag0 in the dispersed phase, whereas all the Ag2O content of the AgNPs were converted to [Ag(NH3)3]OH (aq). The UV-visible absorbance spectra of the AgNPs dispersion before and after addition of ammonia were recorded. In all the experiments, the overall volume of the aqueous dispersion was kept constant. Since the absorbance of the AgNPs dispersion (Ag0 + Ag2O) at their respective λmax is proportional to the concentration (known from ICP-OES analysis), AgNPs having the highest Ag2O concentration suffer the highest decrease in the absorbance on addition of ammonia. Thus, the absorbance recorded for the AgNPs aqueous dispersion after the addition of ammonia is only due to Ag0 left in the AgNPs dispersion. The change in absorbance of the AgNPs dispersion before and after ammonia addition is proportional to the Ag2O concentration in the AgNPs dispersion. Fig. S6† shows the absorbance spectra of the AgNPs dispersion before and after the addition of ammonia. Fig. S6† elucidates that the λmax of the AgNPs undergoes a blue shift with decreased absorbance on addition of ammonia, implying decreased particle size due to the dissolution of Ag2O (s) crystallites into [Ag(NH3)3]OH (aq). The percentages of Ag0 and Ag2O content present in the AgNPs as obtained from the absorbance spectra are reported in Table S3,† which shows that Trp-AgNP, Met-AgNP and His-AgNP have >78%, while AgNP, Ala-AgNP and Asp-AgNP have <46% Ag0 content, in good agreement with the XPS results.
The observations from FTIR indicate the participation of functional groups in NG, not only in the formation of Ag/Ag2O crystallites, but also in retaining certain structure stabilizing groups, facilitated by amino acids. The binding of amino acids to the f-AgNPs surfaces was further confirmed using 1H NMR spectroscopy and is explained in the ESI (Fig. S7–S14†).
3.3. Mechanism of AgNPs formation
HR-TEM, XRD, FTIR and 1H NMR analyses provided adequate information on the AgNPs formation mechanism. The hydroxyl and carboxylic groups in NG first facilitated the complexation of Ag+ ions. Consequently, these Ag+ ions oxidized the hydroxyl groups to carbonyl groups and were reduced to Ag(0). The dissolved oxygen also favored the oxidation of hydroxyl groups to aldehydes and carboxylates, which in turn reduced more Ag+ ions to Ag(0). To begin with, the Ag+ ions were trapped on the surfaces of proteins and polysaccharides present in the NG through electrostatic interactions. The reducing agents present in NG such as flavonoids, reducing sugars, and tannin then reduced the Ag+ ions (Scheme 1), resulting in the nucleation of silver. The oxidation products of these reducing agents were mainly acidic, confirmed by the decreased pH of the reaction mixture after AgNPs synthesis (see Scheme 1).69,70 In the absence of amino acids, the nucleation occurred over a longer period, resulting in uncontrolled growth of the AgNP, confirmed by HRTEM (Fig. 2). With amino acids, Ag+ ions form di-coordinate (Ala) and tri-coordinate (Trp/Met/His/Glu/Asp) complexes. Shoeib et al. optimized the structure of these complexes and found the affinity of Ag+ ions for the amino acids was of the order His > Met ≥ Trp > Asp > Glu > Ala.42 The optimized structure of amino acid–Ag+ complexes and Ag+ ion affinity are illustrated in Scheme 2. The strong affinity of Ag+ ions for amino acids is the foundation for the ordered nucleation of Ag, resulting in the controlled growth of the f-AgNPs, confirmed by HRTEM (Fig. 2). The absence of amino acid functionalization in AgNP and the lower affinity of Ag+ for Ala, Glu and Asp could have resulted in the increased oxidation probability of Ag nuclei undergoing Ostwald ripening, resulting in high concentrations of large sized Ag2O crystallites in AgNP, Ala-AgNP, Glu-AgNP, and Asp-AgNP. The strong affinity of the Ag+ ion for Trp, Met, and His resulted in the decreased oxidation probability, with low Ag2O crystallite concentration in Trp-AgNP, Met-AgNP, and His-AgNP, which was indicated by XRD results (Fig. S3†). Furthermore, the chances of Trp being involved in Ag+–π interactions additionally create a compact and ordered atomic arrangement of Ag nuclei undergoing nucleation, resulting in the smallest size Trp-AgNP with the highest Ag (111) and Ag (200) crystallite concentrations (see Scheme 2, and Fig. S2†). Likewise, Ag+ ions having the strongest affinity for His resulted in smaller sized NPs with high Ag (111) and Ag (200) crystallite concentrations (see Scheme 2, and Fig. S2†). Among the f-AgNPs, the weakest Ag+ ion affinity for Ala resulted in the highest Ag2O crystallite concentration in Ala-AgNP, and in the formation of Ag (200) crystallites, which is absent in AgNP.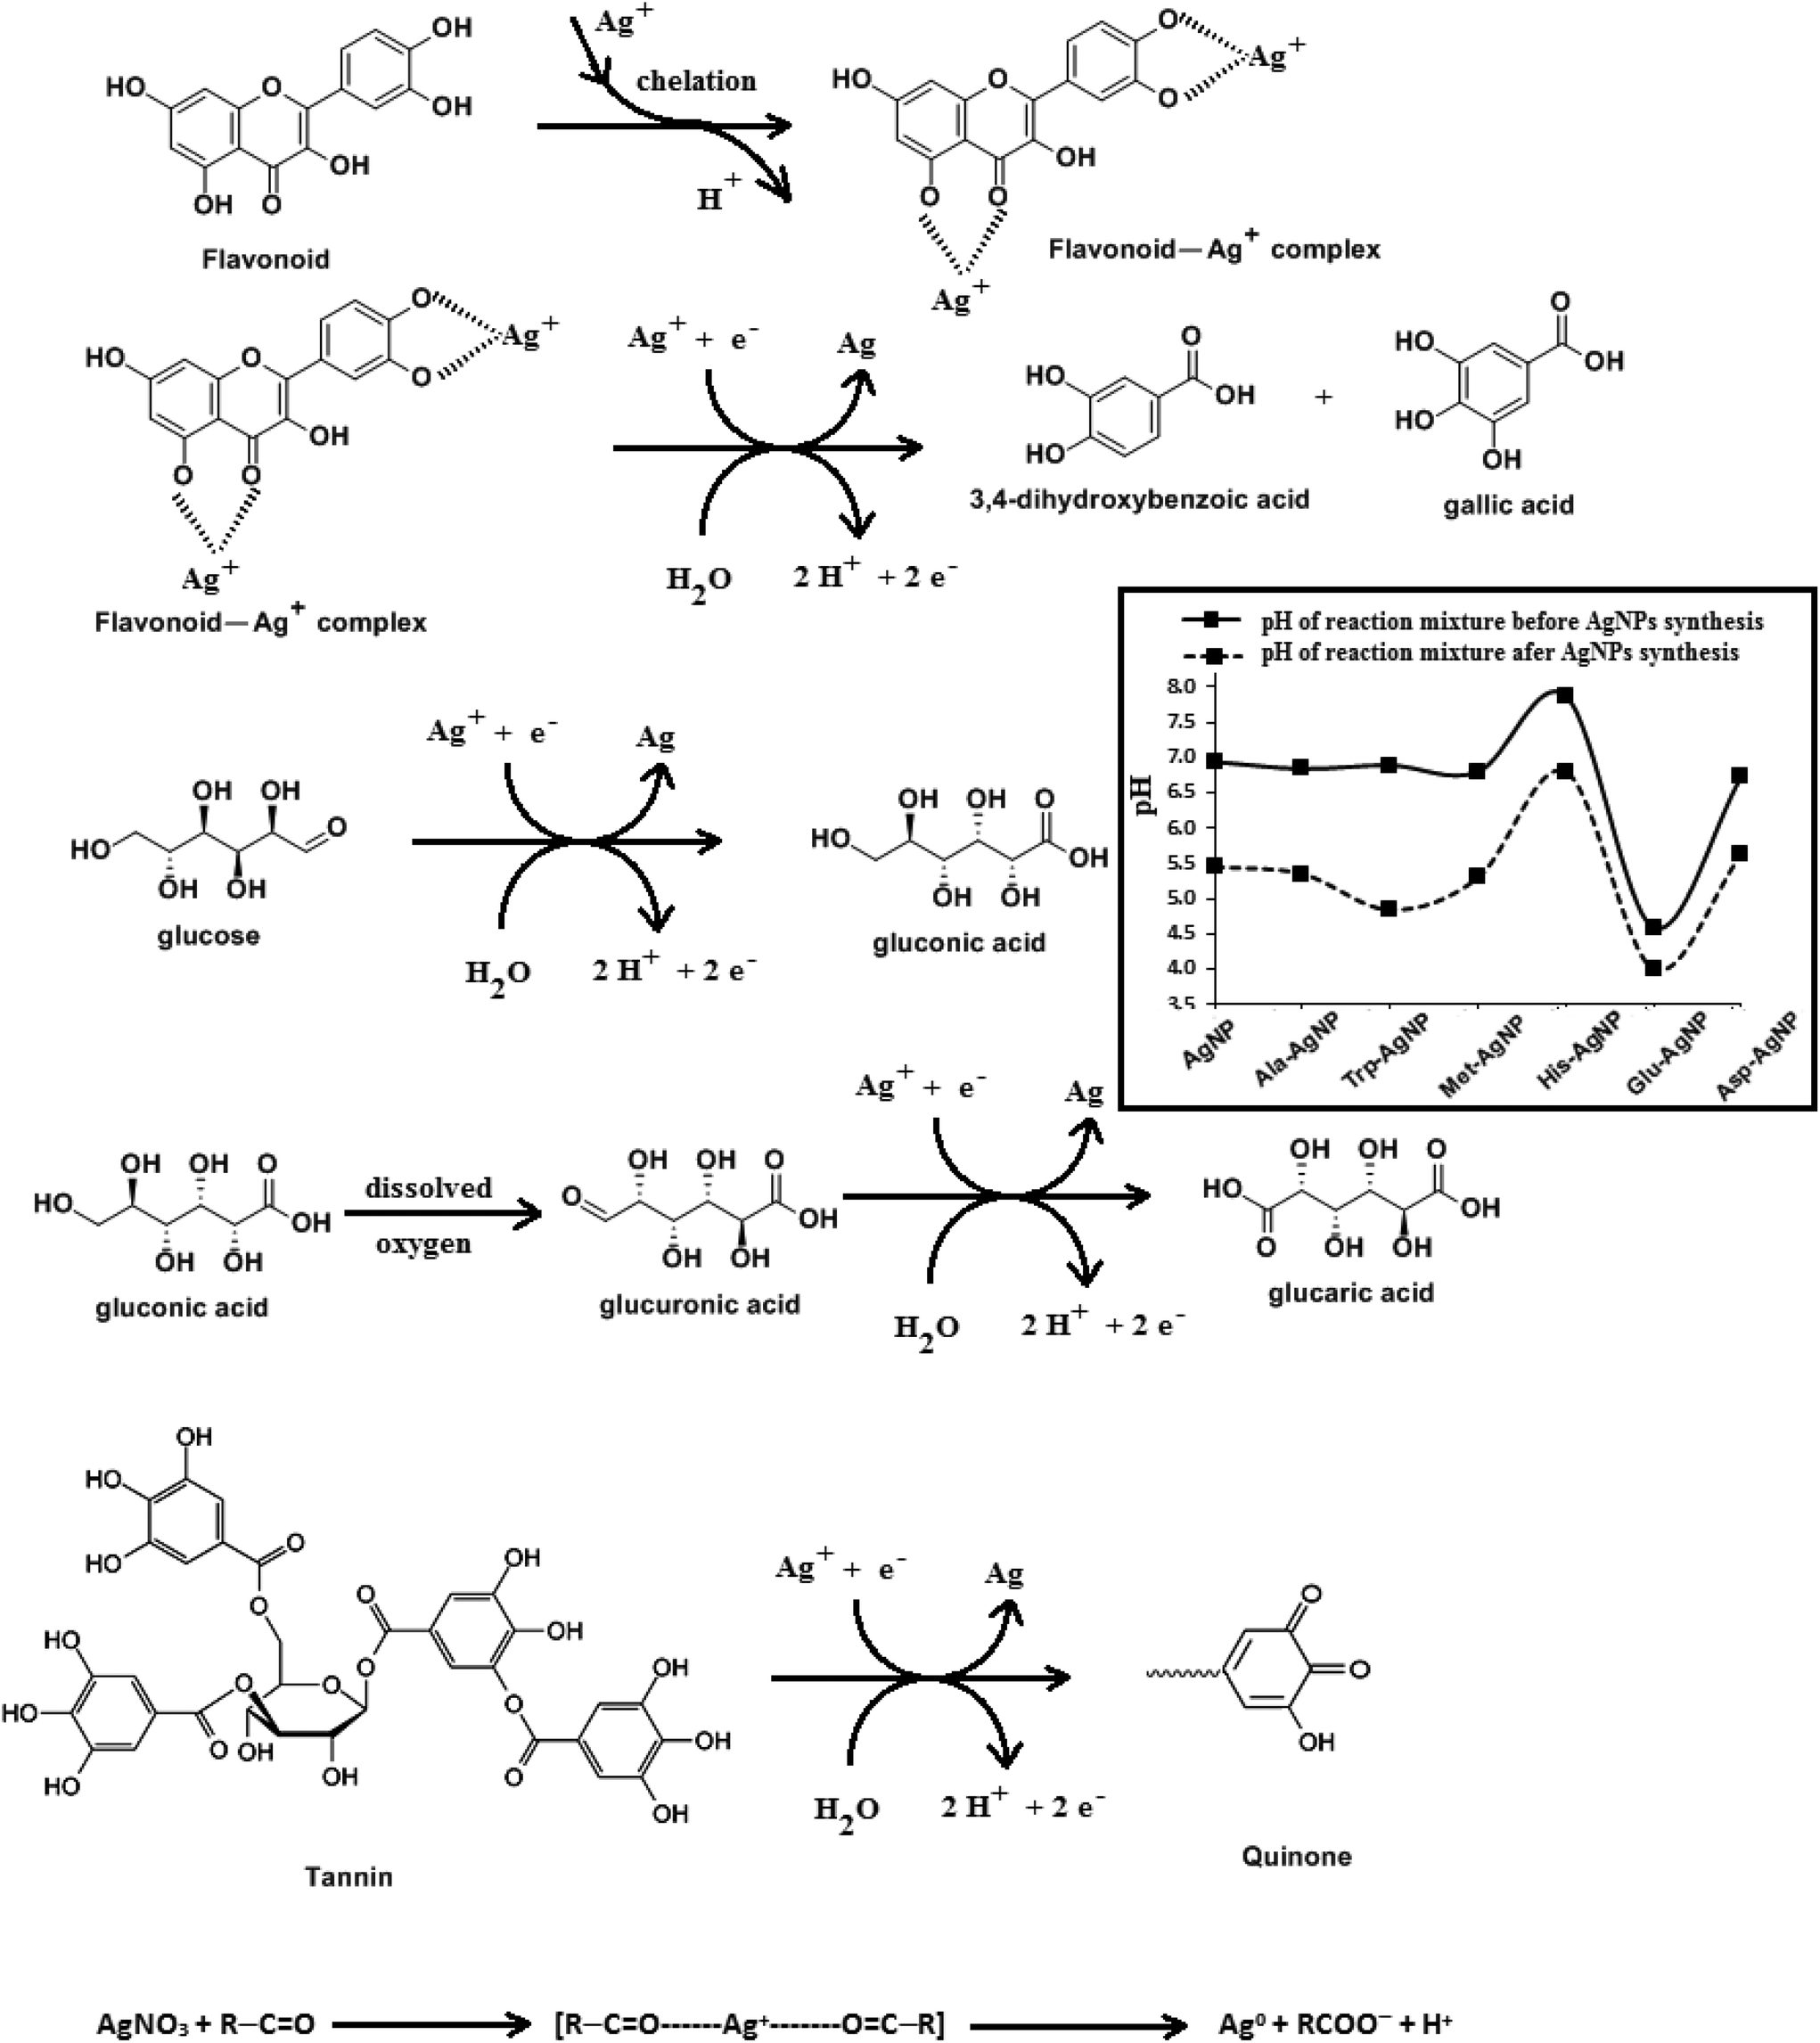 | ||
| Scheme 1 The proposed mechanisms for the chelation and reduction of silver ions by flavonoid, glucose, gluconic acid and tannin, during the AgNPs biosynthesis with NG. Inset: The pH of the reaction mixture before and after the biosynthesis of AgNPs. | ||
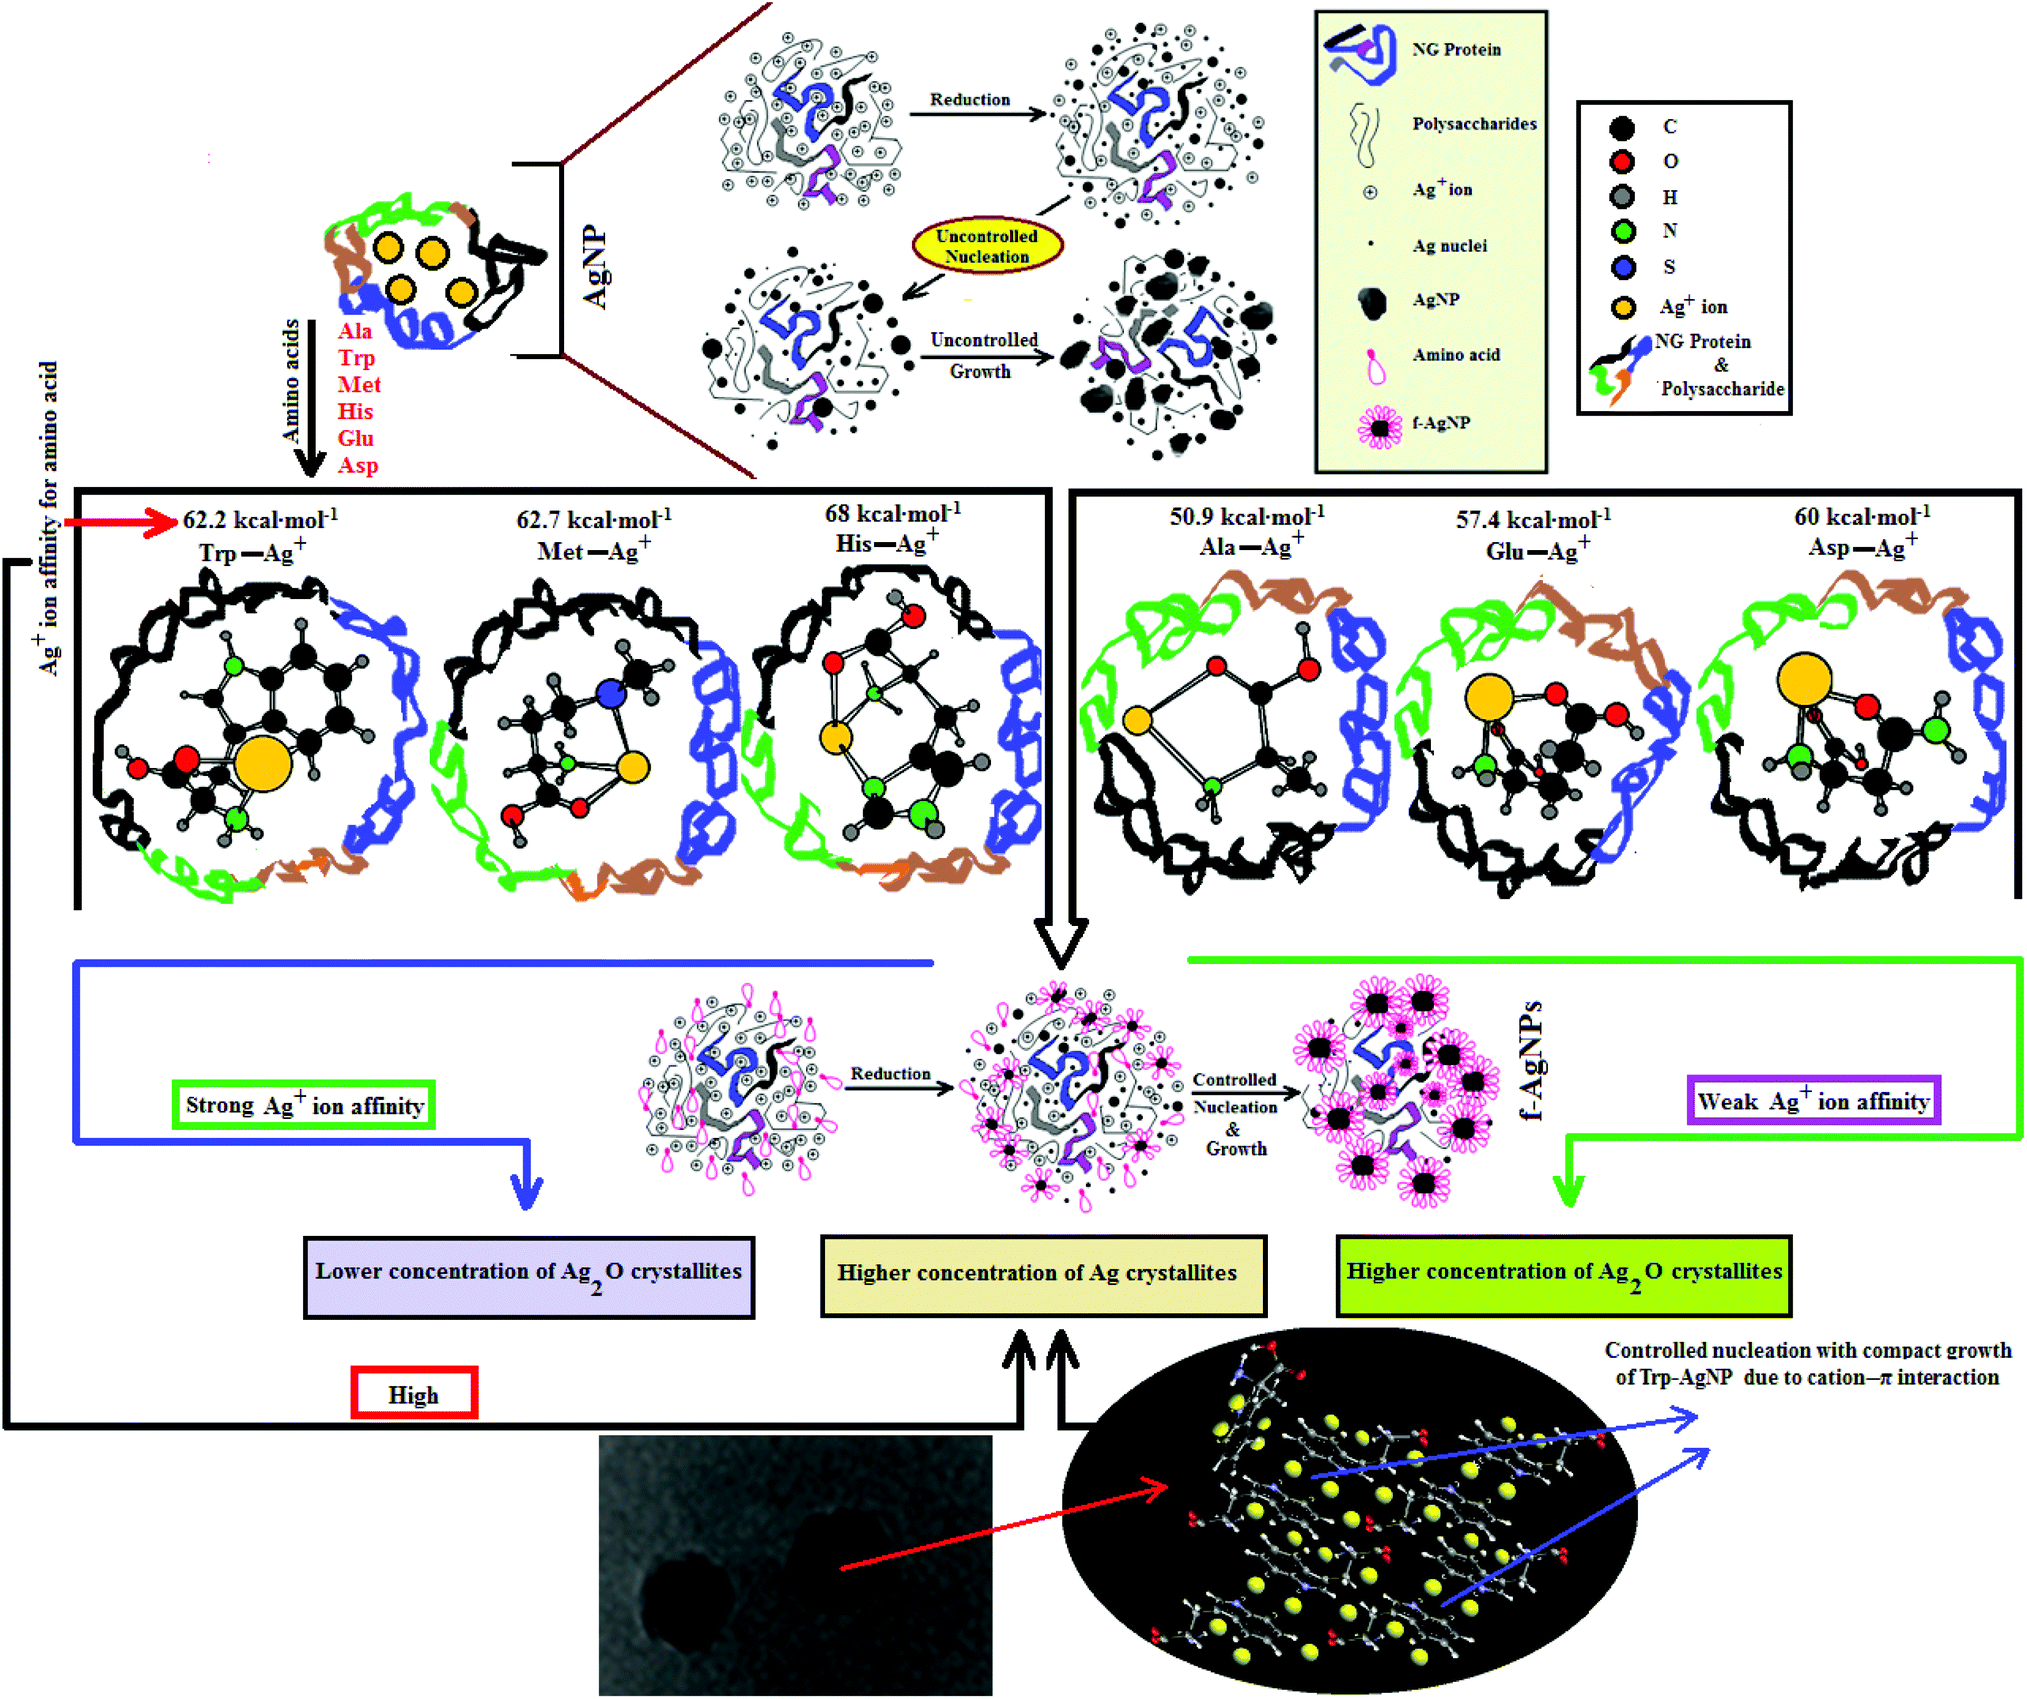 | ||
| Scheme 2 Schematic representation of the formation of AgNP and f-AgNPs using NG, optimized structures of amino acid–Ag+ complexes with NG, binding affinity of Ag+ ions with amino acids and their co-relation to crystallite planes observed from XRD analysis of the AgNPs. | ||
3.4. Influence of pH, ionic strength, surfactants, and dyes on AgNPs colloidal stability
FTIR and 1H NMR studies indicated that the amino acid supplemented NG matrices at the f-AgNPs surfaces may significantly contribute to their colloidal stability in different environments. Since the catalytic activity, bioavailability, and toxicity of NPs depend on their colloidal stability, it is therefore critical to study their stability in different aqueous environments. The stability of AgNPs was therefore investigated in different aqueous environments of variable pH, ionic strength, surfactants and dyes, using UV-visible absorbance spectroscopy. The spectra were analyzed for SPR peak shifting, SPR band broadening, and decrease in the absorption intensity.Fig. S15† shows the spectra of aqueous AgNPs at pH 2 to 14. The SPR band of the AgNPs does not change in the pH 2–10 range, illustrating their good colloidal stability. Fig. S15† reveals that for Trp-AgNP, its SPR peak absorbance at pH 5 increases and for His-AgNP, it decreases at pH 2. Since the isoelectric point of His is 7.47, it seems that at pH 2, the –COO− group of His at the His-AgNP surface is protonated, with a consequent reduction in electrostatic repulsion. The formation of intermolecular H-bonding between the protonated –COO− groups of surface-bound His molecules could also contribute to aggregation. The observed SPR band broadening of AgNP and Ala-AgNP at pH > 10, and of Glu-AgNP and Asp-AgNP at pH > 11, may be due to increased particle aggregation.71 For the AgNPs except Trp-AgNP, a characteristic hyperchromic effect observed at pH 14 illustrates the deprotonation of the surface-bound –COOH group by OH− ions, with increased repulsive electrostatic double-layer forces and stabilization.72
The colloidal stability of the AgNPs was further investigated by increasing the ionic strength from 0.1 M to 2 M NaCl. Fig. S16† illustrates the spectra of f-AgNPs at pH 7.0 with increasing ionic strength. Except for Met-AgNP, a blue shift in the respective SPR peaks was observed at 0.1 M NaCl. For AgNP and Ala-AgNP, the SPR peaks shifted by 10 nm, while for Trp-AgNP, His-AgNP, Glu-AgNP and Asp-AgNP, they shifted by 5 nm. A further blue shift by 5 nm was observed for Trp-AgNP at 1.5 M NaCl, and by 15 nm for Asp-AgNP at >0.4 M NaCl. The decreased agglomeration with increasing ionic strength may explain these blue shifts. The salt-induced decreased agglomeration arose as a result of the increased electrostatic repulsion between the negatively charged nanoconjugates. Electrostatic repulsion was initiated by the electrical double layer formation, and for the AgNPs (except Met-AgNP), the Cl− ions could have diffused into their electrical double layer with increased electrostatic repulsion. At 0.1 M NaCl, AgNP and Ala-AgNP nanoconjugates exhibited the strongest electrostatic repulsion, depicted by the 10 nm blue shift. For Trp-AgNP and Asp-AgNP, further diffusion of Cl− ions occurred at 1.5 M NaCl and >0.4 M NaCl, respectively. Asp-AgNP nanoconjugates with an overall 15 nm blue shift indicated the strongest electrostatic repulsion with highest Cl− ion concentration in their electrical double layer. For AgNP, Ala-AgNP, Glu-AgNP, and Asp-AgNP, the hyperchromic effect observed at [NaCl] < 1 M was due to their increased dispersibility, while the hypochromic effect observed at [NaCl] > 1 M indicated the formation of aggregates due to their surface charge neutralization by increasing the Na+ ion population. For Met-AgNP, with up to 2 M NaCl, the observed hypochromic effect with no SPR peak shifting indicates that the negatively charged Met-AgNP electrical double layer was neutralized with increasing electrolyte concentration, with Cl− ions having the least tendency toward diffusion. No considerable change in the absorbance of Trp-AgNP and His-AgNP dispersions with increasing ionic strength confirmed their high colloidal stability even at high ionic strength.
The AgNPs colloidal stability was further explored with cationic, anionic and nonionic surfactants. Fig. S17† illustrate the UV-visible spectra of AgNPs with (0.0025 to 0.010) M aqueous surfactants. With increasing cationic surfactant (DTAB) concentration, significant changes in the AgNPs absorption maxima and peak broadening were observed. This could be due to the surface charge neutralization by the cationic quaternary nitrogen of DTAB, leading to aggregation with decreased colloidal stability. In aqueous nonionic surfactant (OGP), the SPR peak of the AgNPs showed no major peak broadening, as compared to water, which may be due to the absence of electrostatic interactions prevailing between the AgNPs surface and the glucose head of OGP. Similarly, in aqueous anionic surfactants (SDS), the AgNPs illustrated good colloidal stability, demonstrated by no major peak broadening. The existence of repulsive Coulombic forces between the negatively charged AgNPs surface and the anionic sulfate head may have resulted in their good colloidal stability. Fig. S17† thus elucidates the good colloidal stability of Ala-AgNP in OGP, Trp-AgNP in OGP and SDS, Met-AgNP in OGP, His-AgNP in OGP and SDS, Glu-AgNP in OGP, and Asp-AgNP in OGP. Fig. S17† (inset) illustrates the stability of AgNPs in aqueous surfactants, in terms of dispersion transparency. With DTAB, the AgNPs dispersions were turbid, but were transparent with SDS and OGP. With increasing alkyl chain length and concentration of the cationic surfactant, the turbidity of AgNPs dispersions increased, indicating the formation of larger aggregates with decreased colloidal stability (image not reported).
The AgNPs colloidal stability was further investigated in aqueous cationic and anionic dyes. The UV-visible spectrum of each dye at 10 to 50 μM concentration, and aqueous AgNPs, were taken separately. The two curves were combined mathematically, giving the absorption spectra that would be expected if the AgNPs and dyes showed no interaction with each other. This combined spectrum was compared with the absorption observed for the AgNPs with dyes. The comparison is shown in Fig. S18.† The observed spectra of Trp-AgNP, His-AgNP, Glu-AgNP, and Asp-AgNP were similar to the mathematically combined absorption spectrum of solutions, illustrating their high stability in cationic dye (MB). Furthermore, AgNP, Ala-AgNP, Trp-AgNP, Glu-AgNP, and Asp-AgNP were found to have good stability in anionic dye (CR). Possibly, the dyes interact with the surface of the AgNPs via the –NH2, –COO− and –OH groups; these groups may be engaged in H-bonding with the –COO− and –NH2 groups present over the AgNPs surface. There is an additional possibility for electrostatic interactions between the –COO− group present at the AgNPs surface and the delocalized positive charge present over the aromatic rings in MB.73,74 These factors may have resulted in bringing the AgNPs in the close vicinity of each other, leading to their agglomeration. This could have led to enhanced retention of incident light by the larger agglomerates, with increased absorbance. The extreme stability of Trp-AgNP with dyes may be due to the extreme hydrophobic surface provided by the polymerization of Trp as predicted by 1H NMR (Fig. S10†), thereby restricting the formation of hydrogen bonds.
3.5. Catalytic activity of AgNPs on methylene blue (MB) reduction
MB has the basic dye skeleton of the thiazine group, and in aqueous medium has an absorption maximum at 665 nm (due to n–π* transition).75,76Fig. 6 illustrates the catalytic activity of AgNPs on MB reduction by acidic SnCl2 in aqueous and AOT/SDS/DTAB micellar media. Fig. 6 indicates that MB reduction progressed without AgNPs, but with a very slow rate. In aqueous and AOT/SDS/DTAB micellar media and in the presence of 30 μM AgNPs, the blue color of the MB solution changed to green, and was finally bleaches to a colorless solution (except with Trp-AgNP and His-AgNP), and the MB absorption maximum at 665 nm diminished, indicating the reduction of MB to its reduced form Leuco MB (LMB). This confirmed the substantial catalytic activity of the AgNPs on MB reduction in these media. With Trp-AgNP and His-AgNP, the green colored solution turned yellowish after complete MB reduction, depicting their good stability in these reaction media. It is clear from Fig. 6 that the reduction of MB proceeded almost instantaneously, with more than 84% of MB reduced within the first 1 min in AOT and SDS micellar media. Comparatively, the MB reduction was slower in DTAB micellar and aqueous media, with more than 63% and 57% of MB reduced, respectively, within the first 1 min. With the AgNPs, almost complete reduction of MB was achieved within 4 min in micellar AOT and SDS, 5 min in micellar DTAB and 7 min in aqueous mediums. Trp-AgNP exhibited the highest catalytic activity, with almost 100% MB being reduced within 40 s in AOT/SDS/DTAB micellar mediums.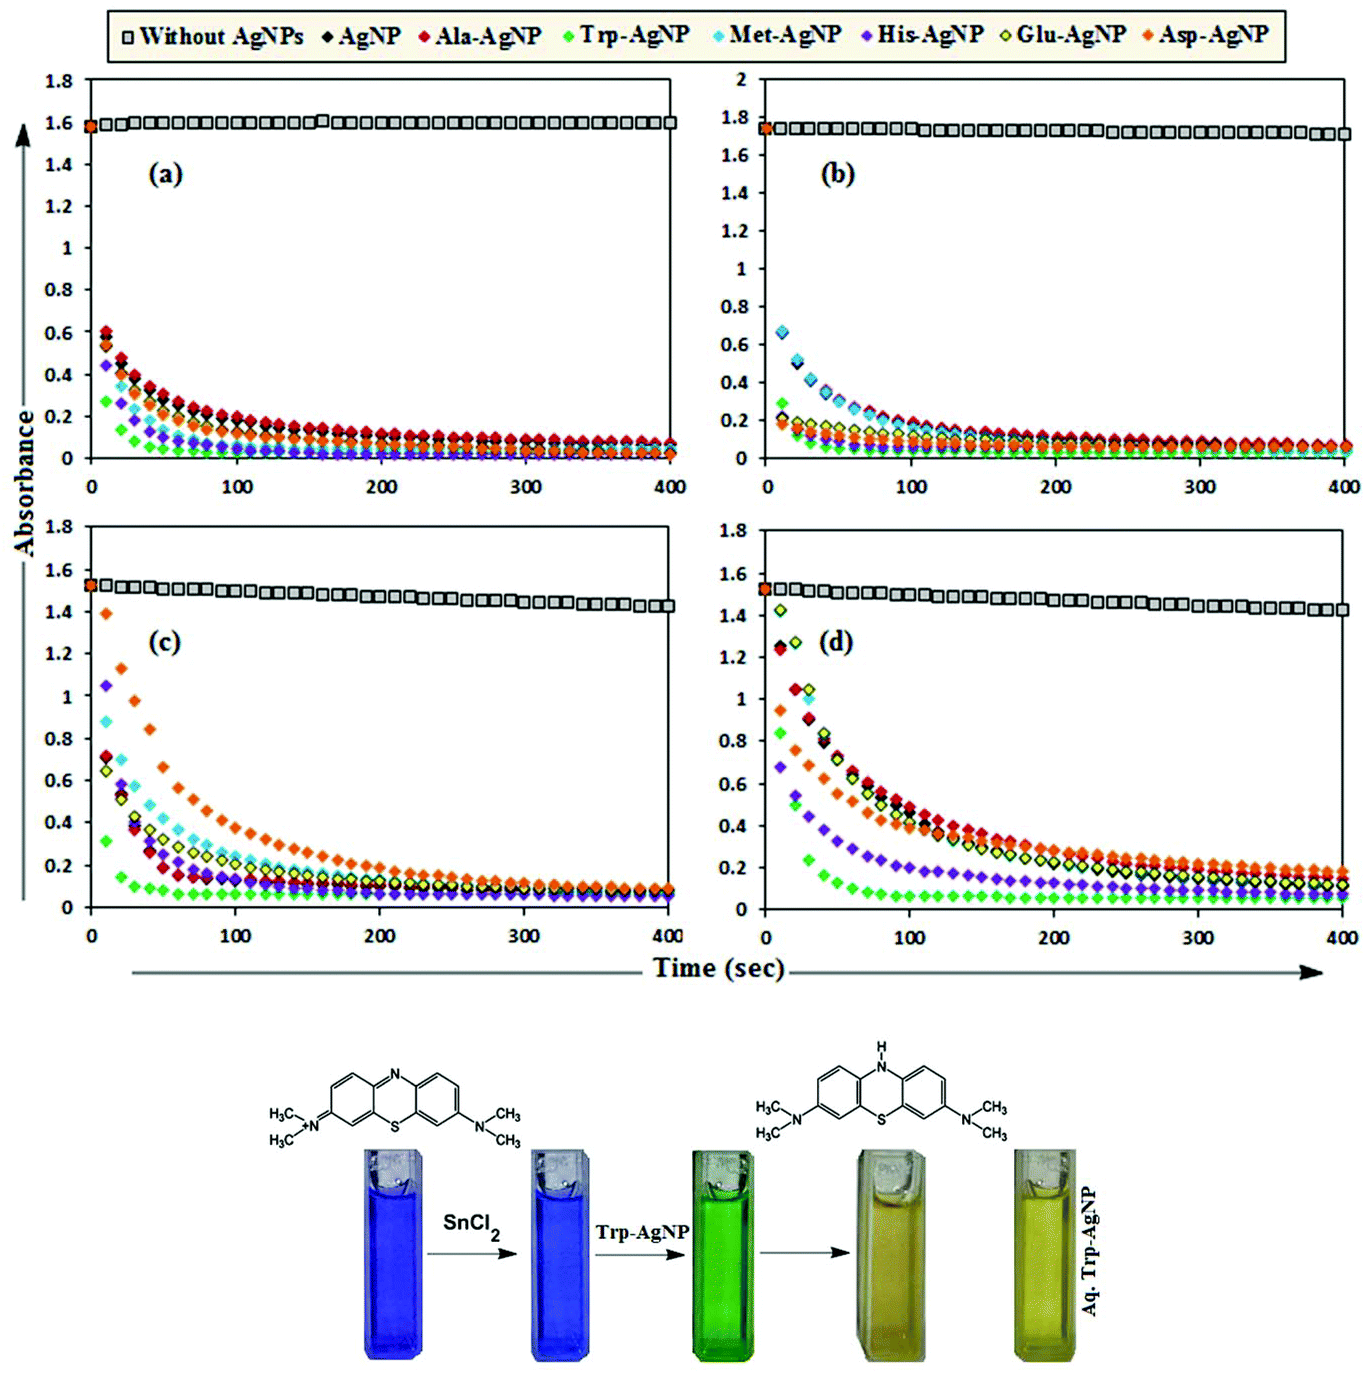 | ||
| Fig. 6 Plot of the absorbance at λmax (665 nm) of MB versus time with AgNPs in (a) in 0.01 M aqueous AOT, (b) in 0.01 M aqueous SDS, (c) in 0.01 M aqueous DTAB, (d) in aqueous medium. | ||
In T-20 micellar medium and in the absence of AgNPs, the intensity of the MB absorption maximum at 665 nm slowly increased with time (Fig. 7), indicating the incapability of acidic SnCl2 to reduce MB. Fig. 7 shows the effect of AgNPs at different doses on the MB reduction by acidic SnCl2. With AgNPs (except Trp-AgNP and His-AgNP), the MB reduction was accelerated, but became reversible (i.e. re-appearance of blue color due to oxidation of LMB to MB) after 2–3 min at all AgNPs doses. Fig. S19† illustrates the extent of MB reduction in T-20 micellar medium after 3 min in the presence of different AgNPs doses. After 3 min and at 30 μM AgNPs concentration, ≈65% MB was reduced in the presence of AgNP and Ala-AgNP, while 82, 87 and 80% MB was reduced in presence of Met-AgNP, Glu-AgNP and Asp-AgNP, respectively. With Trp-AgNP, a complete reduction was observed, while with His-AgNP, 92% reduction was observed. The transition between blue and colorless solution and then from colorless to blue solution is a well-known redox cycle called the MB clock reaction. To check whether MB reduction was reversible in the presence of AgNPs in aqueous and AOT/SDS/DTAB micellar mediums, the MB reduction by acidic SnCl2 was carried out with 20 μM AgNPs as the catalyst and the progress of the reduction reaction is illustrated in Fig. S20.† No backward oxidation of LMB to MB was thus observed, depicted by decreased absorbance at 665 nm, and indicating the irreversible MB reduction in these reaction mediums. Fig. 8a illustrates the snapshots of MB + acidic SnCl2 in different mediums, taken after 2 h of AgNPs addition. It strongly supports the fact that, except in micellar T-20, no backward oxidation of LMB occurred in aqueous and AOT/SDS/DTAB micellar mediums, indicating the good stability of LMB, which is otherwise unstable in aerated conditions. Furthermore, on shaking these reaction mixtures, the solutions remained bleached. In all the MB solutions, the AgNPs yellowish color diminished except for Trp-AgNP and His-AgNP, thus exhibiting their good stability in such reaction mediums. There are only a few reports of a reversible reaction involving MB in the acidic range.48,50 This work reports the first ever demonstration of the MB clock reaction in acidic pH in the presence silver NPs and in nonionic micellar medium. Since among the AgNPs, in the presence of which the MB clock reaction was observed, Glu-AgNP exhibited the highest MB reducing ability, it was chosen to represent the MB clock reaction, as shown in Fig. 8b.
 | ||
| Fig. 7 Plot of absorbance at λmax (665 nm) of MB vs. time with variable amounts of AgNPs: (a) AgNP (b) Ala-AgNP (c) Trp-AgNP (d) Met-AgNP (e) His-AgNP (f) Glu-AgNP (g) Asp-AgNP in 0.01 M aqueous T-20. | ||
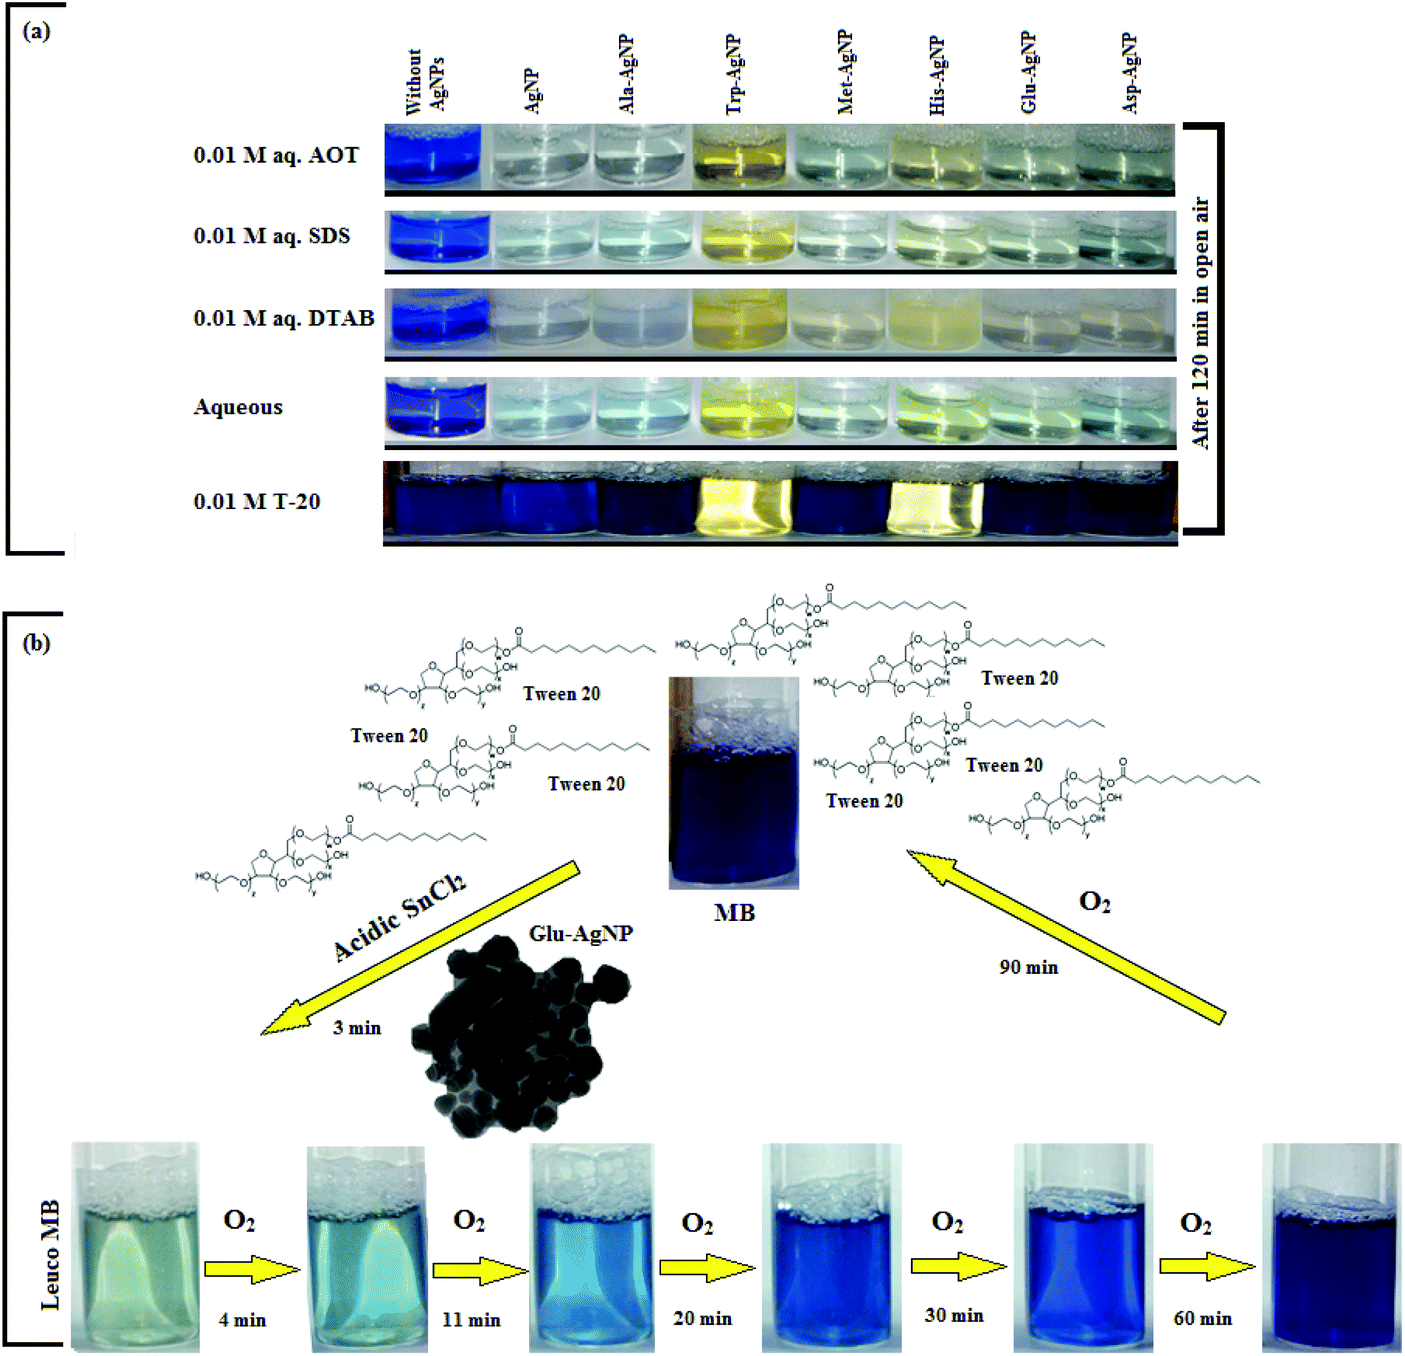 | ||
| Fig. 8 (a) Snapshots of MB + acidic SnCl2 in aqueous and AOT/SDS/DTAB/T-20 micellar media, taken after 2 h of 30 μM AgNPs addition. (b) Schematic representation of the MB clock reaction involving MB, acidic SnCl2 and 30 μM Glu-AgNP in T-20 micellar medium. | ||
An interesting finding for this MB clock reaction is that the reversible color alteration goes on for one cycle, irrespective of the catalyst concentration; it usually continues for several cycles, as reported in earlier studies.49,77 This phenomenon indicates the instability of the AgNPs: AgNP, Ala-AgNP, Met-AgNP, Glu-AgNP and Asp-AgNP as catalysts in the reaction medium, as earlier depicted through their diminished yellowish color. This may be due to their degradation resulting from exposure to a range of chemical species generated during the reduction reaction. Such an important phenomenon illustrating one redox cycle may find application in oxygen sensing. An example of this is illustrated in Fig. 9, where two Whatman filter papers were dipped into a 3 min old decolorized formulation of MB/SnCl2/T-20/Glu-AgNP (30 μM). The Whatman filter paper kept inside a vacuum-sealed plastic package remained bleached, while the one kept in open air regained its blue color within 90 min, confirming aerial oxidation.
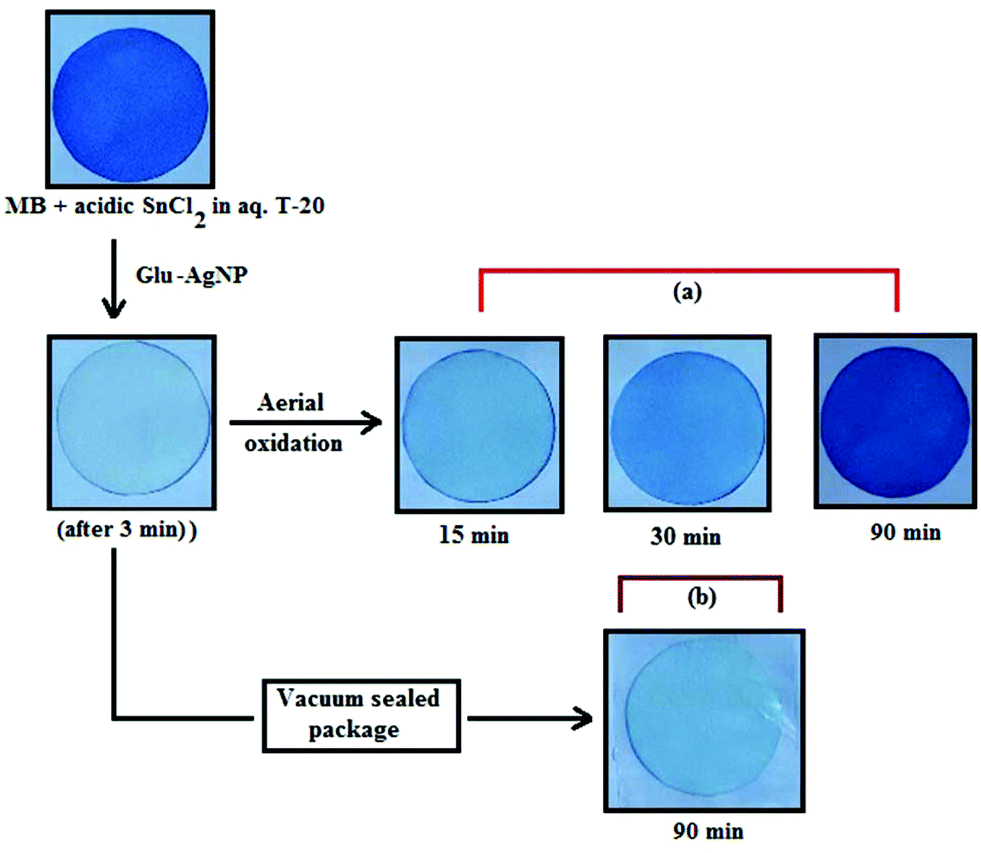 | ||
| Fig. 9 Photographs of Whatman filter paper dipped in a formulation of MB/SnCl2/T-20/Glu-AgNP (30 μM) (a) placed in open air, (b) inside a vacuum-sealed airtight plastic package. | ||
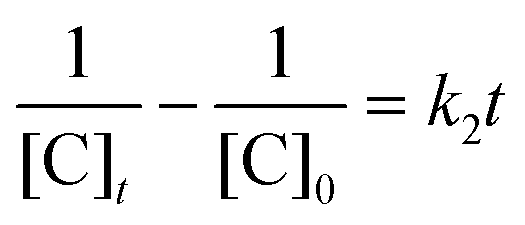
The AgNPs catalyzed MB reduction in aqueous and SDS/DTAB/AOT micellar media followed a linear relationship observed for pseudo-second order kinetics (Fig. 10), expressed by the following equation:
 | ||
| Fig. 10 The plot of [(1/Ct) − (1/C0)] versus time for the reduction of MB by acidic SnCl2 (a) in 0.01 M aqueous AOT, (b) in 0.01 M aqueous SDS, (c) in 0.01 M aqueous DTAB, (d) aqueous (e) in 0.01 M aqueous T-20; catalyzed by AgNPs: AgNP, Ala-AgNP, Trp-AgNP, Met-AgNP, His-AgNP, Glu-AgNP, and Asp-AgNP. | ||
| AgNPs | k 2 (AOT) | k 2 (SDS) | k 2 (DTAB) | k 2 (T-20) | k 2 (Aqueous) |
|---|---|---|---|---|---|
| AgNP | 1.90 | 1.78 | 1.53 | — | 1.34 |
| Ala-AgNP | 1.60 | 1.57 | 1.27 | — | 0.91 |
| Trp-AgNP | 28.10 | 23.98 | 14.53 | 12.26 | 11.20 |
| Met-AgNP | 9.05 | 2.83 | 1.66 | — | 1.21 |
| His-AgNP | 12.03 | 8.30 | 4.38 | 1.93 | 1.56 |
| Glu-AgNP | 3.41 | 1.90 | 1.56 | — | 1.19 |
| Asp-AgNP | 3.56 | 3.08 | 1.77 | — | 0.49 |
To date, there has been no study on the kinetics of the backward oxidation of LMB to MB because in the earlier studies, at the time of recording the backward reaction, the simultaneous onset of the forward reaction created a problem. Fig. 7 shows that in T-20 micellar medium, from 3 minutes onwards, the backward oxidation of LMB in the presence of AgNPs (except Trp-AgNP and His-AgNP) followed a typical pattern, wherein the absorbance at 665 nm increased linearly with time. The observation thus elucidates that the AgNPs must have played a crucial role in the backward oxidation of LMB to MB. For the backward oxidation of LMB to MB in the presence of these AgNPs (20–30 μM), the plot of MB concentration vs. time shows a straight line with a positive slope (Fig. 11), indicating a zeroth-order reaction pathway, with the kinetics expressed by the following equation:
| [C]t = [C]0 + k0t |
 | ||
| Fig. 11 The plot of MB concentration versus time for the backward oxidation of LMB to MB in AOT micellar medium; catalyzed by 30 μM AgNPs: AgNP, Ala-AgNP, Met-AgNP, Glu-AgNP, and Asp-AgNP. | ||
| AgNPs | 20 μM | 25 μM | 30 μM |
|---|---|---|---|
| AgNP | 2.7 | 2.8 | 3.0 |
| Ala-AgNP | 6.1 | 5.8 | 5.7 |
| Met-AgNP | 4.7 | 4.8 | 5.0 |
| Glu-AgNP | 5.3 | 4.9 | 5.0 |
| Asp-AgNP | 4.0 | 3.8 | 3.7 |
Fig. S21† presents the absorbance spectra of the reaction mixture containing MB and acidic SnCl2 in AOT and T-20 micellar media, recorded 20 min after the addition of Trp-AgNP and Glu-AgNP. The spectra observed with Trp-AgNP also represents that of His-AgNP, while the spectra observed with Glu-AgNP also represents that of AgNP, Ala-AgNP, Met-AgNP and Asp-AgNP because of the similarity of Ag and Ag2O crystallite concentration. Fig. S21† elucidates that in AOT and T-20 micellar media, the SPR peak of Trp-AgNP suffers a blue shift with decreased absorbance in the presence of MB and acidic SnCl2, compared to its SPR peak in acidic SnCl2. In AOT and T-20 micellar mediums, the SPR peak of Glu-AgNP disappears in the presence of MB and acidic SnCl2, compared to its SPR peak in acidic SnCl2. Furthermore, in AOT and T-20 micellar mediums with Trp-AgNP, no peak was observed at 665 nm, which strongly indicates the complete reduction of MB to LMB with enhanced LMB stability. In AOT micellar medium with Glu-AgNP, the absence of the peak at 665 nm signals the complete reduction of MB to LMB with enhanced LMB stability, while in T-20 micellar medium and with Glu-AgNP, the peak at 665 nm re-appears, indicating backward oxidation of LMB to MB.
 | (1) |
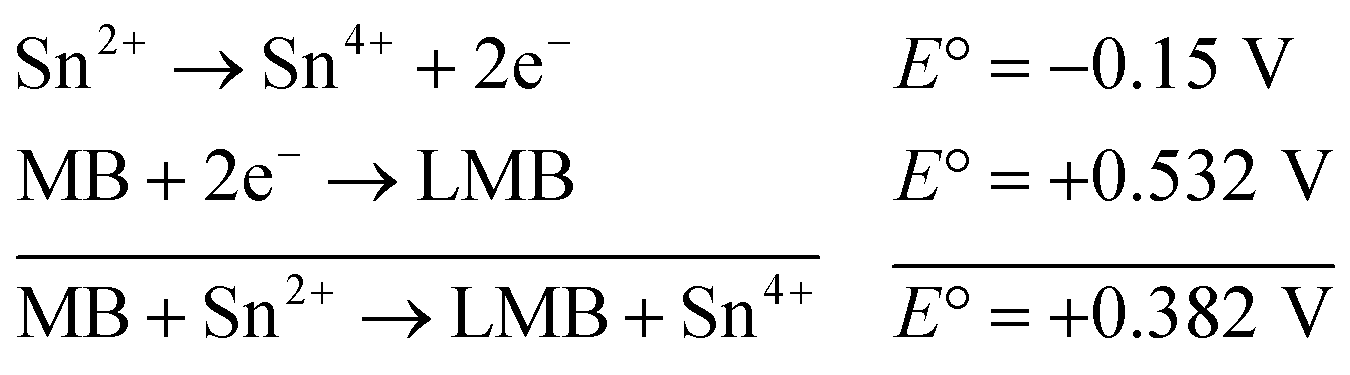
The reaction represented in eqn (1) does not happen on the experimental time scale, possibly be due to the low frequency of molecular collisions among the reactants. The micellar medium increases the frequency of molecular collisions due to the close association of the reactants at the micellar interface, while AgNPs helps in electron relay from donor to acceptor, thus catalyzing the MB reduction by Sn2+. In acidic medium, the oxidation of metallic Ag on the AgNPs surface by dissolved O2 is thermodynamically favorable, since E° of the reaction is positive, as depicted in eqn (2).
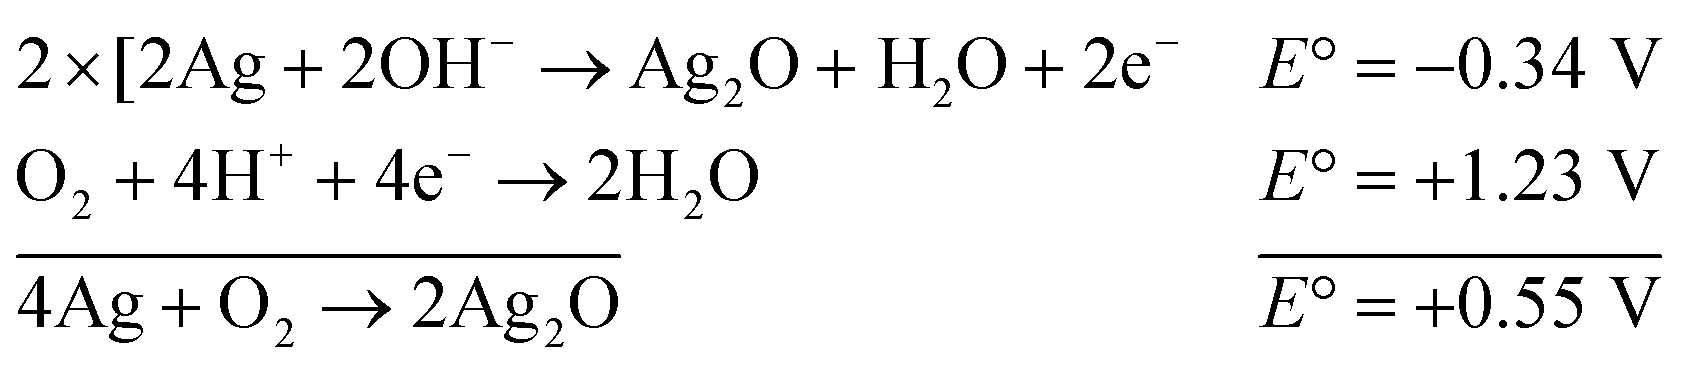 | (2) |
This elucidates the degradation of AgNPs in aqueous and AOT/SDS/DTAB micellar media, thus explaining the disappearance of the AgNPs yellowish color during MB reduction (Fig. 8a). Since among the AgNPs, Trp-AgNP and His-AgNP contain the highest Ag crystallite concentrations (Fig. S2†), a high concentration of dissolved O2 is thus required to oxidize all the Ag crystallites, whereas a low concentration of dissolved O2 is required in the cases of the other AgNPs with much lower Ag crystallite concentration. Thus, with Trp-AgNP and His-AgNP in aqueous and AOT/SDS/DTAB micellar mediums, dissolved O2 was completely utilized, making the solutions O2 deficient, while with the other AgNPs, Ag crystallites were completely oxidized (eqn (2)). This explains the persistence of the yellowish color in solutions with Trp-AgNP and His-AgNP, and the disappearance of yellow color in the other AgNPs catalyzed MB reduction in aqueous and AOT/SDS/DTAB/T-20 micellar media (Fig. 8a). This important observation with Trp-AgNP and His-AgNP may find major application in organic synthesis for generating an O2 deficient environment in acidic aqueous and micellar media, where catalyst poisoning by O2 prevails. The same mechanism further explains the disappearance of the SPR peak of Glu-AgNP, and the persistence of the SPR peak of Trp-AgNP as observed in Fig. S21.† The blue shift with decreased absorbance observed for Trp-AgNP in Fig. S21† is due to the decreased Ag crystallite concentration resulting from their oxidation to Ag2O crystallites by dissolved O2 in acidic medium (eqn (2)), followed by their dissolution.80 In acidic medium, the backward oxidation of LMB to MB, depicted by eqn (3) is thermodynamically favorable due to the overall positive E° value.
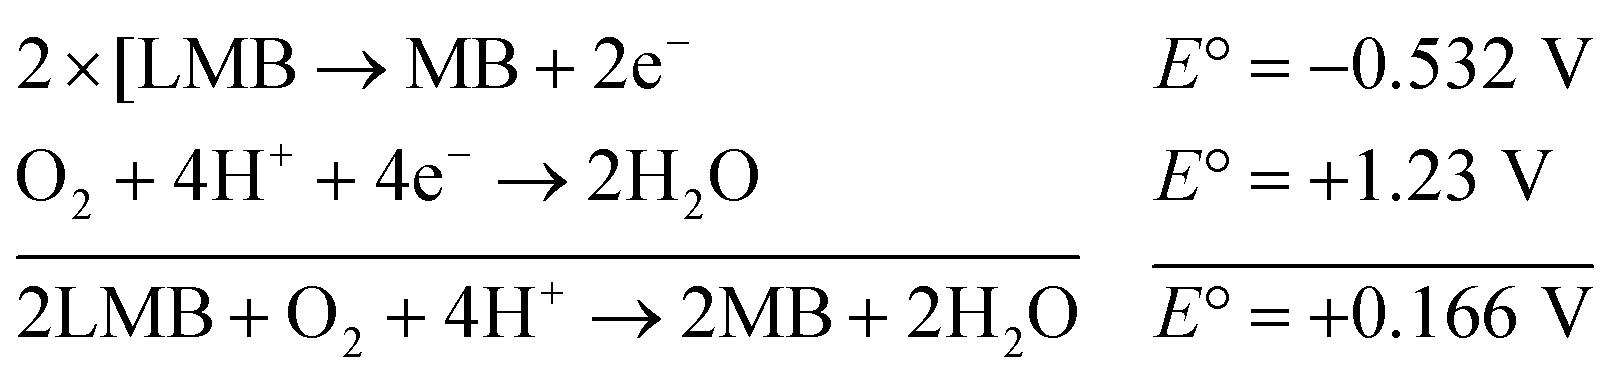 | (3) |
Among the solvent media studied in his work, the T-20 micellar medium has strong affinity towards aerobic O2.81–85 Thus, in comparison to aqueous and AOT/SDS/DTAB micellar media, the T-20 micellar medium contains a higher concentration of dissolved O2. The reaction depicted in eqn (3), thus becomes possible, confirmed by the generation of the MB peak at 665 nm (Fig. S21†), due to the backward oxidation of LMB to MB. The reaction depicted in eqn (3) is not possible in the other solvent media, due to the deficiency of dissolved O2 created by the reaction represented in eqn (2), thus barring the occurrence of the backward oxidation of LMB. The reason for not observing the backward oxidation of LMB in the presence of Trp-AgNP and His-AgNP in the T-20 micellar medium may be due to the high Ag crystallite concentration. The high Ag crystallite concentration in Trp-AgNP and His-AgNP further engages the additional dissolved O2 incorporated in the reaction solution due to the affinity of T-20 for aerobic O2, as depicted by the oxidation reaction in eqn (2). In T-20 micellar medium, in the presence of the other AgNPs, their Ag crystallite concentration was not sufficient to utilize the overall dissolved O2. Therefore, dissolved O2 persisted in these solutions, thus making the thermodynamically favorable backward oxidation of LMB possible, as depicted in eqn (3). Since Ag2O is a widely used catalyst for aerobic oxidation reactions,86 it is proposed here that with increased Ag2O concentration in the reaction solutions left after MB reduction, they could have assisted the LMB oxidation to MB. The lowest k0 value observed for AgNP may be due to the presence of large sized Ag2O crystallites (Table 3). The highest catalytic activity of Trp-AgNP followed by His-AgNP is therefore attributed to its highest Ag crystallite concentration. The highest negative zeta potential of Trp-AgNP could have resulted in strong adsorption of MB, a cationic dye, over its surface. The presence of π–π interactions between MB and the indole group of Trp present over the Trp-AgNP may have further facilitated MB adsorption. Furthermore, the highest content of Ag0 in Trp-AgNP, as shown by XPS and UV-visible spectroscopy results (Table S3†), along with a bigger active contact surface for MB due to its smaller size, must have contributed to its highest MB reducing ability.
 | ||
| Scheme 3 Schematic arrangement of MB, Sn2+ ions and AgNPs during the catalytic reduction of MB by SnCl2 as the reductant in aqueous and aqueous micellar media of SDS, AOT, DTAB and T-20. | ||
3.6. Catalytic activity of AgNPs on congo red (CR) and 4-nitrophenol (4-NP) reduction
In aqueous media, CR showed absorption bands at 240 nm (n–π* transitions associated with di-substituted benzene ring), 340 nm (n–π* transitions associated with naphthalene rings), and 500 nm (π–π* transitions associated with the azo group).87Fig. 12 illustrates the catalytic activity of AgNPs for the reduction of CR by NaBH4. Without AgNPs, CR reduction progressed, but with a very slow rate. In the presence of AgNPs, the red color of CR was bleached to a colorless solution (Fig. 12), and the absorption maximum at 500 nm diminished, indicating the reduction of azo bonds, while the absorbance of 340 and 240 nm peaks gradually decreased, indicating the reduction of the naphthalene and benzene derivatives. This confirmed the substantial catalytic activity of AgNP, Ala-AgNP, His-AgNP, Glu-AgNP and Asp-AgNP on CR reduction. The AgNPs catalyzed CR reduction followed a linear relationship observed for pseudo-first order kinetics (Fig. 13). The absorbance of CR is proportional to its concentration; the ratio of absorbance at time t (At) and time t = 0 (A0) are equivalent to the ratio of CR concentration at time t (Ct) and time t = 0 (C0). The rate constant (k1) was determined from the linear plot of ln(Ct/C0) versus reduction time in seconds, reported in Table 4. In order to compare the catalytic activity of the AgNPs with the ones reported in the literature, the activity parameter κ = k1/m, which is the ratio of the pseudo-first order rate constant (k1) to the total mass of the catalyst added, was used to compare the catalytic efficiency of the AgNPs. The catalytic efficiency of AgNPs, indicated by the k1 values, follows the trend AgNP > Asp-AgNP > Ala-AgNP > His-AgNP > Glu-AgNP > Trp-AgNP ≥ Met-AgNP. The highest Ag crystallite concentration in Trp-AgNP and aggregation behaviour observed for Met-AgNP in aqueous CR may have played a crucial role in decreasing their catalytic activity. Since the amino acid functionalization decreases the Ag2O crystallite concentration in the f-AgNPs, and AgNP, with highest Ag2O and lowest Ag crystallite content (Table S3†) showing the highest catalytic efficiency, it seems that Ag2O crystallites are responsible for the catalytic activity on CR reduction.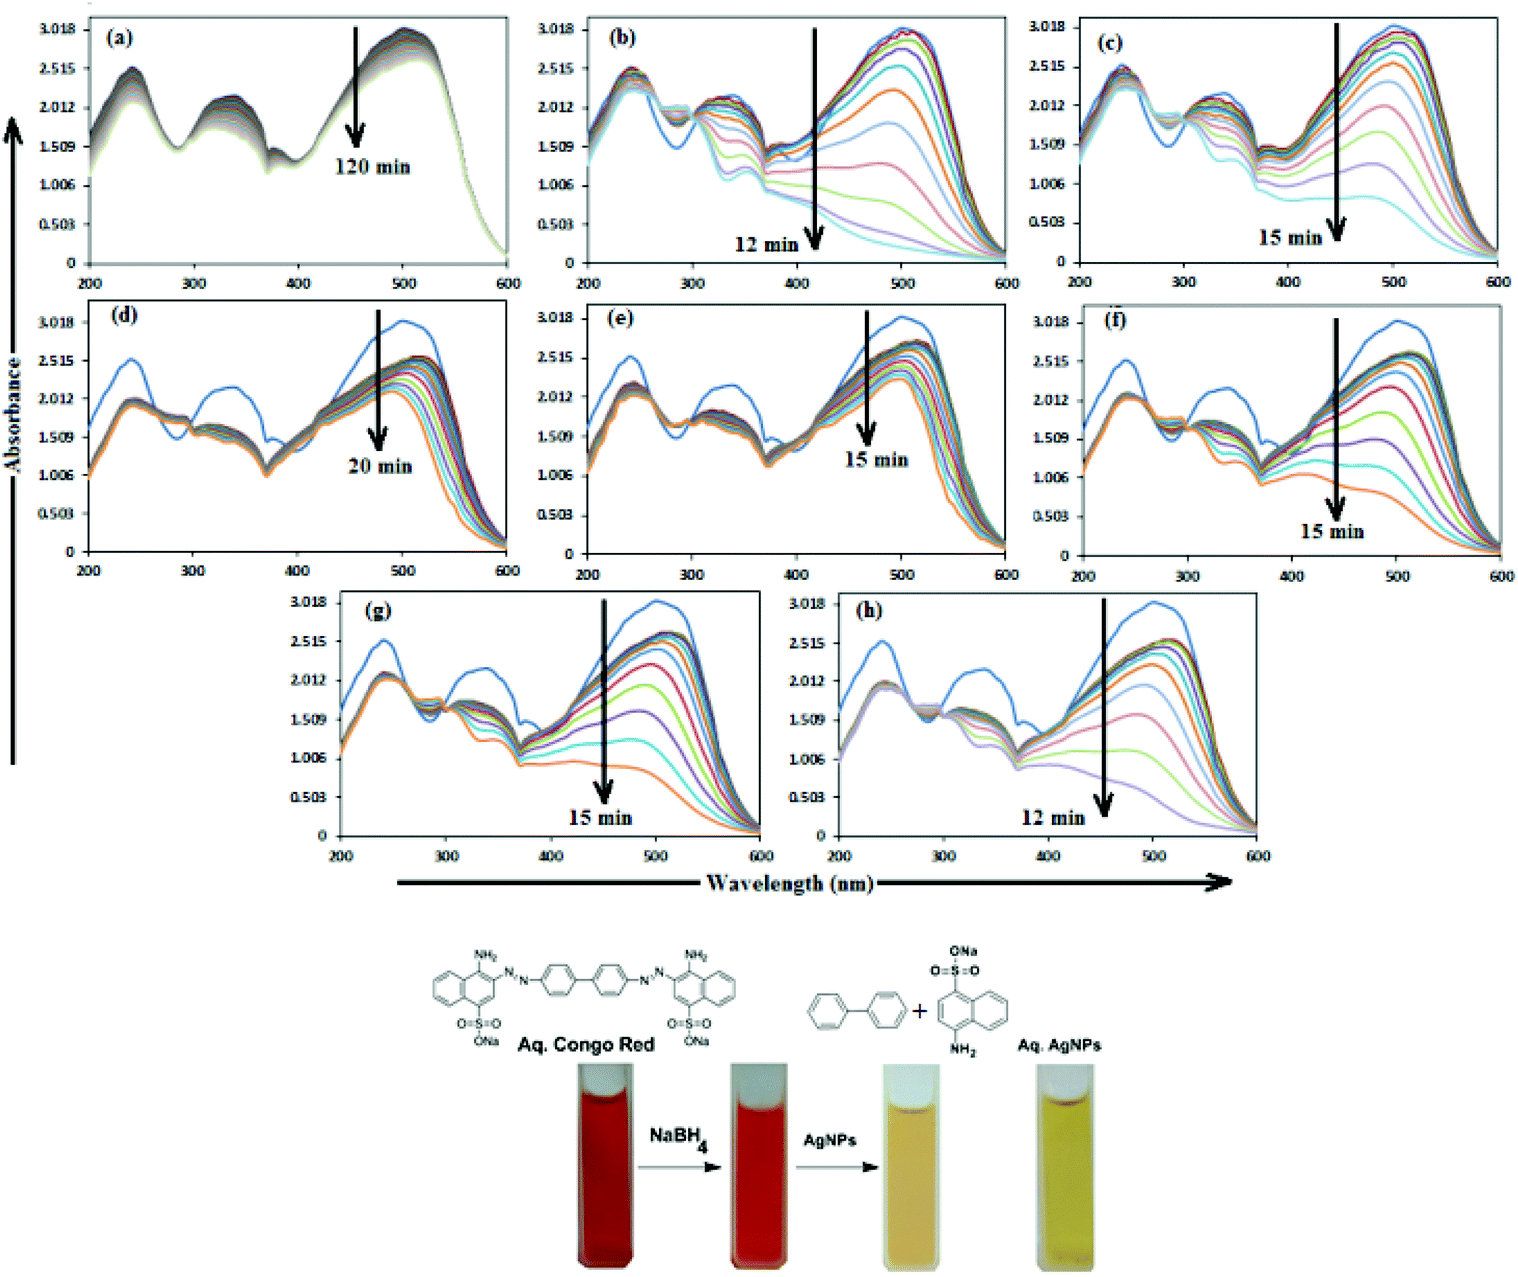 | ||
| Fig. 12 (A) Time dependent UV–visible absorption spectra for the catalytic reduction of CR by NaBH4 (a) in the absence of AgNPs and in the presence of 30 μM AgNPs: (b) AgNP, (c) Ala-AgNP, (d) Trp-AgNP, (e) Met-AgNP, (f) His-AgNP, (g) Glu-AgNP and (h) Asp-AgNP. | ||
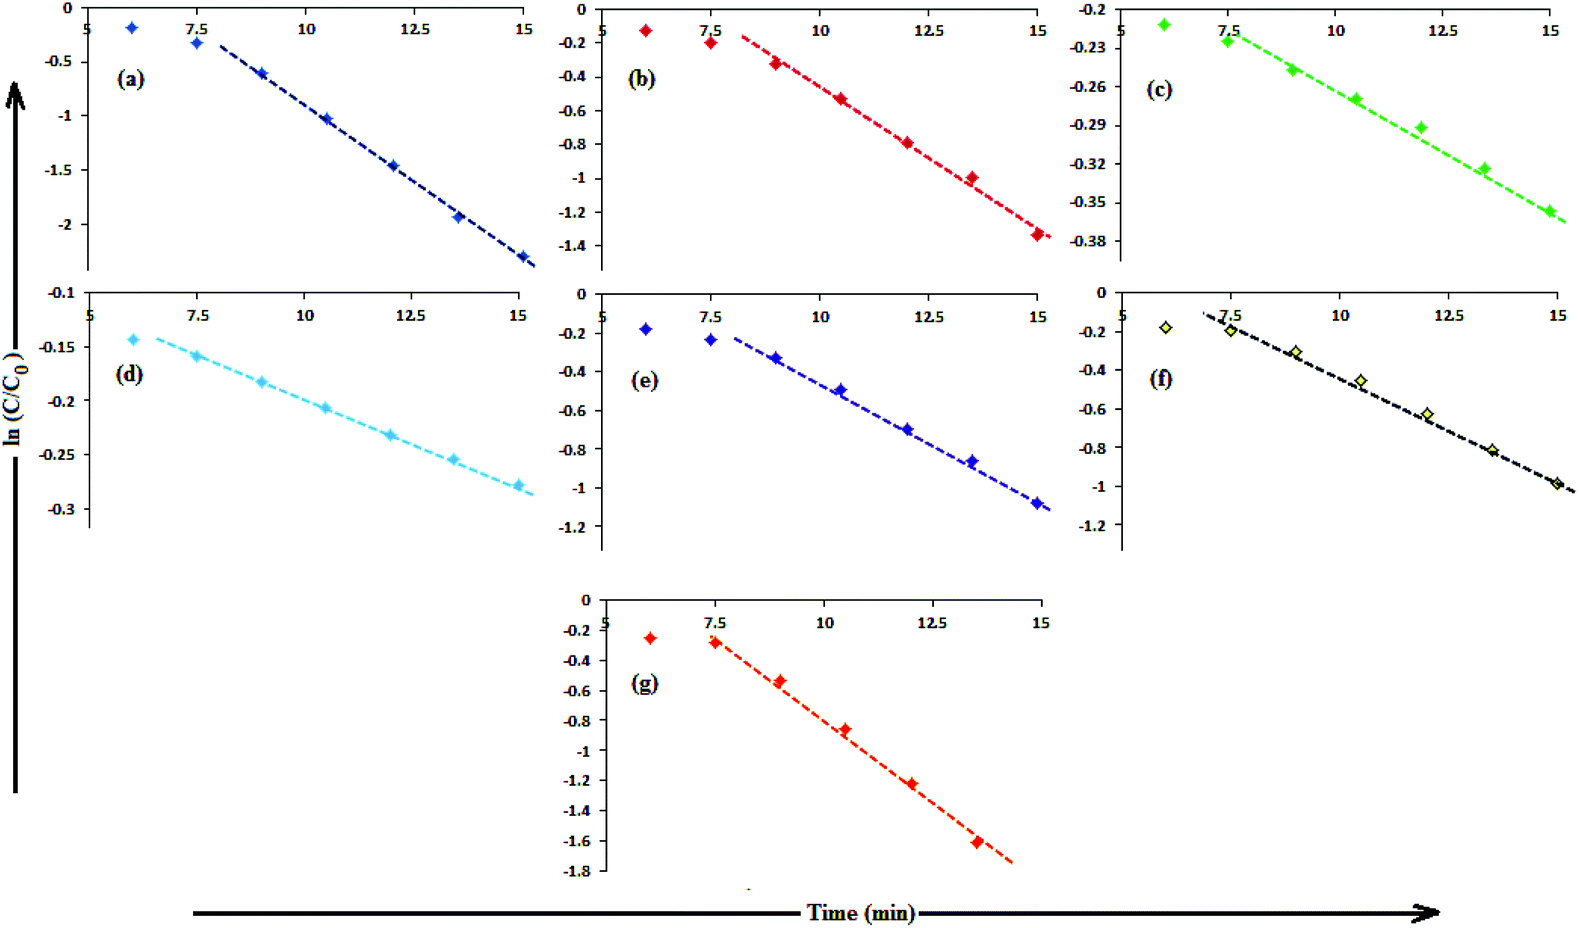 | ||
| Fig. 13 (B) The plot of ln(C/C0) versus time for the reduction of CR, catalyzed by (a) AgNP (b) Ala-AgNP (c) Trp-AgNP (d) Met-AgNP (e) His-AgNPs (f) Glu-AgNPs (g) Asp-AgNPs. | ||
| AgNPs | k 1 (CR) | k 1 (4-NP) |
|---|---|---|
| AgNP | 0.2486 | N/A |
| Ala-AgNP | 0.1486 | 0.0729 |
| Trp-AgNP | 0.0152 | N/A |
| Met-AgNP | 0.0146 | 0.0741 |
| His-AgNP | 0.1222 | 0.0169 |
| Glu-AgNP | 0.1162 | 0.0397 |
| Asp-AgNP | 0.2210 | 0.0541 |
The catalytic activity of AgNPs for the reduction of 4-NP by NaBH4 is shown in Fig. 14. Aqueous 4-NP shows an absorption maximum at 320 nm, but after NaBH4 addition, the peak shifted to 400 nm with increased intensity, due to the phenolate ion formation, which is fully conjugated with the benzene moiety.88 Without AgNPs, negligible change in the absorbance at 420 nm indicates the ineffective reduction of 4-NP to 4-aminophenol by NaBH4. In the presence of the AgNPs (except AgNP and Trp-AgNP), the yellow color of the 4-nitrophenolate ion bleaches to colorless solution, and absorption maxima at 400 nm diminished with appearance of a new peak at 300 nm (Fig. 14). This confirmed the reduction of 4-NP and formation of 4-aminophenol.76 AgNP and Trp-AgNP were able to reduce 4-NP initially, but the reduction ceased as the reaction progressed (Fig. 14). The AgNPs catalyzed 4-NP reduction followed a linear relationship observed for pseudo-first order kinetics (Fig. 15). The rate constant (k1) was determined from the linear plot of ln(Ct/C0) versus reduction time in seconds, reported in Table 4. In order to compare the catalytic activity of the AgNPs with the ones reported in the literature, the κ value was used to compare the catalytic efficiency of the AgNPs. The catalytic efficiency of AgNPs inferred by k1 values follows the trend Met-AgNP > Ala-AgNP > Asp-AgNP > Glu-AgNP > His-AgNP. The lowest Ag crystallite concentration and unsymmetrical size of AgNP may have a profound effect on limiting its catalytic activity, while possibility of the Trp-AgNP surface poisoning due to strong π–π interactions between Trp and 4-aminophenol could have resulted in the stalling of its catalytic activity. The important observation on the deactivation of catalytic activity of AgNP and Trp-AgNP may be useful for such reduction reactions where improved selectivity (such as Lindlar's catalyst) is required.
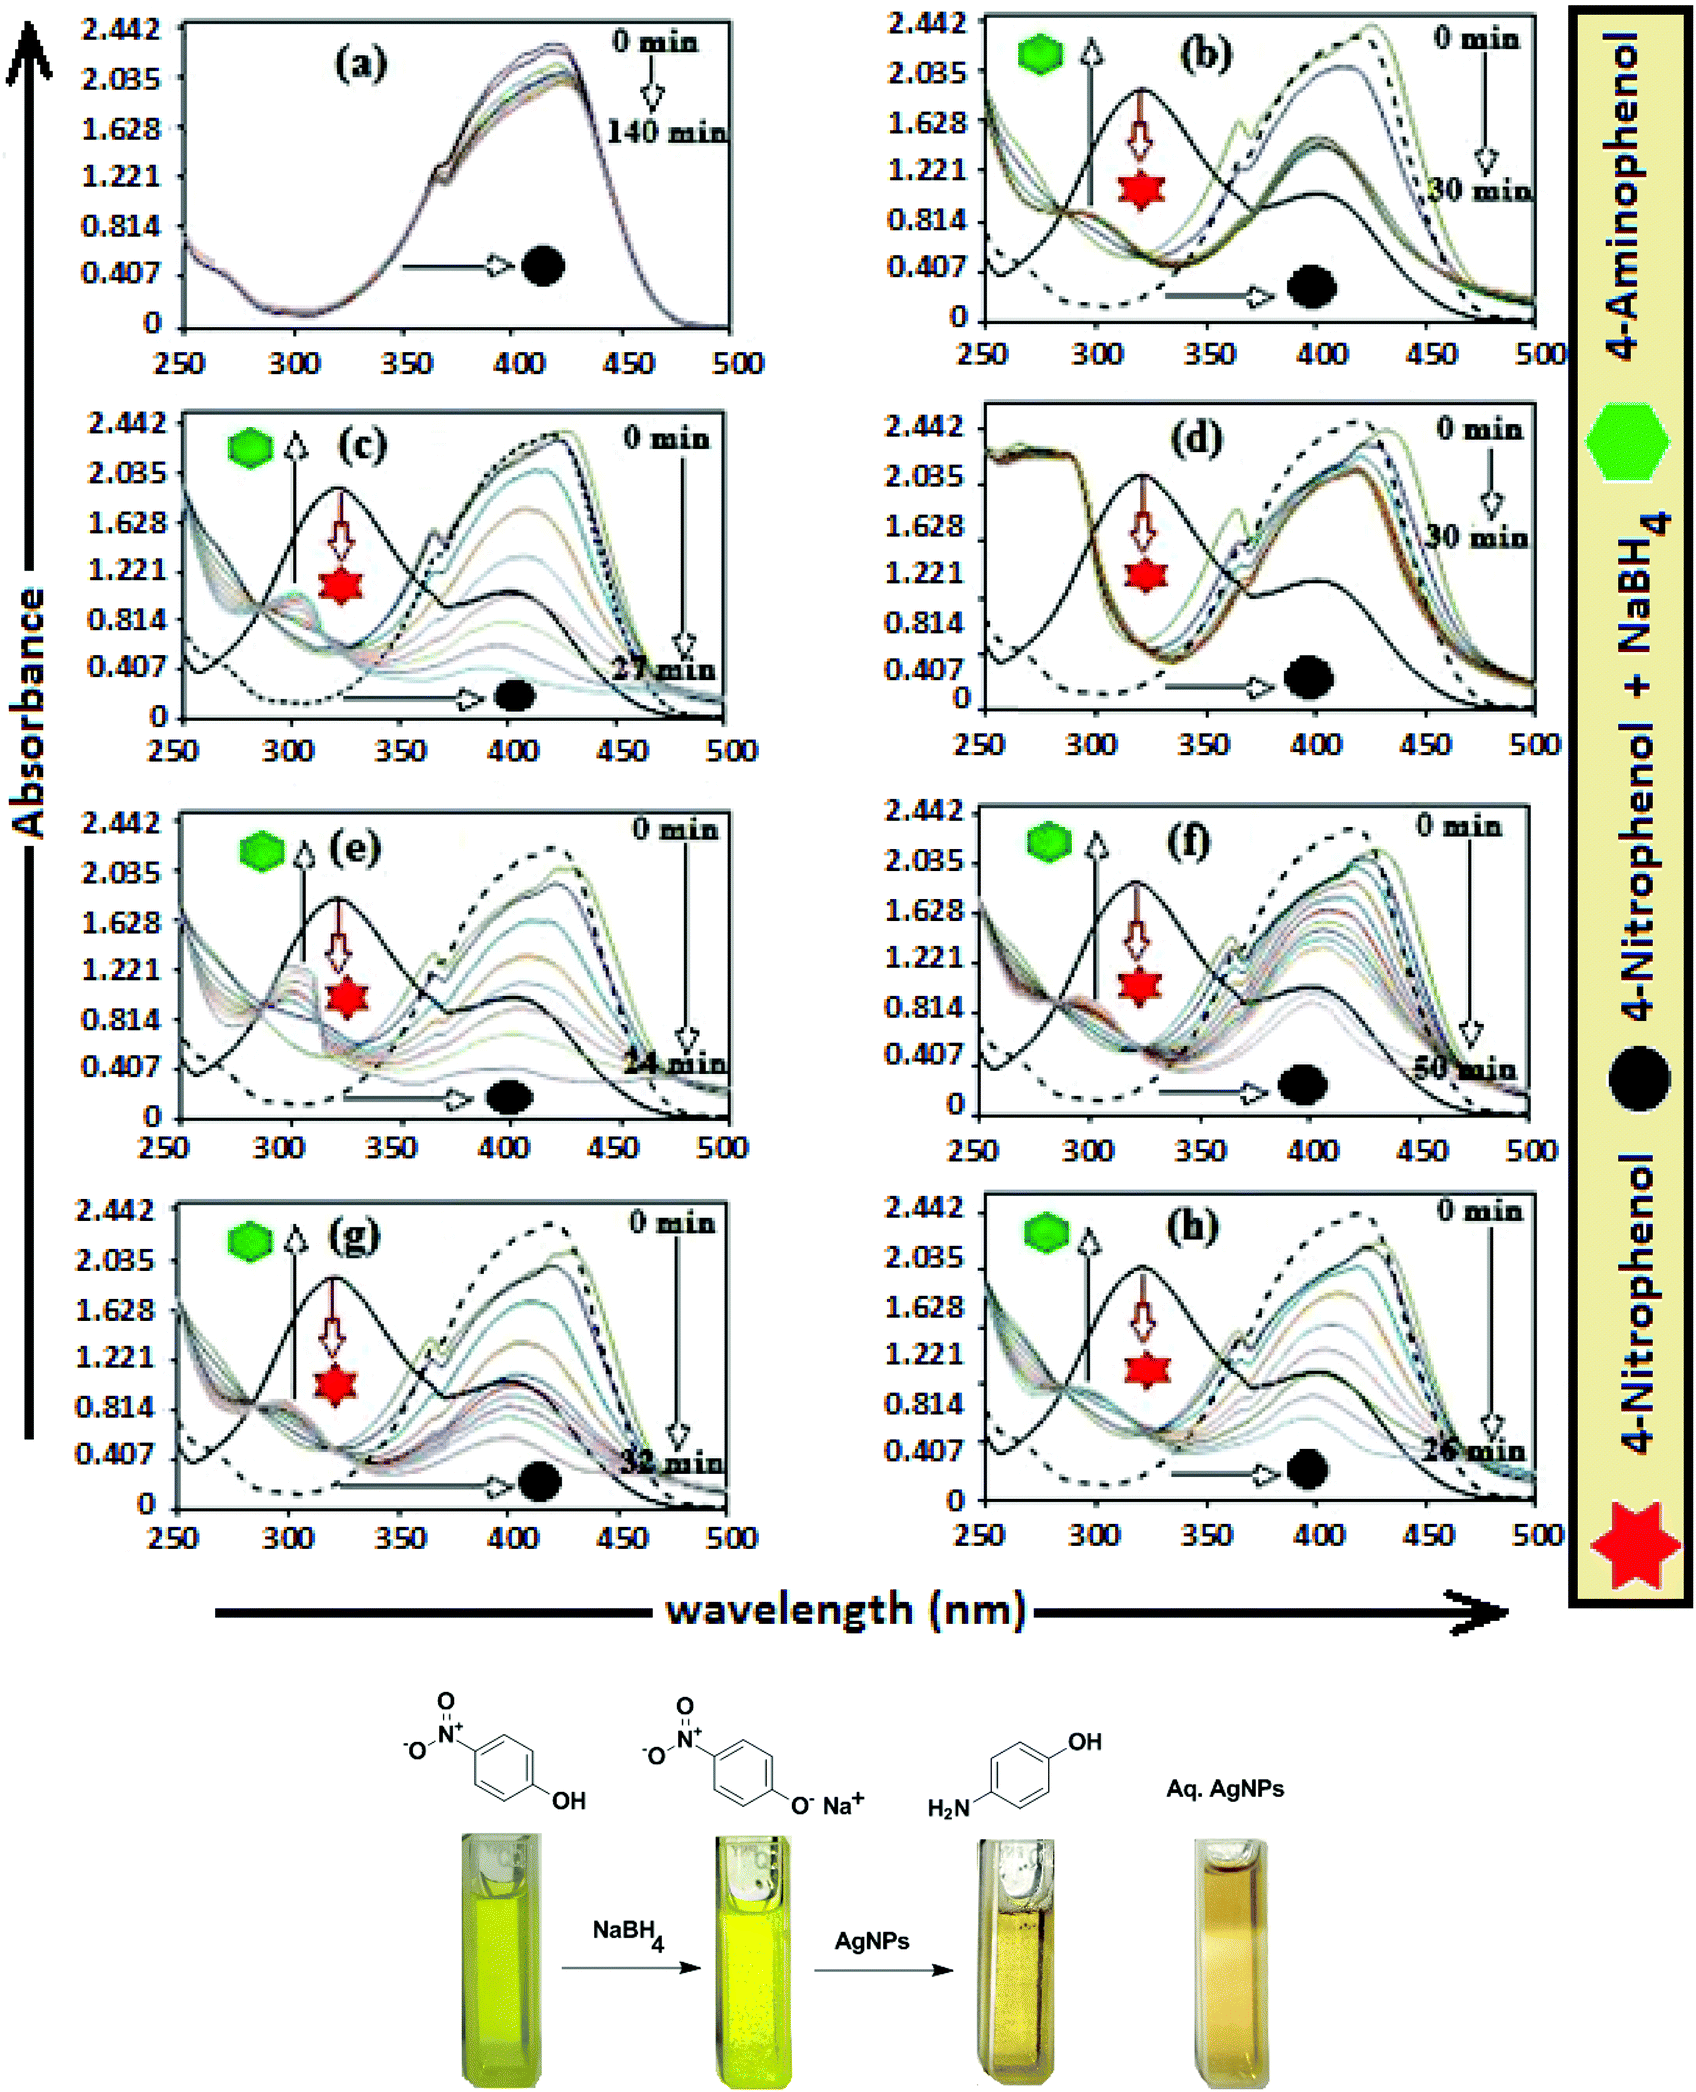 | ||
| Fig. 14 (A) Time-dependent UV–visible spectra for the catalytic reduction of 4-nitrophenol by NaBH4 (a) in the absence of AgNPs and in the presence of 30 μM AgNPs: (b) AgNP, (c) Ala-AgNP, (d) Trp-AgNP, (e) Met-AgNP, (f) His-AgNP, (g) Glu-AgNP and (h) Asp-AgNP. | ||
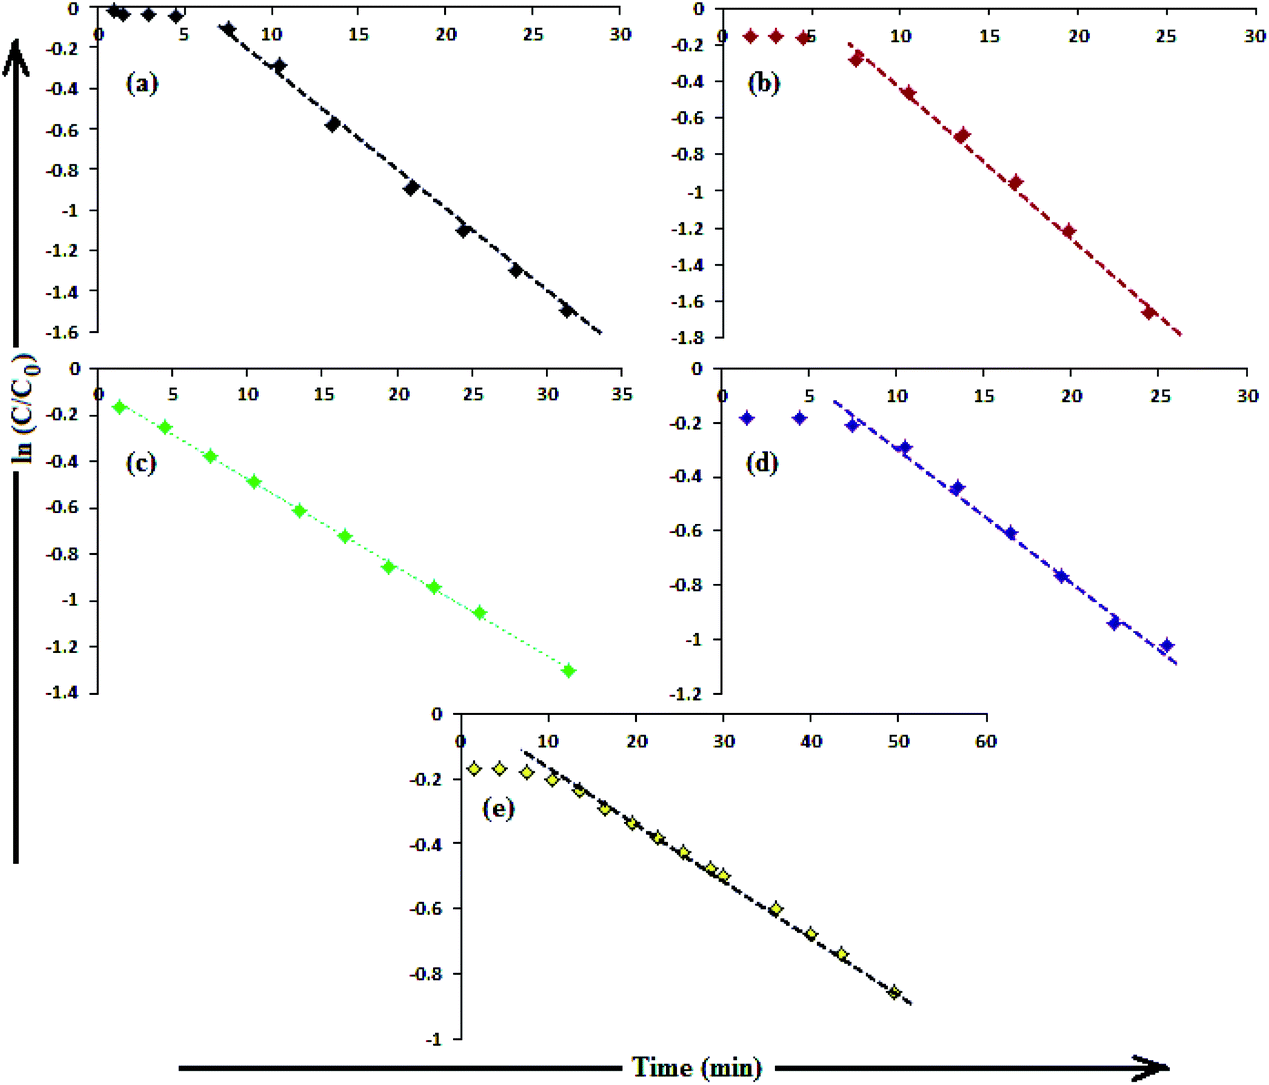 | ||
| Fig. 15 (B) The plot of ln(C/C0) versus time for the reduction of 4-NP catalyzed by (a) Ala-AgNP, (b) Met-AgNP, (c) His-AgNP, (d) Glu-AgNP, (e) Asp-AgNPs. | ||
 | ||
| Scheme 4 Reaction mechanism for the AgNPs catalyzed reduction of 4-NP and CR by NaBH4. | ||
3.7. Comparison with literature
Owing to the uniqueness of the resources used in this work for the synthesis of the AgNPs, their catalytic abilities may not be directly comparable to those shown by other nanomaterials. An example of this is the catalytic reduction of MB, which in this work followed pseudo-second order kinetics. Nevertheless, the AgNPs catalytic activities in the reduction of MB, CR and 4-NP presented in this work, when compared to the literature, are on par with those in the literature in some cases and better in the other cases. For MB reduction, when compared to the literature, either the amount of catalyst/reducing agent used was high or the reduction time or % MB reduction was higher than with the AgNPs reported here. Furthermore, for CR and 4-NP reduction, the κ values with AgNPs reported here are much higher, when compared with literature. All the comparison parameters such as activity parameter, rate constant, amount of catalyst and reagents used, % reduction and reduction time for the catalytic reduction of MB, CR and 4-NP are summarized in Tables S4, S5, and S6,† respectively. In this context, it is important to note that irrespective of the comparison, the results in this work are far better, compared to those normally required for the respective applications. This is because of the possibility for producing these cost-effective AgNPs on a large scale and their extreme colloidal stability in harsh aqueous environment of variable pH, ionic strength, surfactants, and dyes.The good catalytic activity of AgNPs is attributed to their high monodispersity and stability in solution, their relatively smaller size and Ag/Ag2O nanocomposite polycrystallinity. Moreover, the multiple functional groups present over the AgNPs surfaces due to amino acid functionalization and various NG components provide a suitable environment for the development of electrostatic interaction and H-bonding with the reagents, resulting in their enhanced adsorption over their surfaces. Furthermore, the AgNPs smaller size results in high surface-to-volume ratio and more atoms on the surface as potential catalytic sites, thereby generating a strong electron relay effect.
4. Conclusions
A green protocol has been developed for the synthesis of amino acid functionalized AgNPs using Neem gum as a multifunctional reagent. The XRD and XPS analysis of the AgNPs revealed that they were composed of Ag/Ag2O nanocrystallites. The f-AgNPs exhibited good colloidal stability against high ionic strength, variable pH, surfactants and dye solutions. The catalytic efficiency of the AgNPs was demonstrated for MB reduction by acidic SnCl2, and CR/4-NP reduction by NaBH4. The order of the most efficient solvent system for MB reduction was AOT > SDS > DTAB > aqueous media, and 100% MB reduction was achieved within 40 s with Trp-AgNP in all solvent systems. The catalytic efficiency of AgNPs on CR and 4-NP reduction by NaBH4 followed the trend (AgNP > Asp-AgNP > Ala-AgNP > His-AgNP > Glu-AgNP > Trp-AgNP ≥ Met-AgNP) and (Met-AgNP > Ala-AgNP > Asp-AgNP > Glu-AgNP > His-AgNP), respectively. Here, the AgNPs-catalyzed clock reaction was demonstrated using MB and acidic SnCl2 in T-20 micellar medium. To the best of our knowledge, this is the first attempt at demonstrating a one-cycle redox MB clock reaction using silver NPs in acidic nonionic micellar medium. The clock reaction suggests the potential use of the AgNPs as low cost sensors for oxygen leakage in vacuum-packed food packages, and for creating oxygen deficient environments in acidic aqueous and micellar media, where catalyst poisoning by O2 prevails. The deactivation of catalytic activity observed for Trp-AgNP may find application in such catalytic reduction, where improved selectivity is required.Conflicts of interest
There are no conflicts to declare.Acknowledgements
Man Singh gratefully acknowledges Defence Research and Development Organization (DRDO), Government of India, (Research project No. ERIP/ER/1203062/M/01/1586), for financial assistance. Abhishek Chandra thanks DRDO for providing financial assistance in the form of Senior Research Fellowship (SRF) and Gajendra Inwati (SNS, CUG) for his timely assistance during XPS analysis. The authors are thankful to the Central University of Gujarat, Gandhinagar for providing infrastructure and instrumentation facilities.References
- P. Raveendran, J. Fu and S. L. Wallen, J. Am. Chem. Soc., 2003, 125, 13940–13941 CrossRef CAS PubMed.
- S. Narayanan, B. N. Sathy, U. Mony, M. Koyakutty, S. V. Nair and D. Menon, ACS Appl. Mater. Interfaces, 2012, 4, 251–260 CAS.
- E. C. Njagi, H. Huang, L. Stafford, H. Genuino, H. M. Galindo, J. B. Collins, G. E. Hoag and S. L. Suib, Langmuir, 2011, 27(1), 264–271 CrossRef CAS PubMed.
- R. Varma, Green Chem., 2014, 16, 2027–2041 RSC.
- J. Virkutyte and R. S. Varma, ACS Symp. Ser., 2013, 1124, 11–39 CrossRef CAS.
- S. K. Das, E. Marsili and M. Rahman, Nanomaterials, 2011, 253–278 Search PubMed.
- A. T. Harris and R. Bali, J. Nanopart. Res., 2008, 10, 691–695 CrossRef CAS.
- S. Ghosh, S. Patil, M. Ahire, R. Kitture, D. D. Gurav, A. M. Jabgunde, S. Kale, K. Pardesi, V. Shinde, J. Bellare, D. D. Dhavale and B. A. Chopade, J. Nanobiotechnol., 2012, 10, 17 CrossRef CAS PubMed.
- M. Khan, S. F. Adil, M. N. Tahir, W. Tremel, H. Z. Alkhathlan, A. Al-Warthan and M. R. H. Siddiqui, Int. J. Nanomed., 2013, 8(1), 1507–1516 Search PubMed.
- M. Rai and A. Yadav, IET Nanobiotechnol., 2013, 7(3), 117–124 CrossRef CAS PubMed.
- V. V. Makarov, A. J. Love, O. V. Sinitsyna, S. S. Makarova, I. V. Yaminsky, M. E. Taliansky and N. O. Kalinina, Acta Naturae, 2014, 6(1), 35–44 CAS.
- S. S. Shankar, A. Rai, A. Ahmad and M. Sastry, J. Colloid Interface Sci., 2004, 275, 496–502 CrossRef CAS PubMed.
- Z. Khan, O. Bashir, J. I. Hussain, S. Kumar and E. Ahmad, Colloids Surf., B, 2012, 98, 85–90 CrossRef CAS PubMed.
- C. Dipankar and S. Murugan, Colloids Surf., B, 2012, 98, 112–119 CrossRef CAS PubMed.
- P. Kumar, M. Govindaraju, S. Senthamilselvi and K. Premkumar, Colloids Surf., B, 2013, 103, 658–661 CrossRef CAS PubMed.
- S. A. Kumar, S. Ravi, V. Kathiravan and S. Velmurugan, Spectrochim. Acta, Part A, 2014, 121, 88–93 CrossRef PubMed.
- S. Li, Y. Shen, A. Xie, X. Yu, L. Qiu, L. Zhang and Q. Zhang, Green Chem., 2007, 9, 852–858 RSC.
- G. A. Kahrilas, L. M. Wally, S. J. Fredrick, M. Hiskey, A. L. Prieto and J. E. Owens, ACS Sustainable Chem. Eng., 2014, 2, 367–376 CrossRef CAS.
- A. A. Kulkarni and B. M. Bhanage, ACS Sustainable Chem. Eng., 2014, 2, 1007–1013 CrossRef CAS.
- M. N. Nadagouda, N. Iyanna, J. Lalley, C. Han, D. D. Dionysiou and R. S. Varma, ACS Sustainable Chem. Eng., 2014, 2, 1717–1723 CrossRef CAS.
- J. Puiso, D. Jonkuviene, I. Macioniene, J. Salomskiene, I. Jasutiene and R. Kondrotas, Colloids Surf., B, 2014, 121, 214–221 CrossRef CAS PubMed.
- P. Velusamy, J. Das, R. Pachaiappan, B. Vaseeharan and K. Pandian, Ind. Crops Prod., 2015, 66, 103–109 CrossRef CAS.
- A. J. Kora, S. R. Beedu and A. Jayaraman, Org. Med. Chem. Lett., 2012, 2, 17 CrossRef PubMed.
- A. J. Kora, R. B. Sashidhar and J. Arunachalam, Carbohydr. Polym., 2010, 82, 670–679 CrossRef CAS.
- A. J. Kora, R. B. Sashidhar and J. Arunachalam, Process Biochem., 2012, 47, 1516–1520 CrossRef CAS.
- M. Thakur, S. Pandey, A. Mewada, R. Shah, G. Oza and M. Sharon, Spectrochim. Acta, Part A, 2013, 109, 344–347 CrossRef CAS PubMed.
- I. M. Krishna, G. B. Reddy, G. Veerabhadram and A. Madhusudhan, Appl. Nanosci., 2016, 6, 681–689 CrossRef.
- V. K. Vidhu and D. Philip, Spectrochim. Acta, Part A, 2014, 117, 102–108 CrossRef CAS PubMed.
- V. K. Vidhu and D. Philip, Micron, 2014, 56, 54–62 CrossRef CAS PubMed.
- H. Bar, D. K. Bhui, G. P. Sahoo, P. Sarkar, S. Pyne and A. Misra, Colloids Surf., A, 2009, 348, 212–216 CrossRef CAS.
- Y. He, F. Wei, Z. Ma, H. Zhang, Q. Yang, B. Yao, Z. Huang, J. Li, C. Zeng and Q. Zhang, RSC Adv., 2017, 7, 39842–39851 RSC.
- G. A. Kahrilas, W. Haggren, R. L. Read, L. M. Wally, S. J. Fredrick, M. Hiskey, A. L. Prieto and J. E. Owens, ACS Sustainable Chem. Eng., 2014, 2, 590–598 CrossRef CAS.
- X. Li, J. J. Lenhart and H. W. Walker, Langmuir, 2012, 28, 1095–1104 CrossRef CAS PubMed.
- H. Bar, D. K. Bhui, G. P. Sahoo, P. Sarkar, S. P. De and A. Misra, Colloids Surf., A, 2009, 339, 134–139 CrossRef CAS.
- M. N. Nadagouda and R. S. Varma, Green Chem., 2008, 10, 859–862 RSC.
- A. A. AbdelHamid, M. A. Al-Ghobashy, M. Fawzy, M. B. Mohamed and M. M. Abdel-Mottaleb, ACS Sustainable Chem. Eng., 2013, 1, 1520–1529 CrossRef CAS.
- R. W. Soukup and K. Soukup, The Series “Progress in the Chemistry of Organic Natural Products”: 75 Years of Service in the Development of Natural Product Chemistry, ed. A. D. Kinghorn, H. Falk and J. Kobayashi, Springer-Verlag Wien Publishers, Switzerland, 1999, pp. 453–588 Search PubMed.
- S. Mukherjee and H. Srivastava, J. Am. Chem. Soc., 1955, 77(2), 422–423 CrossRef CAS.
- M. Allman, M. Pena and D. Peng, Eur. J. Clin. Nutr., 1995, 49, 169–178 CAS.
- D. Anderson and A. Hendrie, Juss. Carbohydr. Res., 1971, 20, 259–268 CrossRef CAS PubMed.
- T. Brindha and J. Mallika, Juss. Int. J. Pharm. Chem., 2015, 5(6), 227–231 Search PubMed.
- T. Shoeib, K. W. M. Siu and A. C. Hopkinson, J. Phys. Chem. A, 2002, 106, 6121–6128 CrossRef CAS.
- T. Shoeib and B. L. Sharp, Inorg. Chim. Acta, 2009, 362, 1925–1934 CrossRef CAS.
- J. A. Jacob, S. Naumov, T. Mukherjee and S. Kapoor, Colloids Surf., B, 2011, 87, 498–504 CrossRef CAS PubMed.
- S. K. Ghosh, S. Kundu, M. Mandal and T. Pal, Langmuir, 2002, 18, 8756–8760 CrossRef CAS.
- T. Pal, S. De, N. R. Jana, N. Pradhan, R. Mandal and A. Pal, Langmuir, 1998, 14, 4724–4730 CrossRef CAS.
- Z. J. Jiang, C. Y. Liu and L. W. Sun, J. Phys. Chem. B, 2005, 109, 1730–1735 CrossRef CAS PubMed.
- T. Snehalatha, K. C. Rajanna and P. K. Saiprakash, J. Chem. Educ., 1997, 74(2), 228–233 CrossRef CAS.
- C. Ray, S. Dutta, S. Sarkar, R. Sahoo, A. Roy and T. Pal, RSC Adv., 2013, 3, 24313–24320 RSC.
- M. Basu, A. K. Sinha, M. Pradhan, S. Sarkar, A. Pal, C. Mondal and T. Pal, J. Phys. Chem. C, 2012, 116, 25741–25747 CAS.
- W. Wei, X. Mao, L. Ortiz and D. Sadoway, J. Mater. Chem., 2011, 21, 432–438 RSC.
- L. Xu, B. Wei, W. Liu, H. Zhang, C. Su and J. Che, Nanoscale Res. Lett., 2013, 8, 536 CrossRef PubMed.
- S. Küünal, S. Kutti, P. Rauwel, M. Guha, D. Wragg and E. Rauwel, Nano Lett., 2016, 6(3), 191–197 CrossRef.
- E. E. Elemike, D. C. Onwudiwe, A. C. Ekennia, C. U. Sonde and R. C. Ehiri, Molecules, 2017, 22, 674 CrossRef PubMed.
- S. Ravichandran, V. Paluri, G. Kumar, K. Loganathan and B. R. K. Venkata, J. Exp. Nanosci., 2016, 11(6), 445–458 CrossRef CAS.
- V. Gopinath, D. MubarakAli, S. Priyadarshini, M. Priyadharshini, N. Thajuddin and P. Velusamy, Colloids Surf., B, 2012, 96, 69–74 CrossRef CAS PubMed.
- F. Korkmaz, D. A. Erdogan and S. O. Yaman, New J. Chem., 2015, 39, 5676–5685 RSC.
- P. Shashi, L. Manu and S. Mika, Colloids Surf., A, 2010, 364, 34–41 CrossRef.
- S. Agnihotri, S. Mukherji and S. Mukherji, Nanoscale, 2013, 5, 7328–7340 RSC.
- Q. Chen, W. Shi, Y. Xu, D. Wu and Y. Sun, Mater. Chem. Phys., 2011, 125, 825–832 CrossRef CAS.
- X. Yang, L. Xu, X. Yu and Y. Guo, Catal. Commun., 2008, 9, 1224 CrossRef CAS.
- Y. Chi, L. Zhao, Q. Yuan, X. Yan, Y. Li, N. Li and X. Li, J. Mater. Chem., 2012, 22, 13571–13577 RSC.
- S. Agnihotri, G. Bajaj, S. Mukherji and S. Mukherji, Nanoscale, 2015, 7, 7415–7429 RSC.
- T. C. Kaspar, T. Droubay, S. A. Chambers and P. S. Bagus, J. Phys. Chem. C, 2010, 114, 21562–21571 CAS.
- A. A. Taha, Adv. Nat. Sci.: Nanosci. Nanotechnol., 2015, 6, 045003 CrossRef.
- H. J. Kim, I.-S. Bae, S.-J. Cho, J.-H. Boo, B.-C. Lee, J. Heo, I. Chung and B. Hong, Nanoscale Res. Lett., 2012, 7(1), 30 CrossRef PubMed.
- Z. Zhang, X. Zhang, Z. Xin, M. Deng, Y. Wen and Y. Song, Nanotechnology, 2011, 22, 425601 CrossRef PubMed.
- E. Mazzotta, S. Rella, A. Turco and C. Malitesta, RSC Adv., 2015, 5, 83164–83186 RSC.
- M. A. Armani, A. Abu-Taleb, N. Remalli, M. Abdullah, V. V. S. S. Srikanth and N. K. Labhasetwar, RSC Adv., 2016, 6, 44145–44153 RSC.
- N. Durán, P. D. Marcato, M. Durán, A. Yadav, A. Gade and A. Rai, Appl. Microbiol. Biotechnol., 2011, 90, 1609–1624 CrossRef PubMed.
- T. C. Prathna, N. Chandrasekaran and A. Mukherjee, Colloids Surf., A, 2011, 390, 216–224 CrossRef CAS.
- J. Hierrezuelo, A. Sadeghpour, I. Szilagyi, A. Vaccaro and M. Borkovec, Langmuir, 2010, 26(19), 15109–15111 CrossRef CAS PubMed.
- D. V. Leff, L. Brandt and J. R. Heath, Langmuir, 1996, 12, 4723–4730 CrossRef CAS.
- S. L. Westcott, S. J. Oldenburg, T. R. Lee and N. J. Halas, Langmuir, 1998, 14, 5396–5401 CrossRef CAS.
- M. A. Rauf, M. A. Meetani, A. Khaleel and A. Ahmed, Chem. Eng. J., 2010, 157(2), 373–378 CrossRef CAS.
- R. Laoufi, J. Lazzari, O. Jupille, S. Robach, G. Garaud, P. Cabaih, H. Dolle, A. J. Crugel and A. Baillly, J. Phys. Chem. C, 2011, 115(11), 4673–4679 Search PubMed.
- S. Pande, S. Jana, S. Basu, A. K. Sinha, A. Datta and T. Pal, J. Phys. Chem. C, 2008, 112, 3619–3626 CAS.
- M. Hamity, R. H. Lema, C. A. Suchetti and H. E. Gsponer, J. Photochem. Photobiol., A, 2008, 200, 445–450 CrossRef CAS.
- E. K. Golz and D. A. V. Griend, Anal. Chem., 2013, 85, 1240–1246 CrossRef CAS PubMed.
- S. Eckhardt, P. S. Brunetto, J. Gagnon, M. Priebe, B. Giese and K. M. Fromm, Chem. Rev., 2013, 113, 4708–4754 CrossRef CAS PubMed.
- D. Leštan, M. Leštan and A. Perdih, Appl. Environ. Microbiol., 1994, 60(2), 606–612 Search PubMed.
- K. Miyashita, N. Inukai and T. Ota, Biosci., Biotechnol., Biochem., 1997, 61(4), 716–717 CrossRef CAS.
- K. S. Rhee, J. Food Sci., 1978, 43, 1–9 CrossRef.
- Y. Galagan and W. F. Sua, J. Photochem. Photobiol., A, 2008, 195, 378–383 CrossRef CAS.
- A. Mills, Chem. Soc. Rev., 2005, 34, 1003–1011 RSC.
- P. Das, S. Ray, A. Bhaumik, B. Banerjee and C. Mukhopadhyay, RSC Adv., 2015, 5, 6323–6331 RSC.
- L. G. Devi, S. G. Kumar and K. M. Reddy, Cent. Eur. J. Chem., 2009, 7(3), 468–477 CAS.
- W. Li, X. Ge, H. Zhang, Q. Ding, H. Ding, Y. Zhang, G. Wang, H. Zhang and H. Zhao, Inorg. Chem. Front., 2016, 3, 663–670 RSC.
Footnote |
| † Electronic supplementary information (ESI) available. See DOI: 10.1039/c7qi00569e |
| This journal is © the Partner Organisations 2018 |