
 Open Access Article
 This Open Access Article is licensed under a Creative Commons Attribution-Non Commercial 3.0 Unported Licence
A versatile method for the determination of photochemical quantum yields via online UV-Vis spectroscopy†
Eduard
Stadler
 *a,
Anna
Eibel
a,
David
Fast
a,
Hilde
Freißmuth
a,
Christian
Holly
a,
Mathias
Wiech
a,
Norbert
Moszner
b and
Georg
Gescheidt
*a
*a,
Anna
Eibel
a,
David
Fast
a,
Hilde
Freißmuth
a,
Christian
Holly
a,
Mathias
Wiech
a,
Norbert
Moszner
b and
Georg
Gescheidt
*a
aInstitute of Physical and Theoretical Chemistry, NAWI Graz, Graz University of Technology, Stremayrgasse 9, 8010 Graz, Austria. E-mail: g.gescheidt-demner@tugraz.at
bIvoclar Vivadent AG, Bendererstrasse 2, 9494 Schaan, Liechtenstein
First published on 1st May 2018
Abstract
We have developed a simple method for determining the quantum yields of photo-induced reactions. Our setup features a fibre coupled UV-Vis spectrometer, LED irradiation sources, and a calibrated spectrophotometer for precise measurements of the LED photon flux. The initial slope in time-resolved absorbance profiles provides the quantum yield. We show the feasibility of our methodology for the kinetic analysis of photochemical reactions and quantum yield determination. The typical chemical actinometers, ferrioxalate and ortho-nitrobenzaldehyde, as well as riboflavin, a spiro-compound, phosphorus- and germanium-based photoinitiators for radical polymerizations and the frequently utilized photo-switch azobenzene serve as paradigms. The excellent agreement of our results with published data demonstrates the high potential of the proposed method as a convenient alternative to the time-consuming chemical actinometry.
Introduction
Photo-induced reactions have been attracting substantial attention for many years. Recent developments in photocatalysis,1–3 molecular switches,4,5 photo-polymer chemistry6–9 and click-chemistry10 have pushed the field of photo-induced reactions to new frontiers. For assessing the efficiency of such systems, it is crucial to determine the quantum yields of the involved reactions. The quantum yield Φ indicates the efficiency for the formation of a certain product in a chemical reaction.11,12 Nevertheless, the accurate and facile measurement of quantum yields can become complicated, costly and cumbersome. The state-of-the-art procedures are based on time-consuming chemical actinometry for photon flux determination and the use of separation techniques (chromatography) combined with spectroscopic methods.13–15 However, these established methods suffer from several shortcomings. Typically, the analysis of concentrated solutions is necessary, requiring large sample quantities. In addition, the investigated compounds may absorb different amounts of light during the reaction due to the absorbing photoproducts, which mask the starting materials (i.e. the “inner filter effect”12). Furthermore, quantitative analysis may require error prone dilution steps and long measurement times. Recently, alternative approaches for the determination of photo-dissociation quantum yields have been introduced, based on NMR techniques,16 laser-flash photolysis (LFP)17 and peak-height analysis of size exclusion chromatography (SEC) traces after pulsed-laser polymerization (PLP).18 However, the lack of a “standardized” procedure makes it difficult to compare the quantum-yield values obtained from different methods.In this article, we wish to extend the scope of a recently presented setup based on online UV-Vis monitoring of photochemical reactions,19,20 to determine photochemical-reaction quantum yields. Irradiation is performed using light emitting diodes (LEDs). LEDs represent cost-efficient and flexible light sources and are readily available at various wavelengths with narrow bandwidths (ca. 20 nm). The photon flux can be easily varied by adjusting the forward current. We present the use of a calibrated spectrophotometer for photon flux determination replacing time-consuming photon flux determination via chemical actinometry. Additionally, as a reference, we use ferrioxalate actinometry with online detection.20 We have evaluated our method by comparing the measured LED intensity values with the results of actinometric experiments using the standard actinometer ortho-nitrobenzaldehyde.21 We further illustrate the wide applicability of our procedure on the example of light-induced riboflavin degradation, photodissociation quantum yields of phosphorus-based and germanium-based radical photoinitiators (bisacylphosphane oxides and acylgermanes), as well as a kinetic study on a spirobenzopyran22 and the well-known azobenzene23 isomerization.
Experimental
Chemicals
O-Nitrobenzaldehyde (1), spirobenzopyran 6 (1′,3′,3′-trimethyl-6-nitrospiro[2H-1-benzopyran-2,2′-indoline]), aceto-nitrile (purity >99%), methyl methacrylate (MMA, purity >99%), azobenzene (7) and 0.1 M H2SO4 were purchased from Sigma Aldrich and used as received. Ferrioxalate trihydrate (2) was purchased from Alfa Aesar. Riboflavin (vitamin B2, 3) was obtained from Fluka. The bis(acyl)phosphane oxide (BAPO) photoinitiator Irgacure® 819 (4) was purchased from TCI. The bisacylgermane 5 was kindly provided by Ivoclar Vivadent (Schaan, Liechtenstein). Phosphate buffered saline tablets (Sigma Aldrich) were dissolved in deionized water.Instrumentation
Azobenzene solutions were pre-irradiated with a mercury-xenon lamp (Hamamatsu LC4, ca. 3500 mW cm−2) to achieve a high enrichment of the Z isomer.UV-Vis spectra were recorded on a UV-Vis spectrometer equipped with optical fibres and a 1024-pixel diode-array detector (J&M Analytik AG, Essingen, Germany). Standard fluorescence quartz cuvettes were used for all measurements. The power of the sample beam of the spectrometer was 0.08 mW, several orders of magnitude lower than the LEDs output that is typically between 5 and 50 mW.
Sample irradiation
We have modified the cuvette holder allowing sample illumination through an aperture (d = 0.9 cm) perpendicular to the spectrometer beam. The resulting optical paths are shown in Fig. 1. Accordingly, the path length is 1 cm for the irradiation and detection beam and independent of the fill height of the cuvette.19 It has to be justified that the LED light passing through the cuvette does not deteriorate the detection of the UV-Vis spectra.24 Nevertheless some scattered light may reach the detector. However, spectra usually show no distortion at the LED peak wavelength. Placing the sample holder on a magnetic stirrer provides homogeneous illumination of the entire solution and provides reproducible reaction conditions. This setup allows the measurement of the absorbance spectra in regular sampling intervals while simultaneously irradiating and stirring the sample. To assess possible intensity losses of the irradiation beam in the sample solution, we have performed a control experiment, with the detection fibre of the spectrometer mounted opposite to the LED. The light intensity was measured in the absence of the cuvette, with an empty cuvette and with a cuvette filled with acetonitrile (see Fig. S3†). The detectable light intensity drops slightly upon insertion of the empty cuvette (∼1%); however, the addition of acetonitrile increases the detected light intensity by 24%. This indicates that refraction at the glass/liquid interface occurs, leading to an essentially parallel light path.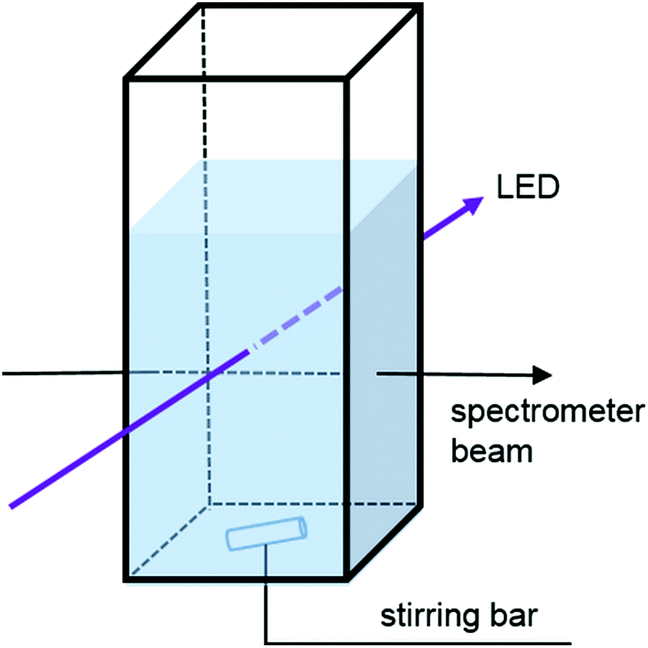 | ||
| Fig. 1 Schematic representation of the experimental setup for the online monitoring of photochemical reactions. The solution is irradiated with an LED (purple arrow) perpendicular to the UV-Vis spectrometer beam (black arrow). The sample is stirred to provide a homogeneous solution. | ||
The optical output power of the LEDs was measured using a calibrated spectrophotometer (GL Spectis 1.0, GL Optic Lichtmesstechnik GmbH, Weilheim, Germany) equipped with an integrating sphere. The LEDs were placed in front of the sphere aperture (diameter = 9 mm), resembling the geometry of the spectroscopic setup (see Fig. S2†). Low power LEDs (LED 385-33, XRL-400-5O, 420-01, 450-06 and 490-06) were purchased from Roithner LaserTechnik GmbH (Vienna, Austria). A detailed description and test-measurement of LEDs emitting at different wavelengths is presented in the ESI.† The LEDs were operated using a custom-made power source (Fig. S1†), which was calibrated with a high precision voltmeter.
Photochemical processes involving free radicals and triplet-excited states are likely to be sensitive to dissolved oxygen. Therefore, we removed oxygen by saturating the solution with argon (5 min) before the measurement. Measuring single absorbance spectra before and after bubbling with argon allows correction of solvent evaporation during the deoxygenation procedure (see eqn (S1) in the ESI†).
Theoretical background
The quantum yield is defined as the number of events (reactions) that occur per absorbed photon. The quantitative relationship mirroring the amount of absorbed light by a photo-induced process is given by the Beer–Lambert law12 (eqn (1)).| IAbs. = I0(1–10−A′) | (1) |
 | (2) |
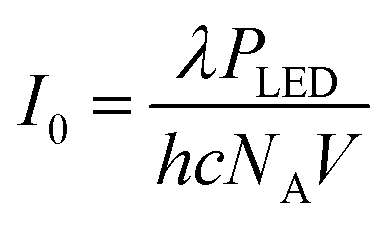
Here, λ is the peak wavelength of the LED (in m), h is Planck's constant (h = 6.63 × 10⁻³⁴ J s), c is the speed of light in a vacuum (c = 299![[thin space (1/6-em)]](https://www.rsc.org/images/entities/char_2009.gif) 792458 m s−1), NA is Avogadro's constant (NA = 6.02 × 10²³ mol−1) and V is the reaction volume (in L).
792458 m s−1), NA is Avogadro's constant (NA = 6.02 × 10²³ mol−1) and V is the reaction volume (in L).
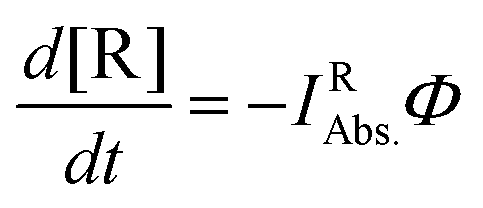
For the evaluation of the quantum yield, a connection between the absorbed light and the spectral changes based on the depletion of reactants must be established. The slope of the curve representing the time dependence of the absorbance is proportional to the amount of photons absorbed by the starting material (IRAbs. in mol L−1 s−1) multiplied by the quantum yield of the conversion (Φ). Hence, the time dependence reflecting the depletion of the reactant (d[R]/dt) in the photoreactor obeys eqn (3).
 | (3) |
The molar absorption coefficients of R (εR) and the photoproduct (εP) and the optical path length d relate [R] to the observed changes of the absorbance (A) at a certain wavelength:
 | (4) |
In the case of εR > εP, the absorbance curve decays, whereas when εR < εP, an increase in absorbance is observed.
Eqn (4) can be simplified by considering the following: at the initial point of the reaction, the absorbance is given by Ai = c0εRd, (c0 is the starting concentration of R, d = 1 cm). Accordingly, in the case of complete conversion, the residual absorbance (A∞) is attributed to the photoproduct (A∞ = c0εPd). Thus, multiplying eqn (4) with c0 yields eqn (5).
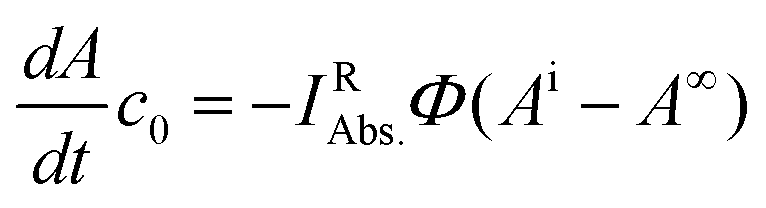 | (5) |
The next step is quantifying the absorbed light by the reactant IRAbs.. After the reaction has started, the photoproduct may also absorb a fraction of the LED light. Therefore, it is justified to use eqn (5) only at the initial phase of the reaction, where the light is exclusively absorbed by the parent species R (IRAbs. = IAbs.).
 | (6) |
Accordingly, IAbs. is readily accessible either from the UV-Vis spectrum of the parent substrate or can be simply computed using established molar absorption coefficients (Beer–Lambert law). The initial slope is obtained by fitting an appropriate function to the experimental data and using its derivative at t = 0.13 We found that in case of weakly absorbing solutions (A′ < 0.1), photoreactions virtually follow first order kinetics. Hence we use a mono-exponential function for data analysis. For strongly absorbing solutions (A′ > 2), a linear function (reaction is apparent zero order) may be appropriate. Here it is crucial to analyse the resulting residuals, to ensure that the experimental data are well represented by the applied function. Errors due to this approximation can be expected to be lower than 2%. A detailed theoretical discussion and experimental data are given in the ESI.† Fitting the data with a mono-exponential function and taking the derivative at t = 0, yields
 | (7) |
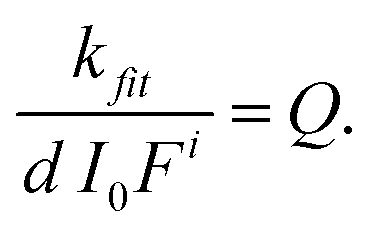
Combining eqn (6) and (7) eliminates the factor (Ai − A∞). Together with the Beer–Lambert law (eqn (1)) an easy-to-use expression follows, with the time constant kfit and the initial absorbance at the LED's peak wavelength A′i as parameters, leading to the quantum yield Φ of the photo-induced conversion.
 | (8) |
To obtain Φ with this method, the initial absorbance at the irradiation wavelength (A′i) and the concentration of the substrate is required. We measured A′i directly before starting the photo-induced reaction and calculated c0 from the concentrations of the stock solutions.
We investigated the scope and limitations of eqn (8) for the determination of quantum yields using various model compounds and reactions. The light-driven conversions range from intramolecular rearrangements over the reduction of metal–organic complexes, biologically relevant decompositions and photo-induced bond cleavage to “switching” reactions such as E–Z-isomerization. They are presented in the following section.
Results and discussion
ortho-Nitrobenzaldehyde (1) as a chemical actinometer
The conversion of o-nitrobenzaldehyde (1) to o-nitrosobenzoic acid (P1, see Fig. 2) was followed with online UV-Vis spectroscopy. Due to its absorbance in the UV region, solutions or crystals of compound 1 serve as an actinometric system for determining the intensity of UV light in different fields of photo-chemistry.13,25–27 The spectral changes of a degassed solution of 1 in acetonitrile (44 μM) upon irradiation with a 385 nm LED operated at 20 mA for 35 minutes are shown in Fig. 2. The absorbance at 223 nm decays, whereas new absorbance bands appear at 283 and 309 nm. The sharp isosbestic point and similar time profiles for the maxima at 223, 283 and 309 nm reveal that only 1 and P1 contribute to the spectra. Obviously, the molar absorption coefficient of 1 at the electronic absorbance maximum (223 nm) exceeds that of its photoproduct P1 (εR > εP). The absorbance decays exponentially (kfit = 0.013 s−1, see the inset in Fig. 2), whereas an increase is observed for the bands at 283 and 309 nm with irradiation time (εR < εP). However, as it is more intuitive, we chose to follow the reaction at 223 nm. | ||
| Fig. 2 Time-dependent spectral changes observed upon the illumination of 1 in acetonitrile. The inset shows absorbance–time curves monitored at 3 wavelengths (223 nm, 283 nm, and 309 nm). Sample details: 1.9 mL 44 μM 1 in acetonitrile, illumination with a 385 nm LED operated at 20 mA, time steps between each spectrum: 1 minute. The irradiation wavelength (385 nm) is indicated with a purple arrow. | ||
Ideally, the quantum yield Φ is independent of the LED light intensity. Higher light intensities (I0) increase kfit, thus leaving the quantum yield constant. Therefore, we repeated the experiment with different LED forward currents (5, 10, 15, 20, 25 and 30 mA) while leaving the concentration of 1 constant. In this case, Φ is determined from the slope of a plot according to eqn (8) (kfitc0vs. I0(1–10−A′i)) as depicted in Fig. 3. The inset shows the acceleration of the reaction as the light intensity increases due to higher forward currents (5 to 35 mA). Randomly distributed residuals (Fig. S10†) and R2 values >0.9998 demonstrate that the applied model is appropriate.
 | ||
| Fig. 3 Plot of the parameter kfit·c0vs. the denominator in eqn (8) for different solutions of 1 in acetonitrile. The inset shows the absorbance changes monitored at 233 nm that were used to obtain kfit. The letters a, b, c, d, e and f indicate LED forward currents 5, 10, 15, 20, 25 and 30 mA, respectively. The displayed error (± 0.02) results from the linear fit of 6 independent measurements. Residuals are shown in Fig. S10.† | ||
The slope in Fig. 3 yields a quantum yield of 0.43 ± 0.02, well in line with the reported values also obtained in acetonitrile (Φ = 0.43 ± 0.03).27 Control experiments referenced to ferrioxalate14,28 (compound 2, see the ESI†) virtually gave the same results. This underpins the validity of 0.43 instead of the previously reported value of 0.5 (ref. 29) in acetonitrile (see Table 1).
| Compound | LED/nm | λ/nm | Φ measured | Φ published |
|---|---|---|---|---|
| a Measured in argon-saturated solution, uncertainty was set to 10% of the obtained value. b Absorbance maximum of P6 in acetone, precise molar absorption coefficient not available. c Quantum yield for color formation (using 3.5 × 10⁴ and 5.2 × 10⁴ for εP6 (569 nm), respectively). d Relative value determined by laser flash photolysis. e Pseudototal quantum yield, for explanation see the text. f Literature value calculated from the reported quantum yields and extinction coefficients at 405 nm. | ||||
| 1 | 385 nm | 223 | 0.43 ± 0.02 | 0.4327–0.529 |
| 3 | 420 nm | 446 | 0.08 ± 0.008a | — |
| 4 | 385 nm | 370 | 0.60 ± 0.03 | 0.636,55 |
| 5 | 385 nm | 294 | 0.80 ± 0.04 | 0.8537 |
| 6 | 385 nm | 569b | ∼0.08–0.12c | 0.22d,56 |
| 7 | 400 nm | 436 | 464 ± 5e | 509f,53,54 |
In cases where a calibrated photometer is not available, the conversion of 1 or a concentrated solution of 2 can be used to determine the photon flux into the UV-Vis cuvette. A simple rearrangement of eqn (8) (see eqn (S8)†) and the use of Φ = 0.43 allows calculating the optical output power from the kinetic traces. As for the quantum yield measurement, each experiment gives a value for the applied LED intensity. Fig. S11† compares the results of the spectrophotometric with the actinometric measurements and the light intensities specified in the LED data sheets (11 mW at 20 mA). The intensities at all forward currents are in very good agreement. The above example demonstrates that this method is applicable for the conversion of 1 to P1, involving only one single reactant and photoproduct.
Photolysis of riboflavin (3)
As a more complex example, we have studied the photodecomposition of the biologically relevant compound riboflavin (vitamin B2, 3, structure shown in Fig. S18†). When exposed to light, riboflavin can decompose via several pathways that have been extensively studied.30,31 Kinetic studies revealed the role of singlet and triplet excited states, oxygen, pH, irradiation wavelength, light intensity and different buffer systems. However, these studies were usually based on high intensity irradiation of large sample quantities, e.g. with mercury vapour lamps and taking samples at regular intervals for separate steps for analysis.32,33 Therefore, the online monitoring of the photo-degradation offers the possibility of a straightforward screening of many different reaction conditions. As an example, we irradiated 8 μM aqueous riboflavin solutions (pH 7.4, 0.01 M phosphate buffer containing 0.0027 M potassium chloride and 0.137 sodium chloride) with a 420 nm LED. Spectral changes for aerobic conditions along with the decay of the absorbance at 446 nm are shown in Fig. 4. To assess the efficiency of degassing, we have bubbled the solutions with argon for 1, 2, 3, 4 and 5 min, respectively.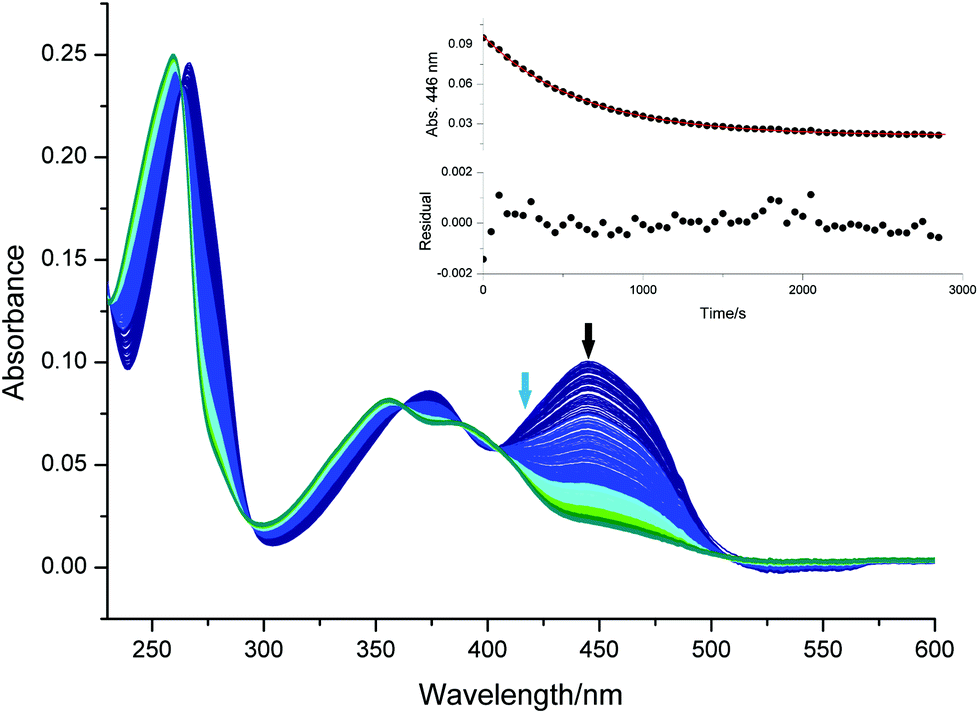 | ||
| Fig. 4 Irradiating 7.7 μM riboflavin (3) in 0.01 M phosphate buffer with a 420 nm LED. Each spectrum = 10 s. The insert shows the absorbance decay at 446 nm under aerobic conditions, together with a mono-exponential fit and the corresponding residuals used to determine the reaction rate and the quantum yield. | ||
The time traces for the degassed solutions (Fig. S19†) clearly show that the removal of oxygen accelerates the reaction drastically and the effect of degassing levels off after 3 min. Oxygen can quench singlet and triplet excited states and oxidize intermediates e.g. leucodeuteroflavin to formylmethylflavin that in turn forms lumichrome when exposed to irradiation. After the complete conversion (no further absorbance change), all solutions possess similar spectra that are well in line with the absorbance spectrum of lumichrome, the main photoproduct under these conditions.34 The kinetic curves of the degassed solutions are not well described by a single step photoreaction (see residuals in Fig. S19†), although the absorbance at the irradiation wavelength was adjusted to small values (∼0.07, see Table S5†). This may be due to the involvement of a short-lived intermediate in the formation of lumichrome as suggested by Remucal et al.35 Another interesting feature in Fig. 4 is the region with “negative” absorbance above 500 nm. This is due to the strong green fluorescence of riboflavin, reaching the detector. Switching the spectrometer beam off and repeating the experiment with the spectrometer in the emission mode allows one to record time resolved fluorescence spectra using a 385 nm LED light as the excitation source (see Fig. S20†). Fluorescence light may be reabsorbed by riboflavin and in turn lead to its decomposition. However, the photon flux and the absorbance of the solution in this spectral region (450–540 nm) are small compared to the excitation source (420 nm). Applying eqn (8) to the time trace obtained under anaerobic conditions yields an apparent quantum yield of 8% that is reduced to 0.4% in the aerobic solution.
Cleavage of photoinitiators (4 and 5)
In addition to the decomposition of riboflavin, we further indicate the scope of our methodology for extended systems involving several photoproducts. In this respect, photoinitiators for radical polymerizations are of high interest. Irradiation at a suitable wavelength cleaves the photoinitiator and the formed radical species may initiate polymerizations. The photoinitiator fragments usually possess less extended chromophores and therefore do not absorb in the visible or near UV region.This process known as “photobleaching” leads to the decay of UV-absorption bands of the parent compound upon irradiation. Applications like dental filling composites require photoinitiators that cleave efficiently even upon irradiation with moderate light intensities. The α-cleavage of the photoinitiator and the corresponding quantum yield of decomposition is, therefore, a key parameter for classifying the efficiency of such systems.17,36,37 As paradigms, we have investigated phosphorus- and germanium-based photoinitiators (4 and 5, Scheme 1) with respect to their decomposition quantum yields.7,9,36–41 Upon photocleavage, these initiators produce a benzoyl-type radical together with a phosphorus- or germanium-centered radical (Scheme 1). Both radicals add to the double bonds of monomers, initiating radical polymerizations.9,36,40–42 We have determined the quantum yields for the α-cleavage of 4 and 5 in acetonitrile with the monomer methyl methacrylate (MMA) (1/1 v/v ratio). The samples were prepared to achieve low absorbance at the irradiation wavelength (A385 < 0.1), and the photon flux of the 385 nm LED, operated at 20 mA into 3 mL of the solution was determined with three reference measurements with ferrioxalate (photon flux = (1.53 ± 0.03) × 10−5 mol L−1 s−1, Table S4†).
 | ||
| Scheme 1 Photoinduced α-cleavage of initiators 4 and 5 to produce a phosphanoyl or germyl radical (P˙ or G˙) and a benzoyl-type radical (B˙ or B′˙). | ||
Fig. 5 presents the UV-Vis spectra recorded upon the photolysis of bis(acyl)germane 5 at 385 nm. The kinetic trace shown in the inset of Fig. 5 is monitored at 294 nm (black arrow). Upon irradiation, this characteristic π–π* band decays. As described before, the parameter kfit is extracted by the exponential fitting of the absorbance/time traces obtained from three independent measurements (Table S7, Fig. S23†).
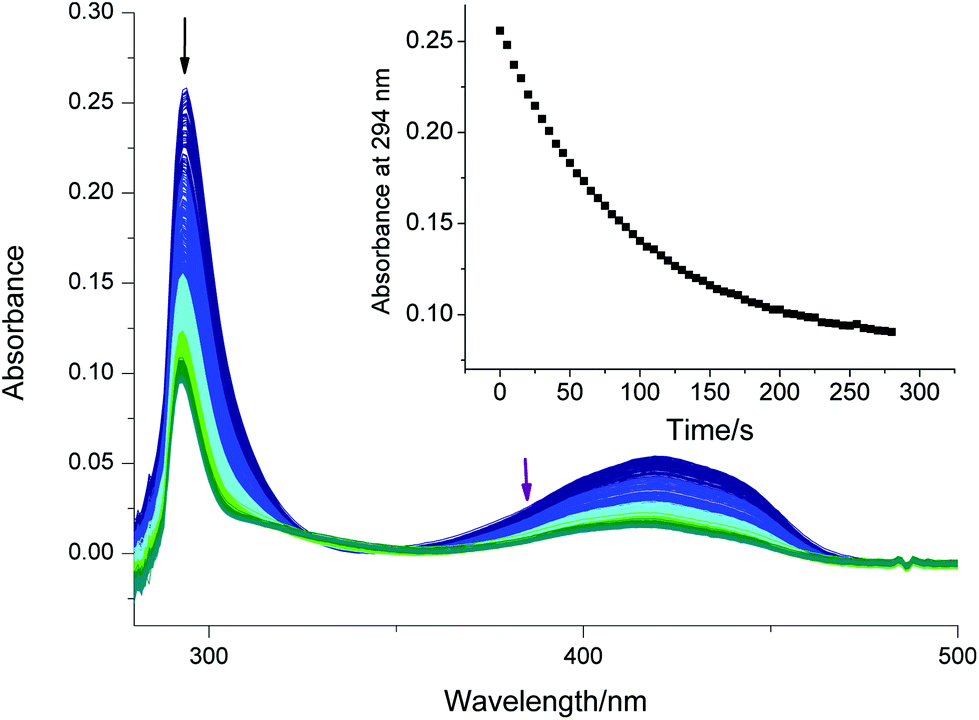 | ||
| Fig. 5 Spectral changes observed upon irradiation of 5 with 385 nm (purple arrow). Time steps between each spectrum: 0.5 s. The insert shows the decay of the absorbance at 294 nm (black arrow) vs. the irradiation time. (Sample: 3 mL of 0.17 mM 5 in acetonitrile/MMA (1/1 v/v), degassed by argon bubbling.) | ||
The corresponding data for compound 4, together with fitting residuals are presented in the ESI (Fig. S21, Fig. S22, Table S6†). The obtained dissociation quantum yields are in excellent agreement with previously published values and listed in Table 1. In accordance with the literature, bisacylgermane 5 exhibits a higher quantum yield for decomposition than the bisacylphosphane oxide 4.9,37,40
Color formation of a spirobenzopyran (6)
Up to this point, we applied our method to irreversible photo-induced reactions. However, it is also well suited for kinetic studies on more complex reversible systems, e.g. the formation of an intense colored isomer (color formation) of spirobenzopyrans upon exposure to UV light. Spirobenzopyran 6 (Fig. 6) undergoes a cascade of excited state reactions,22,43–45 eventually leading to the formation of an open form, P6 (Scheme shown in Fig. S25†). This intensely purple colored species exhibits an absorption maximum at 569 nm in acetone.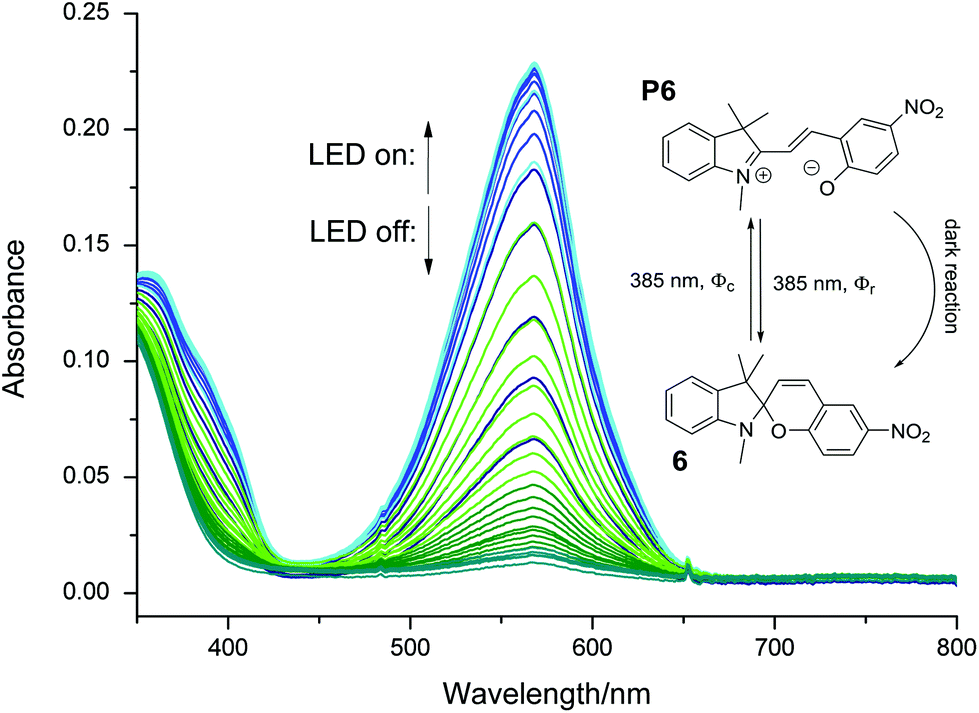 | ||
| Fig. 6 Color formation of 6 in acetone under irradiation with UV light (385 nm). One spectrum = 20 s. The insert shows structure and the three reactions linking 6 with P6. The corresponding time profile of the absorbance at 569 nm is shown in Fig. S24.† | ||
Viewed at a slow timescale, the system can be described by two components (6 and P6) that are linked by three reactions:46 two photo-isomerizations interconverting 6 and P6, characterized by the quantum yields Φc and Φr. An additional first order, dark-reaction, described by kr, regenerates 6. Fig. 6 displays the spectral changes of a 12 μM solution of 6 in acetone (argon-saturated) irradiated with a 385 nm LED.
Upon irradiation, the absorbance at 569 nm increases, until an equilibrium between the color formation and the thermal back reaction is established (i.e. photostationary state, PSS, see Fig. S24†). Stopping the irradiation results in a recovery of 6 with the rate constant kr.
It is useful to evaluate different PSSs reached with different light intensities, i.e. LED forward currents. Fig. 7 shows the spectra of different PSSs established by irradiating the sample with varying intensities. At low photon fluxes, the absorbance at 569 nm in the PSS follows the light intensity linearly; for higher optical powers, we observe saturation behavior. In the linear region, the photochemical reverse reaction is negligible, since kr (= 8.2 × 10⁻³ s−1) exceeds the photochemical back reaction (I0 = 8.8 × 10⁻⁷ mol L−1 s−1). In principle, data from a photostationary state in this linear region can be used to determine the quantum yield of color formation Φc. However, due to the lack of a precise molar absorption coefficient of P6 at 569 nm, this value should be taken as an estimate. Taking data from the PSS reached with the lowest light intensity (denoted as “a” in Fig. 7), the quantum yield ranges from 12% to 8% using the published values of 3.5 × 10⁴ and 5.2 × 10⁴ L mol−1 cm−1 for the molar absorption coefficient εP5 (569 nm),44 respectively.
 | ||
| Fig. 7 UV-Vis spectra of different photostationary states of 6 in acetone reached by LED forward currents of 1, 2, 3, 4, 5, 10, 15, 20 and 25 mA (a, b, c, etc.). The spectra were recorded while the LED was on. The insert correlates the forward voltage with the absorbance in the PSS at 569 nm. | ||
Isomerization of azobenzene (7)
As an example of a molecular photo-switch, we have investigated the photochemical E/Z-isomerization of azobenzene (7). In contrast to compound 6, the thermal reaction rate of 7 is extremely slow at room temperature, making compound 7 an archetype of a light-driven photo-switch. Its characteristic behavior has been exploited in numerous applications23,47–49 and the photochemical properties have been studied extensively.50–52Upon irradiation at low wavelengths (<360 nm), an excess of the Z-isomer (Z-7) is formed. Irradiation of the n–π* band leads to the regeneration of E-7. Very recently, the molar absorption coefficients and photo-isomerization quantum yields in methanol have been re-determined and reviewed.53,54 Here we examine the conversion of a pre-irradiated solution containing predominantly Z-7 with a 400 nm LED in a kinetic approach. In the case of azobenzene, the change in absorbance dA/dt induced by the continuous irradiation I0 is given by:50
 | (9) |
The “pseudo total quantum yield” (Q) is independent of the light intensity and concentration and the current isomer ratio (defined as Q = εZΦZ + εEΦE), d is the path length of irradiation (d = 1 cm) and F is the photokinetic factor (F = (1 − 10−A′)/A′) with A′ being the absorbance at the irradiation wavelength. When a PSS is reached, the absorbance is constant and hence, A = A∞. Again, the data are analyzed at the very beginning of the reaction. Using the same methodology as above (eqn (7)), the following expression is obtained:
 | (10) |
An excess of Z-7 was formed by irradiating the cuvette with a high intensity mercury-UV-lamp for 60 s. The cuvette was allowed to cool, and was irradiated with a 400 nm LED while the absorbance at 436 nm was monitored. The experiment was repeated three times with fresh solutions. UV-Vis spectra and the corresponding time trace are shown in Fig. 8. The photon flux of the LED was measured three times with ferrioxalate (see Table S8†) yielding a photon flux of (2.11 ± 0.06) × 10−5 mol L−1 s−1. We evaluated the factor Fi by measuring single absorbance spectra before the kinetic experiment (n = 3, A′i ∼ 0.08). Using this photon flux, these three measurements yield a pseudo total quantum yield of 464 ± 6, lower (9%) than the reported value for 405 nm (Q = 509 (ref. 53 and 54) see Table 1). However, lower molar absorption coefficients of both isomers at 400 nm compared with 405 nm can account for this difference. Since the LED emits light in a wavelength range (FWHM = 13 nm), this value is an average in the region around 400 nm.
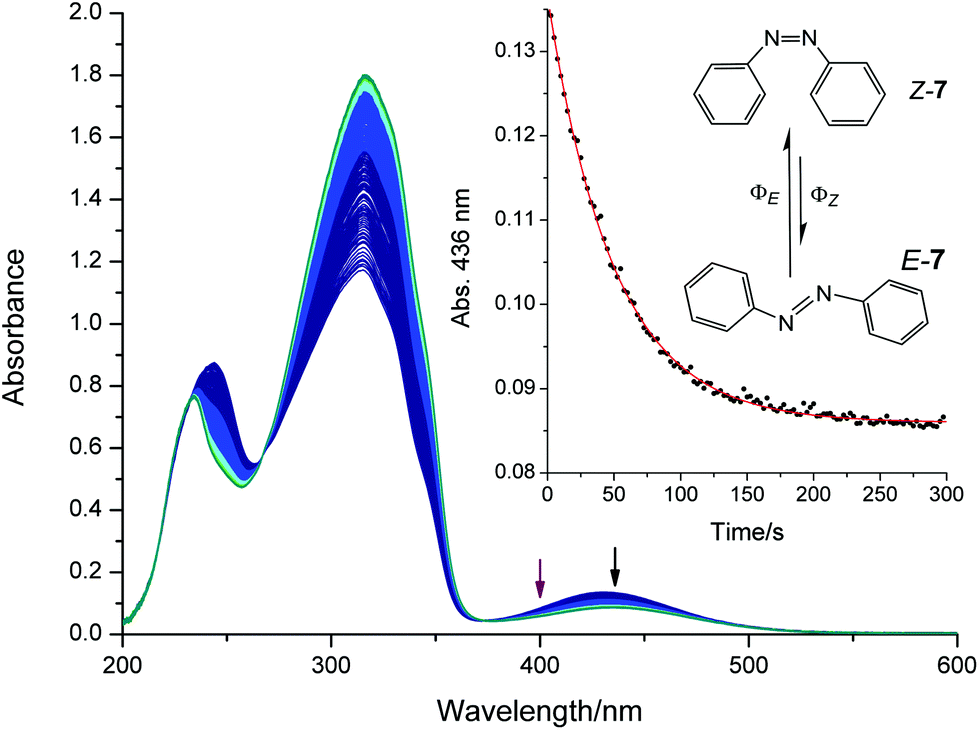 | ||
| Fig. 8 UV-Vis spectra showing the isomerization of a 0.12 mM solution of E/Z-7 in methanol to the thermodynamically more stable E-7 upon irradiation with a 400 nm LED (purple arrow). The insert shows the exponentially fitted traces (solid line) of the absorbance at 436 nm (black arrow). Single spectrum = 0.5 s, overall time = 280 s. | ||
Conclusions
In this article, we present a versatile approach for the straightforward determination of quantum yields of photo-induced reactions. Our experimental setup features a simple modification of a cuvette holder used with a fibre coupled diode array spectrometer. This allows online monitoring of spectral changes induced upon photoreactions.19 Weakly absorbing solutions (<0.1 at the irradiation wavelength) follow apparent first order kinetics in good approximation. We have shown that for these cases, a simple relationship between the initial slope, the absorbed LED light and the quantum yield can be established and used to calculate the quantum yield for the observed process. This approximation offers the advantage that neither kinetic modeling nor numeric solving of differential equations is required.54Using ferrioxalate with online detection as a reference, we could reproduce quantum yields of several model systems. Our method utilizes cost-efficient low power LEDs for irradiation, and requires low amounts of sample, while allowing quick determination of quantum yields of photochemical reactions. We could demonstrate that the photon flow can be measured with a spectrophotometer or using the conversion of nitrobenzaldehyde in acetonitrile and ferrioxalate combined with online spectrophotometric detection. Our method is feasible for the light-induced decomposition of riboflavin, two widely used phosphorus- and germanium-based photoinitiators. It is furthermore suitable for studying complex reaction kinetics like the photo-isomerization of a spirobenzopyran and photo-switches like azobenzene. Small required sample amounts, simple analysis and short conversion times make this technique ideally suited to evaluate photocatalyzed reactions. We are currently exploring the scope of the method for further photochemical systems like light-driven spin switches.
Conflicts of interest
There are no conflicts to declare.Acknowledgements
The authors thank NAWI Graz and Ivoclar Vivadent AG for financial support.Notes and references
- J. Kou, C. Lu, J. Wang, Y. Chen, Z. Xu and R. S. Varma, Selectivity Enhancement in Heterogeneous Photocatalytic Transformations, Chem. Rev., 2017, 117, 1445–1514 CrossRef CAS PubMed.
- X. Li, J. Yu and M. Jaroniec, Hierarchical photocatalysts, Chem. Soc. Rev., 2016, 45, 2603–2636 RSC.
- K. Wenderich and G. Mul, Methods, Mechanism, and Applications of Photodeposition in Photocatalysis: A Review, Chem. Rev., 2016, 116, 14587–14619 CrossRef CAS PubMed.
- M. M. Lerch, M. J. Hansen, W. A. Velema, W. Szymanski and B. L. Feringa, Orthogonal photoswitching in a multifunctional molecular system, Nat. Commun., 2016, 7, 12054 CrossRef CAS PubMed.
- M. M. Lerch, S. J. Wezenberg, W. Szymanski and B. L. Feringa, Unraveling the Photoswitching Mechanism in Donor–Acceptor Stenhouse Adducts, J. Am. Chem. Soc., 2016, 138, 6344–6347 CrossRef CAS PubMed.
- J.-F. Xing, M.-L. Zheng and X.-M. Duan, Two-photon polymerization microfabrication of hydrogels: an advanced 3D printing technology for tissue engineering and drug delivery, Chem. Soc. Rev., 2015, 44, 5031–5039 RSC.
- J. Wang, G. Siqueira, G. Müller, D. Rentsch, A. Huch, P. Tingaut, J. Levalois-Grützmacher and H. Grützmacher, Synthesis of new bis(acyl)phosphane oxide photoinitiators for the surface functionalization of cellulose nanocrystals, Chem. Commun., 2016, 52, 2823–2826 RSC.
- M. Tromayer, P. Gruber, M. Markovic, A. Rosspeintner, E. Vauthey, H. Redl, A. Ovsianikov and R. Liska, A biocompatible macromolecular two-photon initiator based on hyaluronan, Polym. Chem., 2017, 8, 451–460 RSC.
- J. Radebner, A. Eibel, M. Leypold, C. Gorsche, L. Schuh, R. Fischer, A. Torvisco, D. Neshchadin, R. Geier, N. Moszner, R. Liska, G. Gescheidt, M. Haas and H. Stueger, Tetraacylgermanes: Highly Efficient Photoinitiators for Visible-Light-Induced Free-Radical Polymerization, Angew. Chem., Int. Ed., 2017, 56, 3103–3107 CrossRef CAS PubMed.
- N. Corrigan, S. Shanmugam, J. Xu and C. Boyer, Photocatalysis in organic and polymer synthesis, Chem. Soc. Rev., 2016, 45, 6165–6212 RSC.
- A. D. McNaught and A. Wilkinson, in IUPAC Compendium of Chemical Terminology, IUPAC, Research Triangle Park, NC, 1997 Search PubMed.
- S. E. Braslavsky, Glossary of terms used in photochemistry, 3rd edition (IUPAC Recommendations 2006), Pure Appl. Chem., 2007, 79, 293–465.
- K. L. Willett and R. A. Hites, Chemical Actinometry: Using o-Nitrobenzaldehyde to Measure Lamp Intensity in Photochemical Experiments, J. Chem. Educ., 2000, 77, 900 CrossRef CAS.
- H. J. Kuhn, S. E. Braslavsky and R. Schmidt, Chemical actinometry (IUPAC Technical Report), Pure Appl. Chem., 2004, 76, 2105–2146 CrossRef CAS.
- M. Montalti, A. Credi, L. Prodi and M. Teresa Gandolfi, Handbook of Photochemistry, 3rd edn, 2006 Search PubMed.
- N. D. Dolinski, Z. A. Page, F. Eisenreich, J. Niu, S. Hecht, J. Read de Alaniz and C. J. Hawker, A Versatile Approach for In Situ Monitoring of Photoswitches and Photopolymerizations, ChemPhotoChem, 2017, 1, 125–131 CrossRef CAS.
- J. Lalevée, X. Allonas and J. P. Fouassier, Acylgermanes: Excited state processes and reactivity, Chem. Phys. Lett., 2009, 469, 298–303 CrossRef.
- Y. W. Marien, P. H. M. Van Steenberge, K. B. Kockler, C. Barner-Kowollik, M.-F. Reyniers, G. B. Marin and D. R. D′hooge, Estimating the photodissociation quantum yield from PLP-SEC peak heights, Polym. Chem., 2017, 8, 3124–3128 RSC.
- M. Gombár, É. Józsa, M. Braun and K. Ősz, Construction of a photochemical reactor combining a CCD spectrophotometer and a LED radiation source, Photochem. Photobiol. Sci., 2012, 11, 1592 Search PubMed.
- T. Lehóczki, É. Józsa and K. Osz, Ferrioxalate actinometry with online spectrophotometric detection, J. Photochem. Photobiol., A, 2013, 251, 63–68 CrossRef.
- R. Smith and K. Cantrell, Modeling the Effect of Polychromatic Light in Quantitative Absorbance Spectroscopy, J. Chem. Educ., 2007, 84, 1021 CrossRef CAS.
- H. Görner, Photochromism of nitrospiropyrans: effects of structure, solvent and temperature, Phys. Chem. Chem. Phys., 2001, 3, 416–423 RSC.
- H. M. D. Bandara and S. C. Burdette, Photoisomerization in different classes of azobenzene, Chem. Soc. Rev., 2012, 41, 1809–1825 RSC.
- T. Ditrói, J. Kalmár, J. A. Pino-Chamorro, Z. Erdei, G. Lente and I. Fábián, Construction of a multipurpose photochemical reactor with on-line spectrophotometric detection, Photochem. Photobiol. Sci., 2016, 15, 589–594 Search PubMed.
- H. J. Kuhn, S. E. Braslavsky and R. Schmidt, Chemical actinometry (IUPAC Technical Report), Pure Appl. Chem., 2004, 76, 2105–2146 CrossRef CAS.
- N. De la Cruz, V. Romero, R. F. Dantas, P. Marco, B. Bayarri, J. Giménez and S. Esplugas, o-Nitrobenzaldehyde actinometry in the presence of suspended TiO2 for photocatalytic reactors, Catal. Today, 2013, 209, 209–214 CrossRef CAS.
- E. S. Galbavy, K. Ram and C. Anastasio, 2-Nitrobenzaldehyde as a chemical actinometer for solution and ice photochemistry, J. Photochem. Photobiol., A, 2010, 209, 186–192 CrossRef CAS.
- C. G. Hatchard and C. A. Parker, A New Sensitive Chemical Actinometer. II. Potassium Ferrioxalate as a Standard Chemical Actinometer, Proc. R. Soc. A, 1956, 235, 518–536 CrossRef CAS.
- M. V. George and J. C. Scaiano, Photochemistry of o-nitrobenzaldehyde and related studies, J. Phys. Chem., 1980, 84, 492–495 CrossRef CAS.
- I. Ahmad and F. H. M. Vaid, in Comprehensive Series in Photochemical & Photobiological Sciences, 2006, vol. 6, pp. 13–40 Search PubMed.
- M. A. Sheraz, S. H. Kazi, S. Ahmed, Z. Anwar and I. Ahmad, Photo, thermal and chemical degradation of riboflavin, Beilstein J. Org. Chem., 2014, 10, 1999–2012 CrossRef PubMed.
- I. Ahmad and H. D. C. Rapson, Multicomponent spectrophotometric assay of riboflavine and photoproducts, J. Pharm. Biomed. Anal., 1990, 8, 217–223 CrossRef CAS PubMed.
- M. A. Sheraz, S. H. Kazi, S. Ahmed, T. Mirza, I. Ahmad and M. P. Evstigneev, Effect of phosphate buffer on the complexation and photochemical interaction of riboflavin and caffeine in aqueous solution: A kinetic study, J. Photochem. Photobiol., A, 2014, 273, 17–22 CrossRef CAS.
- I. Ahmad, Q. Fasihullah, A. Noor, I. A. Ansari and Q. N. M. Ali, Photolysis of riboflavin in aqueous solution: a kinetic study, Int. J. Pharm., 2004, 280, 199–208 CrossRef CAS PubMed.
- C. K. Remucal and K. McNeill, Photosensitized Amino Acid Degradation in the Presence of Riboflavin and Its Derivatives, Environ. Sci. Technol., 2011, 45, 5230–5237 CrossRef CAS PubMed.
- S. Jockusch and N. J. Turro, Phosphinoyl radicals: Structure and reactivity. A laser flash photolysis and time-resolved ESR investigation, J. Am. Chem. Soc., 1998, 120, 11773–11777 CrossRef CAS.
- B. Ganster, U. K. Fischer, N. Moszner and R. Liska, New Photocleavable Structures. Diacylgermane-Based Photoinitiators for Visible Light Curing, Macromolecules, 2008, 41, 2394–2400 CrossRef CAS.
- K. Dietliker, T. Jung, J. Benkhoff, H. Kura, A. Matsumoto, H. Oka, D. Hristova, G. Gescheidt and G. Rist, New developments in photoinitiators, Macromol. Symp., 2004, 217, 77–97 CrossRef CAS.
- N. Moszner, F. Zeuner, I. Lamparth and U. K. Fischer, Benzoylgermanium derivatives as novel visible-light photoinitiators for dental composites, Macromol. Mater. Eng., 2009, 294, 877–886 CrossRef CAS.
- D. Neshchadin, A. Rosspeintner, M. Griesser, B. Lang, S. Mosquera-Vazquez, E. Vauthey, V. Gorelik, R. Liska, C. Hametner, B. Ganster, R. Saf, N. Moszner and G. Gescheidt, Acylgermanes: Photoinitiators and sources for Ge-centered radicals. insights into their reactivity, J. Am. Chem. Soc., 2013, 135, 17314–17321 CrossRef CAS PubMed.
- A. Eibel, M. Schmallegger, M. Zalibera, A. Huber, Y. Bürkl, H. Grützmacher and G. Gescheidt, Extending the Scope of Bis(acyl)phosphane Oxides: Additional Derivatives, Eur. J. Inorg. Chem., 2017, 2017, 2469–2478 CrossRef CAS.
- J. Radebner, M. Leypold, A. Eibel, J. Maier, L. Schuh, A. Torvisco, R. Fischer, N. Moszner, G. Gescheidt, H. Stueger and M. Haas, Synthesis, Spectroscopic Behavior, and Photoinduced Reactivity of Tetraacylgermanes, Organometallics, 2017, 36, 3624–3632 CrossRef CAS.
- A. K. Chibisov and H. Görner, Complexes of spiropyran-derived merocyanines with metal ions: relaxation kinetics, photochemistry and solvent effects, Chem. Phys., 1998, 237, 425–442 CrossRef CAS.
- A. K. Chibisov and H. Görner, Photoprocesses in Spiropyran-Derived Merocyanines, J. Phys. Chem. A, 1997, 101, 4305–4312 CrossRef CAS.
- H. Görner, Photoprocesses in spiropyrans and their merocyanine isomers: Effects of temperature and viscosity, Chem. Phys., 1997, 222, 315–329 CrossRef.
- V. Pimienta, D. Lavabre, G. Levy, A. Samat, R. Guglielmetti and J. C. Micheau, Kinetic Analysis of Photochromic Systems under Continuous Irradiation. Application to Spiropyrans, J. Phys. Chem., 1996, 100, 4485–4490 CrossRef CAS.
- S. Venkataramani, U. Jana, M. Dommaschk, F. D. Sönnichsen, F. Tuczek and R. Herges, Magnetic bistability of molecules in homogeneous solution at room temperature, Science, 2011, 331, 445–448 CrossRef CAS PubMed.
- J. Kind, L. Kaltschnee, M. Leyendecker and C. M. Thiele, Distinction of trans–cis photoisomers with comparable optical properties in multiple-state photochromic systems – examining a molecule with three azobenzenes via in situ irradiation NMR spectroscopy, Chem. Commun., 2016, 52, 12506–12509 RSC.
- C. Slavov, C. Yang, L. Schweighauser, C. Boumrifak, A. Dreuw, H. A. Wegner and J. Wachtveitl, Connectivity matters - ultrafast isomerization dynamics of bisazobenzene photoswitches, Phys. Chem. Chem. Phys., 2016, 18, 14795–14804 RSC.
- G. Gauglitz, Azobenzene as a convenient actinometer for the determination of quantum yields of photoreactions, J. Photochem., 1976, 5, 41–47 CrossRef CAS.
- G. Zimmerman, U. Paik and L.-Y. Chow, The Photochemical Isomerization of Azobenzene, J. Am. Chem. Soc., 1958, 80, 3528–3531 CrossRef CAS.
- G. Gauglitz and S. Hubig, Chemical actinometry in the UV by azobenzene in concentrated solution: A convenient method, J. Photochem., 1985, 30, 121–125 CrossRef CAS.
- Ľ. Vetráková, V. Ladányi, J. Al Anshori, P. Dvořák, J. Wirz and D. Heger, The absorption spectrum of cis -azobenzene, Photochem. Photobiol. Sci., 2017, 16, 1749–1756 Search PubMed.
- V. Ladányi, P. Dvořák, J. Al Anshori, Ľ. Vetráková, J. Wirz and D. Heger, Azobenzene photoisomerization quantum yields in methanol redetermined, Photochem. Photobiol. Sci., 2017, 16, 1757–1761 Search PubMed.
- S. Jockusch, I. V. Koptyug, P. F. McGarry, G. W. Sluggett, N. J. Turro and D. M. Watkins, A steady-state and picosecond pump-probe investigation of the photophysics of an acyl and a Bis(acyl)phosphine oxide, J. Am. Chem. Soc., 1997, 119, 11495–11501 CrossRef CAS.
- H. Görner, Photochemical ring opening in nitrospiropyrans: triplet pathway and the role of singlet molecular oxygen, Chem. Phys. Lett., 1998, 288, 589 CrossRef.
Footnote |
| † Electronic supplementary information (ESI) available. See DOI: 10.1039/c7pp00401j |
| This journal is © The Royal Society of Chemistry and Owner Societies 2018 |