Multivalent aptamer-modified tetrahedral DNA nanocage demonstrates high selectivity and safety for anti-tumor therapy†
Xiu
Han‡
a,
Yujie
Jiang‡
a,
Shuyi
Li
a,
Yu
Zhang
a,
Xiaonan
Ma
b,
Ziheng
Wu
c,
Zhenghong
Wu
*a and
Xiaole
Qi
 *a
*a
aKey Laboratory of Modern Chinese Medicines, China Pharmaceutical University, Nanjing 210009, PR China. E-mail: zhenghongwu66@cpu.edu.cn; qixiaole523@cpu.edu.cn
bCellular and Molecular Biology Center, China Pharmaceutical University, Nanjing 210009, PR China
cJiangning Campus, High School Affiliated to Nanjing Normal University, Nanjing 211102, PR China
First published on 28th November 2018
Abstract
The fabrication of aptamers on DNA nanostructures through the DNA origami method has shown great potential for in vitro and in vivo tumor targeting delivery. Herein, tetrahedral multivalent DNA (Td) nanocages modified with different numbers of MUC1-aptamers (nApt-Td) were obtained via the self-assembly of nucleic acid backbones containing the aptamer DNA fragment without complicated chemical modification steps. Then, doxorubicin (DOX) was encapsulated in the modified nApt-Td nanocages via non-covalent interactions. Due to the specific identification of the aptamers, the intracellular uptake studies demonstrated that the multivalent modified aptamers on the vertex of Td significantly enhanced the intracellular uptake efficiency in MCF-7 tumor cells, but reduce that of normal cells. The number of aptamers had a significant influence on the intracellular uptake efficiency of Td nApt-Td. Furthermore, improved in vivo systemic safety and decreased systemic toxicity accompanied with effective tumor inhibition were also demonstrated compared with the anti-tumor efficiency of free DOX.
Introduction
Utilizing endogenous biomolecular-based nanostructures to encapsulate exogenous drugs or connect tracer molecules for in vivo therapy and diagnosis is highly attractive due to their unmatched biocompatibility.1–5 Currently, modular assemblies of DNA polyhedron nanostructures, such as cubes, octahedra, tetrahedra, and icosahedra, have been demonstrated as potential candidates for the encapsulation of proteins, antibodies and gold nanoparticles in diagnostic and therapeutically applications.6–13 Among them, tetrahedral DNA nanocages (Td) have shown unprecedented advantages, such as well-defined structure, high capacity of drug loading, excellent intracellular uptake capability and structural stability.14–18 However, the in vivo delivery of drug molecules through these nanostructures is challenging, especially considering the targeting selectivity and triggered drug releasing ability. Thus, increasing researchers have focused on the functional decoration and reconstruction of Td to expand the application of Td for efficient targeted delivery and in vivo imaging.Aptamers, which are a type of short single-stranded oligo-nucleic acid19,20 (DNA or RNA) or peptide molecule that folds into secondary or tertiary structures, are well recognized as a useful tool for binding target molecules due to their good specificity and high affinity.19–22 As tumor-targeting ligands, aptamers have certain superiorities compared with antibodies, such as low immunogenicity and high binding specificity. Using the systematic evolution of ligands with exponential enrichment (SELEX) approach,23,24 selected aptamers showed high affinity to specific targets such as proteins, peptides, and even entire cells.
However, most aptamers are inclined to degradation in vivo by nuclease, do not directly penetrate cells and require complex chemical modification for linking other drugs or carriers.25 Obviously, the precise modification of aptamers on either the vertex or the side chain of Td can be achieved through the design of the nucleic acid backbone sequence without the chemical bonding. On the other hand, the regular Td structure with potential stability can protect other nucleic acid molecules connected to it. Although modification of aptamers on Td nanocages was verified to enhance their targeting efficiency in vitro,26,27 there are no studies focusing on the different in vivo targeting behaviours and therapeutic safety among Td modified with different numbers of aptamers.
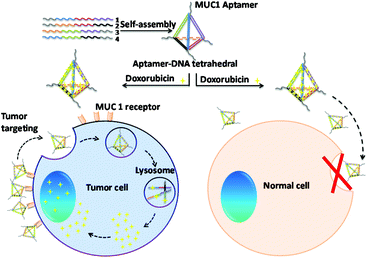
In this study, we designed a novel MUC1-apt multivalent modified self-assembled DNA nanocage targeted drug delivery system using MUC1-apt and Td, which consisted of four single-stranded oligo-nucleic acids.28,29 MUC1 is widely over-expressed in breast cancer cell and millions of women suffer from breast cancer annually, which makes breast tumors the most common malignancy in women.30,31 As shown in Fig. 1, we connected MUC1-apts and four oligo-nucleic acids via seven thymines as space linkers to retain the space structure of both the oligo-nucleic acids and MUC1 aptamer. In this study, Td with vertex modification of different numbers of aptamers (nApt-Td) could be self-assembled via the principle of complementary base pairing. A Td molecule can load many Dox molecules within its DNA strands due to the presence of flat aromatic rings in the DOX molecule.32 After been recognized by MUC1 on MUC1-positive cancer cells, the nApt-Td can enter the tumor cells through endocytosis, and disintegration of the nanostructure of Td occurs in the lysosome to release DOX. Through the intracellular uptake studies on Td modified with different numbers of MUC1-apt (1–3), we found that the multivalent modification of MUC1-apt on the vertex of nApt-Td significantly reduced the intracellular uptake efficiency of normal cells. Furthermore, improved systemic safety and descended systemic toxicity were also demonstrated in vivo compared with the anti-tumor efficiency of free DOX. The basic properties of the complex and its efficacy ability as a targeted drug delivery system were evaluated in vitro using the MCF-7 breast cancer cell line and LO2 normal cells as positive and negative groups, respectively. Furthermore, we also investigated the bio-distribution and tumor inhibition of the complex in MCF-7 breast cancer tumor-bearing nude mice.
Results and discussion
Preparation of Td, apt-Td, 2apt-Td, and 3apt-Td
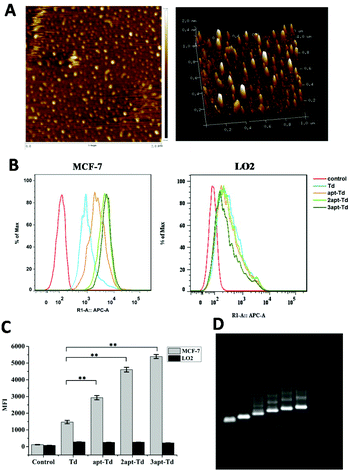
The tetrahedral DNA nanostructure was assembled with four 62-mer or 94-mer strands. Here, we conjugated the MUC1 aptamer to every single strand using a space linker. The successful construction of the self-assembled DNA tetrahedron was verified using 2% agarose gel electrophoresis (AGE) (Fig. 2D). From left to right, the DNA structures are AB, ABC, ABCD (Td), AB′CD (apt-Td), A′B′CD (2apt-Td), and A′B′C′D (3apt-Td). The lines were very clear, which indicated that the yield of DNA nanostructures was high. Moreover, the nanostructure of the DNA tetrahedron was also characterized via AFM. As shown in Fig. 2A, the tetrahedron in the dried state was about 2–3 nm in height. Thus the results of both AGE and AFM confirmed the successful fabrication of Td.In vitro stability of 3apt-Td
Previous studies have proven that Td is stable against nuclease degradation in biological media. Thus, to access the stability of the DNA tetrahedral nanostructures, we incubated either 3apt-Td or complete complementary DNA duplexes (strand D + d) of the same concentration (250 nM) in 10% non-heat inactivated fetal bovine serum (FBS), 100% non-heat inactivated FBS and 100% murine plasma, respectively. Non-denaturing polyacrylamide gel (6%) electrophoretic (PAGE) and agarose gel (2%) electrophoresis (AGE) analysis showed that the band of the 3apt-Td remained almost unchanged after 2 h incubation, reflecting the presence of the intact tetrahedral nanostructure in FBS (Fig. S1†). After extended incubation, smearing bands appeared, suggesting that there was partial degradation of the nanostructure. In contrast, the DNA duplex was nearly completely degraded after only 2 h incubation. The results indicated that the regular 3apt-Td has satisfactory serum stability as a potential nanocarrier, and can protect other nucleic acid molecules attached to it.In vitro cell uptake study of Td, apt-Td, 2apt-Td, and 3apt-Td
The aptamer adopted in this study has been reported to bind to MUC1 with high affinity. Thus, to test whether the Td nanostructures bearing different numbers of MUC1-aptamers could indeed distinguish MUC1-positive cells from the MUC1-negative normal cells, the uptake efficiency of napt-Td in two types of cells was evaluated by flow cytometry. Firstly, Fig. S2A† verified that the MUC1 aptamers conjugated on the strand of Td could indeed bind to the MUC1 peptide via a gel-shift assay. As shown in Fig. S2B and C,† we verified that the level of MUC1 expression on MCF-7 cells was higher than that on LO2 cells via flow cytometry analysis of the specific binding of the fluorescently-labelled MUC1 aptamer. In addition, the MCF-7 and LO2 co-culture experiment (Fig. S3†) successfully demonstrated the specific targeting of the aptamer-bound Td strand to MCF-7 tumor cells but not to LO2 off-target cells.Then, we employed Td, apt-Td, 2apt-Td, and 3apt-Td, each labelled with Cy5 at the end of strand D, for incubation with MCF-7 and LO2 separately. The amount of delivered nanostructures was estimated by the fluorescence intensity of the Cy5 label. As shown in Fig. 2B and C, compared with the aptamer-free Td, the fluorescence intensity of apt-Td, 2apt-Td and 3apt-Td was significantly higher after incubation for 5 h with MCF-7 cells. In addition, the more aptamers the Td bore, the higher the mean fluorescence intensity (MFI) observed. In contrast, when treated with LO2 cells, the MFI was reduced significantly compared to that of MCF-7 cells. These flow cytometry results suggested the successful targeting effect of napt-Td, which was relative to the number of aptamers modified on the vertex of Td. This may be caused by the presence of MUC1-apts, which can be recognized and undergo receptor-mediated endocytosis by the MUC1 protein on the surface of MCF-7 cells. These results verified our hypothesis that the multivalent modification of the MUC1 aptamer would increase the uptake of Td in tumor cells rather than the uptake of normal cells. Thus, this high in vitro selectivity of napt-Td to tumor cells will result in safety for in vivo anti-tumor treatment. Moreover, the specific internalization of napt-Td was also confirmed by confocal laser scanning microscopy to rule out the possibility that Td, apt-Td, 2apt-Td, and 3apt-Td were not simply accumulated on the cell surface. As shown in Fig. 3, the merged fluorescence intensity was significantly strengthened when the number of aptamers was increased, but no significant difference could be observed in the LO2 cells.
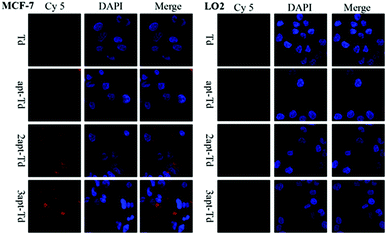 | ||
| Fig. 3 Cellular uptake of Td, apt-Td, 2apt-Td, and 3apt-Td in MCF-7 and LO2 cells after 5 h incubation analyzed by confocal laser scanning microscopy. | ||
In vitro cytotoxicity study of 3apt-Td
The biocompatibilities of the 3apt-Td nanocage were estimated in MCF-7 cells and via MTT viability assays. In the cell viability test (Fig. S4†), the cell viabilities of TM buffer at different concentrations were all close to 90%: specifically, the solvent was safe. The result observed also showed that the cell viability of the 3apt-Td nanostructure was higher compared with that of the TM buffer. The low toxicity of DNA nanostructures has been demonstrated by many researchers.11 Since the biocompatibility of drug carriers is very important in drug delivery technology, the utilization of the low cytotoxic 3apt-Td as a drug carrier creates a new class of drug delivery systems. Moreover, various chemical modifications can be easily introduced in the DNA structure. As a result, the DNA tetrahedron nanostructure will play an important role in biomedical applications.Preparation of Dox@Td, Dox@apt-Td, Dox@2apt-Td, and Dox@3apt-Td
As is well known, DOX can inhibit the synthesis of RNA and DNA by intercalating within DNA strands due to the presence of flat aromatic rings in this molecule. After incubation of Td, apt-Td, 2apt-Td, and 3apt-Td with Dox solution separately for 3 h at room temperature, the free Dox in the solution was removed using a G-100 Sepharose gel column. The number of intercalated Dox molecules per DNA tetrahedron was calculated using the absorbance of Dox at 485 nm via HPLC. As shown in Table S3,† with the feeding molar ratio of 3apt-Td![[thin space (1/6-em)]](https://www.rsc.org/images/entities/char_2009.gif) :
:![[thin space (1/6-em)]](https://www.rsc.org/images/entities/char_2009.gif) Dox changing from 1
Dox changing from 1![[thin space (1/6-em)]](https://www.rsc.org/images/entities/char_2009.gif) :
:![[thin space (1/6-em)]](https://www.rsc.org/images/entities/char_2009.gif) 25 to 1
25 to 1![[thin space (1/6-em)]](https://www.rsc.org/images/entities/char_2009.gif) :
:![[thin space (1/6-em)]](https://www.rsc.org/images/entities/char_2009.gif) 100, the average number of Dox loaded per 3apt-Td was enhanced from 20.88 ± 2.03 to 55.99 ± 7.88, while the encapsulation efficiency (EE) was reduced from 83.52 ± 8.12% to 55.99 ± 7.88%. Obviously, when the ratio of 3apt-Td to DOX was 1
100, the average number of Dox loaded per 3apt-Td was enhanced from 20.88 ± 2.03 to 55.99 ± 7.88, while the encapsulation efficiency (EE) was reduced from 83.52 ± 8.12% to 55.99 ± 7.88%. Obviously, when the ratio of 3apt-Td to DOX was 1![[thin space (1/6-em)]](https://www.rsc.org/images/entities/char_2009.gif) :
:![[thin space (1/6-em)]](https://www.rsc.org/images/entities/char_2009.gif) 25 and 1
25 and 1![[thin space (1/6-em)]](https://www.rsc.org/images/entities/char_2009.gif) :
:![[thin space (1/6-em)]](https://www.rsc.org/images/entities/char_2009.gif) 50, the EE was satisfactory, but the amount of Dox loaded per 3apt-Td was relatively lower than the other ratios. Thus, herein, we fixed the ratio of 3apt-Td to DOX as 1
50, the EE was satisfactory, but the amount of Dox loaded per 3apt-Td was relatively lower than the other ratios. Thus, herein, we fixed the ratio of 3apt-Td to DOX as 1![[thin space (1/6-em)]](https://www.rsc.org/images/entities/char_2009.gif) :
:![[thin space (1/6-em)]](https://www.rsc.org/images/entities/char_2009.gif) 75 for the preparation of DOX@3apt-Td.
75 for the preparation of DOX@3apt-Td.
In vitro behavior of dox release
To assess the in vitro DOX release behavior, the release of DOX from Dox@3apt-Td and free DOX·HCl was investigated in pH 5.5, pH 6.8 and pH 7.4 PBS (Fig. S5†). The release rate of DOX from free DOX·HCl was higher than that from Dox@3apt-Td in the same solution. The results showed that the free DOX exhibited 89.67 ± 1.66% DOX release at pH 5.5, 6.8 and 7.4 within 3 h, while for Dox@3apt-Td, the data was below 45% after almost 48 h incubation. There was no significant difference between the release rates of DOX from Dox@3apt-Td in PBS solution with different pH values.In vitro cell uptake study
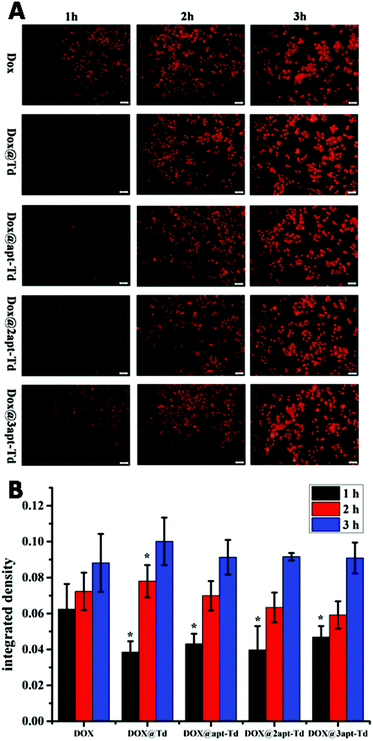
For the drug delivery study, the internalization and the efficiency of free DOX·HCl, Dox@Td, Dox@apt-Td, Dox@2apt-Td and Dox@3apt-Td were initially analyzed by fluorescence microscopy (Fig. 4A). After incubation with MCF-7 cells for 1 h, the free DOX·HCl showed higher drug accumulation compared with Dox@Td, Dox@apt-Td, Dox@2apt-Td and Dox@3apt-Td. We also found that the more aptamers the Td possessed, the more DOX was accumulated in the MCF-7 cells. However, the difference between the free DOX and other nanostructures became smaller or even disappeared after 2 or 3 h incubation, which meant that the DOX and the nanostructures caused a similar effect on the cell. Previous research proved that Td is internalized via macropinocytosis and caveolae-mediated endocytosis pathways, while free DOX·HCl is internalized by passive diffusion directly, which is the fastest pathway. In addition, we conducted single-cell quantification of DOX signal in the fluorescence microscopy images of the MCF-7 cells after incubation with free DOX and Dox@napt-Td using the Image J (1.8.0–112) software. As shown in Fig. 4B, after incubation with MCF-7 cells for 1 h, the free DOX·HCl showed significantly higher drug accumulation compared with Dox@napt-Td. However, the difference between free DOX and other DOX loaded napt-Tds became smaller or even disappeared after 3 h incubation. These resulted indicated that the intracellular uptake mechanism of DOX in tumor cells was different. The DOX encapsulated in napt-Td was internalized via macropinocytosis and caveolae-mediated endocytosis pathways, while free DOX was internalized by passive diffusion directly. This may be the reason why the internalization speed of free DOX was faster than that of Dox@Td, Dox@apt-Td, Dox@2apt-Td and Dox@3apt-Td. On the other hand, these results also proved that DOX was encapsulated in the Td during the intracellular uptake process, rather than leaked from napt-Tds.In vitro cytotoxicity assays of DOX-loaded Td
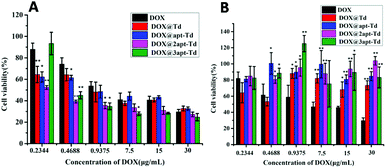
The in vitro cytotoxicity of Dox@napt-Td was estimated in MCF-7 and LO2 cells via MTT viability assays. As shown in Fig. 5A, compared with free DOX, significantly reduced cell viabilities were observed for the Dox@napt-Td treatment groups with MCF-7 cells when the DOX concentration ranged from 0.4688 to 7.5 μg mL−1, but disappeared along with a further increase in DOX concentration. These results were consistent with the results in Fig. 4, which demonstrated there was no difference in uptake ability between DOX and Dox@napt-Td (CDox = 11.6 μg mL−1) after 3 h incubation with MCF-7 cells. However, the DOX@3-apt Td treatment group failed to significantly decrease the MCF-7 viability at the lowest DOX concentration (0.2344 μg mL−1) compared to the other DOX-loaded Td nanocages. Meanwhile, as shown in Fig. 5B, the DOX@n-apt Td treatment groups (including DOX@3-apt Td) displayed similar LO2 viability compared to DOX at the DOX concentration of 0.2344 μg mL−1. However, when the DOX concentration was increased to 0.4688 μg mL−1, significantly higher LO2 viability was observed for DOX@n-apt Td than the free DOX treatment group, which suggested that encapsulated DOX in the aptamer-modified Td reduced the cell toxicity to normal cells. These results indicated that when the DOX concentration was 0.2344 μg mL−1 (the corresponding concentration of napt-Td was calculated to be 5.39 nM), the encapsulation of DOX in n-apt Td did not lead to significantly different cell cytotoxicity in both MCF-7 and LO2 cells. Thus, the in vitro cytotoxicity assays of DOX-loaded Td further verified the high selectivity and safety of the multivalent aptamer-modified Td. With the administration of free DOX, which lacks selectivity for tumor cells, the in vitro anti-tumor efficiency displayed concentration dependence under a wide range of DOX concentrations. In contrast, after DOX was encapsulated in the n-apt Td, the internalization of DOX and the corresponding anti-tumor cells efficiency were strengthened, which was verified at a reasonable DOX concentration range.In vivo imaging analysis
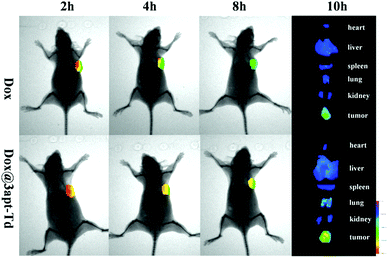
The fluorescent images from the in vivo imaging analysis are shown in Fig. 6, and from the results, we can see that 2 hours after administration, there was a strong fluorescence intensity in the tumor tissues in the free DOX·HCl group, suggesting its obvious accumulation in the tumor sites, while after four hours, the fluorescence intensity became significantly weaker, and then 4 hours later, it became even weaker. This demonstrated that DOX began to acclimate sharply after 2 h. Compared with the free DOX·HCl group, the Dox@3apt-Td group showed a stronger fluorescence intensity in the tumor sites at each time-point (2, 4 and 8 h). Meanwhile, the quantification of the DOX signal in its bio-distribution (Fig. S6†) also illustrated the different tissue distributions between DOX and DOX@3apt-Td. This phenomenon may be caused by the existence of MUC1-aptamer in Dox@3apt-Td, which can recognize the MUC1 in the surface of MCF-7 cancer cells. In the tissue distribution, there was hardly any difference between the free DOX·HCl group and Dox@3apt-Td group in the heart, liver, spleen, lung, kidney and brain. However, the tumor fluorescence intensity of the Dox@3apt-Td treatment group was stronger than that of the free DOX·HCl group, which indicated that more DOX was accumulated in the tumor sites due to the aptamer-mediated targeting, which was consistent with the bio-distribution results.In vivo antitumor effect study
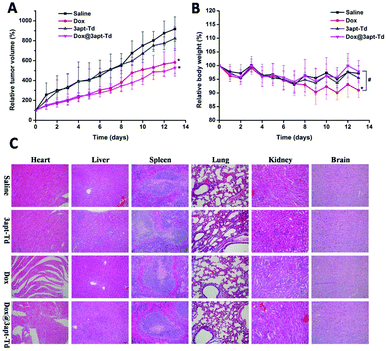
The therapeutic experiment was carried out on an MCF-7 breast tumor xenograft model. As illustrated in Fig. 7A, compared with the normal saline and 3apt-Td group, the free DOX·HCl and Dox@3apt-Td group exhibited significant inhibition of tumor growth, and consequently, the volume of their tumors was smaller. Over 13 days observation, the volume of the tumors of the mice treated with Dox and Dox@3apt-Td grew to about 5.82 ± 1.39 and 5.27 ± 0.54 times their original volume, while that for the saline and 3apt-Td groups was 9.17 ± 1.22 and 8.22 ± 1.18, respectively. Besides, from the plot of the relative body weight with time (Fig. 7B), in the first seven days, there was no discrepancy between the four groups, but from the eighth day, the free drug group showed a difference, where the weight of the mice began to decline. This was a significant difference from the formulation group (Dox@3apt-Td), indicating the severe toxicity of DOX. In addition, the results for the 3apt-Td were similar with that of normal saline both for relative tumor volume and in relative body weight, indicating the safety of the 3apt-Td. From the tissue section results for the tumor (Fig. S7†), the administration of free drug and Dox@3apt-Td reduced the amount of tumor cell division and inhibited cell proliferation compared with the control groups (saline and 3apt-Td). Moreover, the Dox@3apt-Td-treated cells experienced more extensive cytotoxicity than that treated with free DOX, which is consistent with the relative tumor volume profiles.Safety evaluation
From the tissue section results in Fig. 7C, no obvious organ damage (including liver, spleen, lung, kidney and brain) was observed in the saline, 3apt-Td, DOX and Dox@3apt-Td groups. The group treated with free DOX displayed critical fragmentation and pathological changes in the heart, which was more severe than the Dox@3apt-Td group, although there was also damage in the latter group to a certain degree. All these data revealed that the 3apt-Td was as safe as the saline solution and Dox@3apt-Td effectively protected the organism against Dox-induced cardiotoxicity and immune organ damage. The efficacy of DOX injection is related to severe systemic damage to healthy tissue, especially the heart. Furthermore, the dose-dependent cardiotoxicity induced by DOX injection is life-threatening. Table S2† shows the WBC count and spleen indices of the MCF-7 cancer nude mice from the different groups. From this table, both the WBC count and spleen index of the group treated with free DOX was significantly (p < 0.05) lower compared with the normal saline group, while that of the group treated with 3apt-Td and Dox@3apt-Td were not. These results verified our hypothesis that the multivalent modification of aptamers onto the vertex of Td DNA nanocages would result in high selectivity and safety for in vivo anti-tumor therapy.Experimental
Materials and chemicals
MUC1 aptamer (5′-GCA GTT GAT CCT TTG GAT ACC CTG G-3′) was synthesized by Takara Bio Co., Ltd (Dalian, China). All DNA backbone oligonucleotides sequences are shown in Table S1† and purchased from Takara Bio Co., Ltd (Dalian, China). MUC1 peptide (N terminus⋯C terminus: PDTRPAPGSTAPPAHGVTSAPDTRPAPGSTAPPAHGVTSA) was purchased from DGpeptides Co., Ltd (Hangzhou, China). Doxorubicin hydrochloride (DOX·HCl) was supplied by Zhejiang Hisun Pharmaceutical Co., Ltd (Taizhou, China). 4′,6-Diamidino-2-phenylindole (DAPI) was purchased from Beyotime Biotechnology Co., Ltd (Shanghai, China). 5-Diphenyl-2-H-tetrazolium bromide (MTT, Sigma-Aldrich) was used as received. Dimethyl sulfoxide (DMSO) was obtained from Lingfeng Chemical Co., Ltd (Shanghai, China). All other chemicals and reagents were of analytic grade and used as received without further purification.Preparation of Td, apt-Td, 2apt-Td, and 3apt-Td
Briefly, Td was assembled by mixing A, B, C and D (or D-Cy5) sequences. Apt-Td was assembled by mixing A′, B, C and D (or D-Cy5) sequences. 2Apt-Td was assembled by mixing A′, B′, C and D (or D-Cy5) sequences. 3Apt-Td was assembled by mixing A′, B′, C′ and D (or D-Cy5) sequences. The four DNA sequences were mixed in equimolar quantities in TM buffer (10 mM Tris-HCl, 5 mM MgCl2, pH = 8.0), heated to 95 °C for 5 min and then cooled to 4 °C in 30 s using a PCR machine (Eppendorf, Mastercylenexus GSX1, Germany).Characterization of multivalent aptamer-modified tetrahedral DNA nanocage
To verify whether the DNA tetrahedral nanocages were established successfully, agarose gel (2%) electrophoresis (AGE) was run in TBE buffer at 100 V for 40 min. After electrophoresis, the image was visualized using GelRed staining. In addition, the surface morphology of 3apt-Td was observed via atomic force microscopy (AFM; Nano Scope IIIa, Veeco, USA). AFM imaging was performed at 25 °C. AFM data was processed using the NanoScope software. For the stability test, at pre-determined time intervals (2–12 h), total complementary DNA duplex (strand D + d) and 3apt-Td solutions (90 μL, 1 μM) were added to 10% non-heat inactivated FBS, 100% non-heat inactivated FBS and 100% murine plasma. These mixtures were incubated at 37 °C and then analyzed via gel electrophoresis.Preparation of drug-loaded multivalent aptamer-modified tetrahedral DNA nanocage
Usually, DOX can be embedded in the G–C sequences of the DNA backbone of the tetrahedral DNA nanocage. For DOX intercalation into Td, apt-Td, 2apt-Td, 3apt-Td, and DOX (80 μM) were mixed with the DNA tetrahedron (800 nM) for 3 h and then run through a G-100 column to remove the free DOX remaining in solution. Then the formulation was incubated in FBS solution in 37 °C for about 24 h to destroy the tetrahedron structure to free the DOX molecules. The number of intercalated DOX molecules per DNA tetrahedron was calculated via high performance liquid chromatography (Shimadzu, LC-20A, Japan). HPLC tests were carried out in a reversed-phase column (Intersil ODS-SP, 4.6 mm × 250 mm, i.d. 5 μm, GL Sciences, Japan) at 35 °C and an ultraviolet spectrophotometer at 485 nm. A mixture of acetonitrile and water (30![[thin space (1/6-em)]](https://www.rsc.org/images/entities/char_2009.gif) :
:![[thin space (1/6-em)]](https://www.rsc.org/images/entities/char_2009.gif) 70, v/v) was used as the mobile phase at a flow rate of 1.0 mL min−1. All measurements were performed in triplicate.
70, v/v) was used as the mobile phase at a flow rate of 1.0 mL min−1. All measurements were performed in triplicate.
Cell lines and cell culture
MCF-7 cells and LO2 cells were cultured in RPMI 1640 medium (Gibco, USA) separately supplemented with 10% fetal bovine serum containing 50 U mL−1 of penicillin and 50 U mL−1 of streptomycin and maintained at 37 °C in a CO2 incubator. All experiments were performed on cells in the exponential growth phase.In vitro cell uptake study of Td, apt-Td, 2apt-Td, and 3apt-Td
MCF-7 cells and LO2 cells were seeded in 24-well plates at a density of 5 × 10⁴ cells per well and cultured. After overnight incubation, all the medium was removed and 500 μL lyophilized sample Td, apt-Td, 2apt-Td, and 3apt-Td (1000 nM) resuspended in serum free medium were added. For this experiment, strand D was labeled with Cy5 for DNA detection inside the cells. After 5 h incubation, the cells were rinsed with a copious amount of PBS and were detached from the plate using trypsin. DNA intracellular uptake was analyzed using a flow cytometer (Miltenyi, MACSQuant Analyzer 10, USA). Furthermore, to evaluate the cellular uptake of Td and napt-Td, MCF-7 and LO2 cells were seeded in petri dishes at a density of 2.5 × 10⁵ cells per dish. Then, after incubation with Cy5-labeled Td, apt-Td, 2apt-Td, and 3apt-Td (2 μM) in serum-free medium for 5 h, the cells were gently rinsed with PBS. Subsequently, the cells were fixed for 10 min with 4% paraformaldehyde and then incubated for 15 min with DAPI at room temperature. Finally, the cells were dispersed in PBS and assessed via confocal laser scanning microscopy (LSM700, Carl Zeiss, Germany). Fluorescence images were acquired with 63× magnification oil immersion lenses.In vitro cytotoxicity study of multivalent aptamer-modified tetrahedral DNA nanocage
The in vitro cytotoxicity of TM buffer and 3apt-Td against MCF-7 cells was determined using the MTT assay. Briefly, the cells were seeded on a 96-well plate at a density of 4 × 10³ cells per well. After culturing overnight, lyophilized sample (TM and 3apt-Td) resuspended in fresh medium (100 μL) was added with different concentrations for 48 h of incubation. Then 20 μL of MTT (5 mg mL−1 in PBS) was added to each well followed by further incubation for 4 h at 37 °C.In addition, the in vitro cytotoxicity of free DOX·HCl, Dox@Td and Dox@apt-Td against MCF-7 cells was determined using the MTT assay. Briefly, the cells were seeded on a 96-well plate at a density of 4 × 10³ cells per well. After culturing overnight in a CO2 incubator (37 °C), lyophilized free Dox, Dox@Td, Dox@apt-Td, Dox@2apt-Td, and Dox@3apt-Td in fresh medium (100 μL) were added while the final concentration of DOX was fixed at 11.6 μg mL−1. The cells were allowed to proliferate for 48 h. Then they were washed twice with PBS, and 20 μL MTT (5 mg mL−1 in PBS) was added to each well followed by further incubation for 4 h at 37 °C. Finally, the cells were dissolved in 150 μL DMSO. The absorbance at 570 nm was recorded using a microplate reader (Thermo, 51119000, USA). The cell viability of each group was measured according to the following formula:10 Cell viability (%) = (Absorbance of sample group)/(Absorbance of control group) × 100%.
In vitro behavior of dox release of drug loaded nApt-Td
A simple dialysis technique was used to investigate the in vitro DOX release profiles. Dox-loaded 3apt-Td (Dox@3apt-Td) and free DOX·HCl with an equivalent quantity were sealed in dialysis bags (MWCO: 3500 Da) and immersed in 20 mL PBS (10 mM PO43−, 37 °C) with different pH values. The dialysis procedure was performed in a completely dark environment for 48 h in a constant-temperature shaker (SHZ-82, Saibole Instrument Co., Ltd, Shanghai) at 100 rpm under sink conditions. At pre-determined time intervals, 4 mL of medium was withdrawn and replaced with fresh buffer solution. The amount of released DOX in the withdrawn samples was measured via fluorescence spectrophotometry (Shimadzu, RF-5301PC, Japan) at EX/EM 503/556 nm.In vitro cell uptake study of drug loaded nApt-Td
MCF-7 cells were seeded in 24-well plates at a density of 5 × 10⁴ cells per well and cultured. After overnight incubation, all the medium was removed and 500 μL lyophilized free DOX·HCl, Dox@Td, Dox@apt-Td, Dox@2apt-Td, and Dox@3apt-Td resuspended in serum free media were added. After 1, 2, and 3 h incubation, the cells were washed twice with PBS. Finally, the fluorescent intensities of the PBS cell suspensions were quantified by flow cytometry (Olympus, IX53, Japan).In vivo imaging analysis of drug loaded nApt-Td
All animal procedures were performed in accordance with the Guidelines for Care and Use of Laboratory Animals of China Pharmaceutical University and approved by the Animal Ethics Committee of China Pharmaceutical University. Nude mice were housed in a controlled pathogen-free environment with 12 h light/dark cycles at a temperature of 20–22 °C and relative humidity of 50–60%. All animals had free access to a standard mouse pellet diet and deionizer water ad libitum. To prepare the tumor models, female nude mice (four weeks old, 20 ± 2 g) received a 0.2 mL subcutaneous administration of 1 × 10⁶ MCF-7 cells in saline and Matrigel at the right side of the dorsa. After the tumor-bearing mice were housed in controlled environment for about one month, the volume of their tumors grew to 100–200 mm3, which was suitable for the subsequent experiment.For the bio-distribution evaluation, after the tumor model was established, the MCF-7 breast tumor-bearing nude mice were randomly divided into two groups (n = 5) and injected intravenously with free DOX·HCl and Dox@3apt-Td (the dose of DOX in both formulations was the same, 2 mg kg−1). After administration of these materials, the mice were anesthetized for imaging by intra-peritoneal injection of chloral hydrate (500 mg kg−1). The bio-distribution was observed using an In Vivo Imaging System (DXS4000PRO; Kodak, Rochester, NY, USA) equipped with IR820 filter sets (excitation/emission, 510/535 nm). Fluorescence images were acquired at 2, 4 and 8 h after injection. After 10 h, to observe the tissue distribution of the formulations in the tumor and different organs (heart, liver, spleen, lung, kidney and brain), the nude mice were sacrificed. Then the fluorescent images of all the tumors and organs were collected.
In vivo antitumor effect study of drug-loaded nApt-Td
For the antitumor effect evaluation, when the volume of tumor reached approximately 100–200 mm3, the mice were randomly divided into four groups (n = 6). Two groups were injected intravenously with free DOX·HCl and Dox@3apt-Td (the dose of DOX in both formulations was the same, 2 mg kg−1) every three days (0, 3, 6, 9, and 12), for a total of five injections. For comparison, the mice in the other two groups were injected with saline (0.9% sodium chloride) and 3apt-Td without DOX via their tail vein. To evaluate the antitumor effect correctly, tumor volume and body weight were monitored daily after the first injection. At day 13, 24 h after the last injection, the tumors were isolated, weighed, fixed in 10% formalin overnight and embedded in paraffin for further histological evaluation. The volumes of the tumors were measured and calculated using the following equation: V = a × b2/2 (where, a and b were the longest and shortest diameters of the tumors, respectively). The evaluation of the cell proliferation and cytotoxicity in the tumor tissues was conducted by staining with hematoxylin and eosin (H&E) after the treatments.Safety evaluation of drug-loaded nApt-Td
For the safety evaluation, 24 h after the last injection, blood was collected from the mouse eye orbit for white blood cell count (WBC) analysis. Then all the mice were sacrificed, and their tissues (liver, spleen, kidney, lung, brain and heart) and tumors were dissected and weighed for histological analysis and organ index determination. The effects of free DOX·HCl and Dox@3apt-Td on the organs were determined using the organ index. The index was calculated using the following equation: organ index = weight of organ/weight of body (mg g−1). To analyze the toxicity to all the organs, they were fixed with 10% formalin immediately at room temperature for 24 h, and then stained with hematoxylin and eosin (H&E) after they were embedded in paraffin.Statistical analysis
Experimental data is shown as the mean value ± standard deviation. Statistical analysis of variance (ANOVA) with Tukey's post-hoc test and two-tailed unpaired Students’ t-test were used to evaluate the differences between treatment groups. p values < 0.05 were considered significant. All experiments were carried out at least in triplicate.Conclusions
In summary, herein, we encapsulated a small molecule drug within multivalent aptamer-modified Td DNA nanocages to achieve tumor targeting and therapy. We showed the specific uptake of the multivalent aptamer-modified Td in tumor cells with high expression of MUC1, and the intracellular uptake efficiency improved with an increase in the number of modified MUC1 aptamers. However, the intracellular uptake efficiency of the negative control normal LO2 cells was reduced with an increase in the number of modified MUC1 aptamers. These results indicated that the multivalent modification with aptamers strengthened the selectivity of Td nanocages for targeting tumor cells, which meant improved safety for other negative cells. Considering that the native DNA nanocage is a nucleic acid, the modified site and number of aptamers on Td could be highly controlled by the design of the nucleic acid backbone sequence. Conversely, the introduction of the DNA nanocage could effectively protect aptamers from destruction by nuclease during systemic circulation and maintains its targeting effect. This is the first demonstration of functionality and emergent behaviors of DNA-based vehicles for the delivery of a small molecule drug, aiming to achieve antitumor therapeutic benefits in vivo, with expected high selectivity and satisfactory low toxicity.Conflicts of interest
There are no conflicts to declare.Acknowledgements
The authors thank the Cellular and Molecular Biology Center of China Pharmaceutical University for assistance with confocal microscopy work and we would be grateful to Xiao-Nan Ma for her help of taking/analyzing images. This work was financially supported by the National Natural Science Foundation of China (No. 81402859), National Natural Science Foundation of China (No. 51472115), Top-notch Academic Programs Project of Jiangsu Higher Education Institutions (PPZY2015B164), Administration of Traditional Chinese Medicine of Zhejiang Province (Program No. 2017ZA075).Notes and references
- Q. Jiang, C. Song, J. Nangreave, X. Liu, L. Lin, D. Qiu, Z.-G. Wang, G. Zou, X. Liang and H. Yan, J. Am. Chem. Soc., 2012, 134, 13396–13403 CrossRef CAS PubMed.
- X. Liu, L. Wu, L. Wang and W. Jiang, Talanta, 2018, 179, 356–363 CrossRef CAS PubMed.
- Q. Zhang, Q. Jiang, N. Li, L. Dai, Q. Liu, L. Song, J. Wang, Y. Li, J. Tian and B. Ding, ACS Nano, 2014, 8, 6633–6643 CrossRef CAS PubMed.
- P. D. Halley, C. R. Lucas, E. M. McWilliams, M. J. Webber, R. A. Patton, C. Kural, D. M. Lucas, J. C. Byrd and C. E. Castro, Small, 2016, 12, 308–320 CrossRef CAS PubMed.
- J. Yan, C. Hu, P. Wang, B. Zhao, X. Ouyang, J. Zhou, R. Liu, D. He, C. Fan and S. Song, Angew. Chem., Int. Ed., 2015, 54, 2431–2435 CrossRef CAS PubMed.
- Z. Zhao, E. L. Jacovetty, Y. Liu and H. Yan, Angew. Chem., Int. Ed., 2011, 50, 2041–2044 CrossRef CAS PubMed.
- J.-W. Keum and H. Bermudez, Chem. Commun., 2009, 7036–7038 RSC.
- Q.-M. Feng, M.-J. Zhu, T.-T. Zhang, J.-J. Xu and H.-Y. Chen, Analyst, 2016, 141, 2474–2480 RSC.
- R. P. Goodman, I. A. Schaap, C. F. Tardin, C. M. Erben, R. M. Berry, C. F. Schmidt and A. J. Turberfield, Science, 2005, 310, 1661–1665 CrossRef CAS PubMed.
- J. Li, H. Pei, B. Zhu, L. Liang, M. Wei, Y. He, N. Chen, D. Li, Q. Huang and C. Fan, ACS Nano, 2011, 5, 8783–8789 CrossRef CAS PubMed.
- D. Jiang, C. G. England and W. Cai, J. Controlled Release, 2016, 239, 27–38 CrossRef CAS PubMed.
- C. Angell, S. Xie, L. Zhang and Y. Chen, Small, 2016, 12, 1117–1132 CrossRef CAS PubMed.
- J. Li, C. Fan, H. Pei, J. Shi and Q. Huang, Adv. Mater., 2013, 25, 4386–4396 CrossRef CAS PubMed.
- A. R. Chandrasekaran and O. Levchenko, Chem. Mater., 2016, 28, 5569–5581 CrossRef CAS.
- K.-R. Kim, D.-R. Kim, T. Lee, J. Y. Yhee, B.-S. Kim, I. C. Kwon and D.-R. Ahn, Chem. Commun., 2013, 49, 2010–2012 RSC.
- H. Pei, X. Zuo, D. Zhu, Q. Huang and C. Fan, Acc. Chem. Res., 2013, 47, 550–559 CrossRef PubMed.
- K.-R. Kim, Y.-D. Lee, T. Lee, B.-S. Kim, S. Kim and D.-R. Ahn, Biomaterials, 2013, 34, 5226–5235 CrossRef CAS PubMed.
- R. P. Goodman, R. M. Berry and A. J. Turberfield, Chem. Commun., 2004, 1372–1373 RSC.
- V. Bagalkot, O. C. Farokhzad, R. Langer and S. Jon, Angew. Chem., Int. Ed., 2006, 45, 8149–8152 CrossRef CAS PubMed.
- C. Reinemann and B. Strehlitz, Swiss Med. Wkly., 2014, 144, w13908 Search PubMed.
- F. Radom, P. M. Jurek, M. P. Mazurek, J. Otlewski and F. Jeleń, Biotechnol. Adv., 2013, 31, 1260–1274 CrossRef CAS PubMed.
- P. Charoenphol and H. Bermudez, Mol. Pharm., 2014, 11, 1721–1725 CrossRef CAS PubMed.
- S. E. Osborne, I. Matsumura and A. D. Ellington, Curr. Opin. Chem. Biol., 1997, 1, 5–9 CrossRef CAS PubMed.
- C. Ferreira, C. Matthews and S. Missailidis, Tumor Biol., 2006, 27, 289–301 CrossRef CAS PubMed.
- E. Levy-Nissenbaum, A. F. Radovic-Moreno, A. Z. Wang, R. Langer and O. C. Farokhzad, Trends Biotechnol., 2008, 26, 442–449 CrossRef CAS PubMed.
- B. Dai, Y. Hu, J. Duan and X.-D. Yang, Oncotarget, 2016, 7, 38257 Search PubMed.
- F. Charbgoo, M. Alibolandi, S. M. Taghdisi, K. Abnous, F. Soltani and M. Ramezani, Nanomedicine, 2018, 14, 685–697 CrossRef CAS PubMed.
- M. Brayman, A. Thathiah and D. D. Carson, Reprod. Biol. Endocrinol., 2004, 2, 4 CrossRef PubMed.
- C. Yu, Y. Hu, J. Duan, W. Yuan, C. Wang, H. Xu and X.-D. Yang, PLoS One, 2011, 6, e24077 CrossRef CAS PubMed.
- C. Da Pieve, E. Blackshaw, S. Missailidis and A. C. Perkins, Bioconjugate Chem., 2012, 23, 1377–1381 CrossRef CAS PubMed.
- X. Hua, Z. Zhou, L. Yuan and S. Liu, Anal. Chim. Acta, 2013, 788, 135–140 CrossRef CAS PubMed.
- R. Savla, O. Taratula, O. Garbuzenko and T. Minko, J. Controlled Release, 2011, 153, 16–22 CrossRef CAS PubMed.
Footnotes |
| † Electronic supplementary information (ESI) available. See DOI: 10.1039/c8nr05546g |
| ‡ These authors contributed equally to this work. |
| This journal is © The Royal Society of Chemistry 2019 |

