
 Open Access Article
 This Open Access Article is licensed under a Creative Commons Attribution-Non Commercial 3.0 Unported Licence
Optimising the magnetic performance of Co ferrite nanoparticles via organic ligand capping†
M.
Vasilakaki
 a,
N.
Ntallis
a,
N.
Yaacoub
b,
G.
Muscas
c,
D.
Peddis
*d and
K. N.
Trohidou
*a
a,
N.
Ntallis
a,
N.
Yaacoub
b,
G.
Muscas
c,
D.
Peddis
*d and
K. N.
Trohidou
*a
aInstitute of Nanoscience and Nanotechnology, NCSR “Demokritos”, 153 10 Agia Paraskevi, Attiki, Greece. E-mail: k.trohidou@inn.demokritos.gr
bInstitut des Molécules et Matériaux du Mans (IMMM) – UMR CNRS, Le Mans Cedex, 7 2085, France
cDepartment of Physics and Astronomy, Materials Physics, Uppsala University, Box 516, SE-751 204 Uppsala, Sweden
dIstituto di Struttura della Materia-CNR, 00015 Monterotondo Scalo (RM), Italy. E-mail: davide.peddis@cnr.it
First published on 12th November 2018
Abstract
Ferrofluids of CoFe2O4 nanoparticles are gaining increasing interest due to their enhanced heating performance in biomedical applications (e.g. in magnetic hyperthermia as mediators for cancer treatment) or in energy applications (e.g. magneto-thermo-electric applications). Until now, the effect of an organic surfactant on the magnetic particle behaviour has been unintentionally overlooked. Here, we present the counterintuitive magnetic effect of two representative organic ligands: diethylene glycol (DEG) and oleic acid (OA) bonded at the surface of small (∼5 nm in size) CoFe2O4 particles. The combined results of the bulk dc susceptibility, local-probe Mössbauer spectroscopy and physical modelling, which is based on electronic structure calculations and Monte Carlo simulations, reveal the effect of different ionic distributions of the particles due to the different surfactant layers on their magnetic behaviour. They result in an unexpected increase of the saturation magnetisation and the blocking temperature, and a decrease of the coercive field of DEG coated CoFe2O4 nanoparticles. Our work provides a pathway for the production of colloidal assemblies of nanocrystals for the engineering of functional nano-materials.
1. Introduction
Advances in nanotechnology enable the production of magnetic nanoparticles (MNPs) with specific morphologies and the tailoring of their surfaces, in order to manipulate their characteristics to suit specific applications. Magnetic nanoparticles are well-established nanomaterials that offer controlled morphology (i.e., size and shape), bio-specificity, and the ability to be manipulated externally. Developing magnetic materials at the scale of a few nanometers requires the knowledge of the magnetic properties affected by the size and consequently surface phenomena, which can modify the properties of the materials,1 in particular, below ∼5 nm. It has been demonstrated that the magnetic surface anisotropy,2 and consequently the total anisotropy, differs significantly from the bulk magnetocrystalline component, deeply affecting the whole magnetic behaviour of the system.Nanoparticles on such a scale are usually prepared through colloidal synthesis, which makes use of surfactants, in order to obtain narrow size and shape distribution,3 to protect particles from oxidation, to disperse them in specific solvents (e.g. water and ionic liquid),4–6 or to functionalise them for specific applications, such as for biomedical applications (e.g., MRI, drug delivery, and hyperthermia).7,8 It is usually reported that for small nanoparticles, a thin external shell with higher magnetic disorder is responsible for the enhanced magnetic anisotropy and the reduced saturation magnetisation.9 Several authors have shown that the action of surfactants plays a significant role in the magnetic properties of the surface of NPs, i.e. almost restoring the bulk saturation magnetisation and influencing the local effective magnetic anisotropy, and thus the coercive field of small particles.10,11 They have attributed it to the influence of different ligands bonded at the surface of magnetic NPs that modify the magnetic properties such as the coercive field11 and the saturation magnetisation.12
It is worth noting that the selection of the organic coating is not limited to the synthesis process. While a specific ligand can be selected to control the nanoparticle's size, shape and crystalline structure produced during the synthesis, the original ligand can be exchanged in a subsequent process in favour of a different one, which can be used to fine tune specific magnetic properties of the nanoparticles.8 Thus, tuning the magnetic properties of a nanoparticle, by selecting the appropriate coating in a ligand exchange process, becomes an interesting perspective for future magnetic particle applications such as magneto-thermo-electric applications containing charged colloidal suspensions, namely ionically stabilised magnetic nanoparticles dispersed in electrolytes.13
In this study, we examine and compare the effects of two different ligands (diethylene glycol – DEG and oleic acid – OA), bonded at the surface of small (∼5 nm in size) CoFe2O4 nanoparticles, on their magnetic behaviour. DEG and OA are very common ligands widely used in synthesis procedures (e.g. thermal decomposition of metallorganic precursors and the polyol method).14–17 DEG and OA interact with the surface of the particles through hydroxylic (R-OH) and carboxylic (R-COOH) groups, respectively. In addition, it is worth mentioning that these functional groups are common to a lot of molecules (both hydrophobic and hydrophilic) that are used to cover nanoparticles for several applications, making the presented results to concern a wide range of scientific and technological interest.
We show that the effects of the two different ligands produced by the same methodology on the magnetic behaviour of the CoFe2O4 nanoparticles are different.
The magnetic measurements, including bulk dc susceptibility and local-probe Mössbauer spectroscopy, are complemented by an elaborated theoretical approach, based on electronic structure calculations and the Monte Carlo simulation method. A detailed description of the interplay between intra-particle surface characteristics and interparticle interactions has been used for the total volume of the nanoparticle (including the coating volume).
We suggest that a careful clarification of the magneto-structural characteristics and possible coupling effects that influence the magnetisation of a colloidal assembly of nanocrystals is necessary in the engineering of functional nano-architectures for magnetically driven applications.
2. Experimental section
2.1 Synthesis, characterisation and data treatment
Cobalt ferrite nanoparticles of 5 nm size with high crystallinity were synthesised by the polyol process.18–20 To prepare these cobalt ferrite nanoparticles (CoFe2O4), 2 mmol of iron(III) nitrate nonahydrate (Sigma Aldrich, >98%), 1 mmol of cobalt(II) nitrate hexahydrate (Sigma Aldrich, 98%) and 1 ml of distilled water were added to 100 ml of diethylene glycol (DEG, Sigma Aldrich, 99%) in a round bottom three-neck flask. The solution was kept under mechanical agitation and heated to the boiling point. The system was kept under reflux for 2 h and then it was cooled to room temperature. With the addition of acetone to a part of the solution, the precipitation of a black powder was induced. The product was washed with acetone and separated via centrifugation; this procedure was repeated three times, and finally the powder was dried in an oven at 60 °C overnight. This sample was labelled as DEG. Due to the –OH groups of DEG, such particles are dispersible in polar solvents, such as water. It should be underlined that the polyol method allows us to obtain single particles coated with a molecular shell of polyol (DEG in this case).Thermogravimetry (TG) and simultaneous differential thermal analysis (DTA) on both DEG and OA samples were carried out on a Mettler-Toledo TGA/SDTA 851. Thermal analysis data were collected in the range of 25–1000 °C with a heating rate of 10 °C min−1 under oxygen flow (flow rate = 50 ml min−1).
57Fe Mössbauer spectra were recorded using a 57Co/Rh γ-ray source mounted on an electromagnetic transducer with a triangular velocity form. The samples consist of a thin layer of the powdered compound located in a sample holder. They were obtained at 12 K in an 8 T field oriented parallel to the γ-beam, and were then analysed by using the program ‘Mosfit’. The hyperfine structure was modelled by means of a least-square fitting procedure involving Zeeman sextets composed of Lorentzian lines. The isomer shift (IS) values were referred to that of α-Fe at 300 K.
DC magnetisation measurements were performed using a Quantum Design SQUID magnetometer equipped with a superconducting coil (Hmax = ±5 T). Magnetisation versus temperature measurements were performed using zero-field-cooled (ZFC) and field-cooled (FC) protocols. ZFC and FC magnetisation measurements were carried out by cooling the sample from room temperature to 5 K in zero magnetic field; then, a static magnetic field of 2.5 mT was applied. MZFC was measured during the warmup from 5 K to 300 K, whereas MFC was recorded during the subsequent cooling. The field dependence of remanent magnetisation was measured using the IRM (isothermal remanent magnetisation) and DCD (direct current demagnetisation) protocols. The DCD curve was obtained by saturating the sample and then measuring the remanence MDCD(H) after applying the reverse fields Hrev up to the maximum field Hmax (5 T). The IRM curve was obtained starting from a totally demagnetised state by applying a positive magnetic field and measuring the remanence MIRM(H) when the field was removed; the process was repeated by increasing the field gradually up to Hmax.
2.2 Exchange ligand process
While DEG represents a relatively weakly bonded coating (only electrostatic interactions) between –OH groups and the particle surface,21,22 oleic acid is reported as a covalent bonding surfactant that attaches –COOH– groups23 preferentially with respect to the –OH groups. In order to exchange DEG with another capping agent such as oleic acid, we add to a DEG solution of nanoparticles, a solution of oleic acid in an organic solvent (e.g. cyclohexane and toluene). Due to different densities of DEG and cyclohexane, the two solutions are immiscible; the oleic acid in cyclohexane remains on top while the polyol solution with black nanoparticles is the dark solution, at the bottom (Fig. S1-left, ESI†). After 24 h under stirring, the exchange is attained (Fig. S1-right, ESI†). The top solution of cyclohexane containing the nanoparticles coated with oleic acid is now soluble in the organic solvent, while the yellow residual polyol remains at the bottom of the beaker. It should be underlined that we can easily remove the dark solution with the NPs and eventually wash it with acetone and ethanol to obtain a powder treated at 60 °C in an oven overnight to dry it, as we did in the case of the DEG sample in Section 2.1. The solutions of CoFe2O4 nanoparticles coated with DEG and oleic acid are labelled as DEG and OA, respectively.3. Theoretical calculations
3.1 The model
Multiscale modelling was employed to investigate the magnetic behaviour of the nanoparticles in the presence of the organic coating. Ab initio calculations to find the relaxed structures, the relative sublattice magnetisations in the two samples and the anisotropy energies complemented the mesoscopic modelling of the assembly of the nanoparticles.3.2 Electronic structure calculation of single magnetic nanoparticle parameters
First principles calculations, based on spin-polarised density functional theory, were performed via the Vienna Ab Initio Simulation Package (VASP)24,25 for a cluster of atoms (nanoparticles) of the Co ferrite structure, with the two coatings (DEG and OA). The electronic charge density and the local potential were expressed in plane wave basis sets. The geometries are fully optimised (electronic relaxation: 10−4 eV; ionic relaxation: 10−3 eV). The exchange correlation functional chosen is the one proposed by Perdew–Burke–Ernzerhof (PBE). The interactions between the electrons and ions were described using the projector-augmented-wave (PAW) method. A cutoff energy of 550 eV was used. We calculated the magnetic moments, the magnetocrystalline anisotropy energy (MAE) and the exchange coupling constants for these systems. The results were used as input data to the mesoscopic modelling of the corresponding nanoparticle assemblies.We started with the bulk CoFe2O4 calculations in order to tune the on-site Coulomb strength U and exchange coupling J parameters. In Dudarev's26 scheme, the effective parameter Ueff = U − J is taken as the input and the Ueff values are 4.5 eV for Fe atoms and 4.0 eV for Co atoms: Fe atoms have magnetic moments of 4μB in A sites and 4.2μB in B sites. The Co atoms have a magnetic moment of 2.6μB in B sites. The lowest energy is found when the O atoms are placed in the (x,x,x) crystal coordinates, where x = 0.386. The lattice constant of the cubic unit cell is found to be 8.35 Å. As these U − J parameters properly define the bulk values, they are used as the input to the finite system calculations. In our calculations, spherical nanoparticles of size ∼2 nm with ionic distributions of the ferrite structure (obtained from the Mössbauer spectra of the coated NPs) are considered. To avoid the interaction between the periodic images, we took 1.5 nm of empty space along all the directions. In order to calculate the magnetic anisotropy energy (MAE), the spin–orbit coupling is taken into account, non-self-consistently, for several spin orientations, by rotating all spins along different directions.
3.3 Modelling of the macroscopic magnetic behaviour of the magnetic nanoparticle assemblies
Modelling assemblies of 5 nm Co ferrite nanoparticles coated with a surfactant is a very complicated issue. The model has to take into account the intra-particle characteristics of the nanoparticles together with the inter-particle interactions. Indeed, the small size of the nanoparticles makes the surface contribution to their magnetic behaviour very important. We developed a simple mesoscopic model of 3-spins to simulate the magnetic properties of assemblies of CoFe2O4 nanoparticles with a core/surface morphology. To examine the significance of the surface contribution because of the small nanoparticle size, we compare our results with the well-known Stoner–Wohlfarth (SW) mesoscopic model,27 in which each nanoparticle is represented by a single spin in the assembly. Our mesoscopic model28 is based on the reduction of the amount of simulated spins to the minimum number necessary to describe the magnetic structure of the core/surface particles and on the introduction of the adequate exchange and anisotropy parameters between the different spin regions inside the nanoparticle. The latter is calculated starting from our DFT results, properly rescaled, to take into account the core and surface regions separately. In this way, we estimate the anisotropies for the core and the surface, the intra-particle exchange coupling constants and the magnetic moments. In all the calculations, we explicitly take into account the coating thickness.We consider an assembly of N spherical ferrimagnetic nanoparticles of diameter D = 5 nm with a core/surface morphology, located randomly on the nodes of a cubic lattice inside a box of 10α × 10α × 10α, where α is the smallest inter-particle distance. Each nanoparticle is located at a lattice site (x,y,z) and it is described by a set of three classical spin vectors, one for the core  and two for the surface
  and
and  , i = 1,…,N (total number of particles) with the magnetic moment mn = MnVn/MsV, where n = 1 stands for the core and n = 2 and 3 for the “up” and “down” surface sublattices of the nanoparticle, respectively. V is the particle volume (equivalent to the number of the spins) and MS is its saturation magnetisation. Vn and Mn are the volume and the saturation magnetisation of the core, the “up” and “down” surface sublattice spins.
Each spin has a uniaxial easy anisotropy axis randomly oriented. The short range intra-particle exchange interactions between the core spin and each of the two surface spins (interface coupling Jc1 and Jc2) and between the two surface spins (surface coupling Jsrf) are introduced as well as inter-particle dipolar interactions.
The total energy of the system for the N nanoparticles is:28
 | (1) |
The first, second and third energy terms describe the nearest-neighbour Heisenberg exchange interactions between the core spin and the two surface spins, and the exchange interaction between the surface spins, respectively. The fourth, the fifth and the sixth terms give the anisotropy energy of the core and the surface and ê1i, ê2i, and ê3i are the random anisotropy easy-axis directions. The seventh term gives the dipolar interactions among all spins in the nanoparticles, where the magnetic moments of the three macrospins of each particle are defined as m1 = M1V1/MsV, m2 = M2V2/MsV, and m3 = M3V3/MsV and Dij is the dipolar interaction tensor. The last term is the Zeeman energy, where êh is the direction of the magnetic field.
The parameters in eqn (1) are Jc1 and Jc2, the intra-particle exchange coupling constants between the core spin and the surface spins, and Jsrf, the exchange coupling constant between the surface spins,
(a) Kc = 20 × 105 erg cm−3 is the core bulk anisotropy constant of the CoFe2O4 ferrite and the surface anisotropy of the nanoparticle with the OA is 1.5 times larger than the DEG coated nanoparticle extracted from our DFT calculations
(b) We set g = μ0(MSV)2/(4πD3KcV1) = 1
(c) The normalised volume of the three spin domains to the total volume is calculated, using an atomic scale model of an inverse spinel structured sphere where V1 = 0.3, V2 = 0.21 and V3 = 0.49, assuming the surface thickness as 0.835 nm. In the normalisation, we also took into account the fact that the surface layer volume of the DEG sample is smaller than that of the OA sample due to the thinner (∼40%) DEG surface layer (thickness of the oleic acid layer is 2 nm).
The magnetic moments mn for the three macrospins were extracted from our DFT calculations for a cobalt ferrite structure with ionic surface distribution (Co0.14Fe0.86)[Co0.86Fe1.14]O4 formed by the OA coating, and (Fe0.78)[Co1.00Fe1.22]O4 formed by the DEG coating as observed from the Mössbauer spectra. The DFT calculations show that for the DEG coating case, the surface moment is increased by a factor of 1.2. Taking into account the above considerations for the volume in the case of the OA sample, we consider the total magnetic moments m1 = 0.198, m2 = 0.76, and m3 = 0.23 and for the DEG sample m1 = 0.198, m2 = 1.07, and m3 = 0.26.
(d) H is the external magnetic field and kBT (T is the temperature) is the thermal energy.
The above energy parameters, as they are inserted in the simulations, were normalized by the factor KV that is the core volume anisotropy of the nanoparticle; so they are dimensionless.
The normalized effective anisotropy constants are kc = 1 for the core, ksrf = 3.0 for the surface anisotropy in the case of OA and ksrf = 2.0 in the case of the DEG sample as it is obtained from our DFT simulations.
The effective exchange coupling constants among the core spin and the surface spins are jc1 = 1.3, jc2 = 1.2, and jsrf = −1.2 estimated by taking into account our DFT calculations and the difference in the magnetic moments of the two sublattices at the surface due to the number of the uncompensated spins.29
An important factor, which influences the rheology of a ferrofluid and the magnetic behaviour of the nanoparticles inside it, is the nanoparticle concentration in the fluid. We study the effects of the concentration and the consequent clustering of the nanoparticles by varying the concentration of the nanoparticles coated with DEG and OA in the 3-spin model from c = 1% up to c = 25%. The number of nanoparticles N ranges from 20 to 500 for the corresponding concentrations.
We use the Monte Carlo (MC) simulation technique with the implementation of the Metropolis algorithm30 to calculate the isothermal hysteresis loops, the remanence and the temperature dependent magnetisation curves. For the dipolar energy calculation, the Ewald summation technique is usually implemented taking into account the long-range character of the dipolar interactions; however, in our case we consider a structure like a frozen ferrofluid31 and the implementation of this algorithm is not done since we are working with finite boundary systems.
The Monte Carlo simulation results for a given temperature and an applied field were averaged over 80 samples with various spin configurations, realisation of the easy-axes distribution and different spatial configurations for the nanoparticles. For every field and temperature value, the first 500 steps per spin are used for equilibration, and the subsequent 5000 MC steps are used to obtain thermal averages. For the calculation of the ZFC curves, the three steps described below were followed: (1) cooling the system at a constant step rate ΔT = 0.02 from temperature T = 1.25 to T = 0.002 at zero applied field, H = 0, (2) heating the sample from temperature T = 0.002 to T = 1.25 under the application of a magnetic field Happ and calculating the ZFC curve and (3) by cooling the sample down from T = 1.25 to T = 0.002 under the field Happ and calculating the FC curve. The hysteresis was calculated under a field cooling procedure with a cooling field Hcool = 5 along the z-direction.
Moreover, the calculation of the DC demagnetisation remanence curve (DCD) and isothermal remanence (IRM) curve was performed following the same procedure as in the experiment described in the Experimental section.
4. Results and discussion
Careful structural and morphological characterisation of the samples (Fig. S2 in the ESI†) shows the presence of crystalline particles with a spherical shape. The X-ray diffraction pattern exhibits Bragg peaks compatible with the cubic spinel structure of CoFe2O4 (PDF Card 22-1086; see the ESI†) and no other phase is detected. TEM images show spherical-like shaped particles with narrow size distribution and an average particle diameter D (median of the log-normal distribution) of 5.3(9) nm (Fig. S3, ESI†).4.1 Thermogravimetry and FT-IR analysis results
The TG curve (Fig. 1) for the DEG sample showed two main weight losses. The first one, between 25 and 200 °C, coupled with an endothermic SDTA curve, can be ascribed to the absorbed water and residual ethanol. The second weight loss, between 200 and 350 °C, is associated with the exothermic peaks due to DEG decomposition. The analysis of SDTA curves showed the presence of a single exothermic peak in the region of 240–250 °C which can be associated with the decomposition of the monolayer of DEG adsorbed on the surface of the particles. In fact, if a double layer of DEG is present, a double peak in SDTA can be observed.32 The thermogravimetric curve of the OA sample shows a weight loss of ∼25% at 250 °C, associated with an exothermic peak in the SDTA curve. The weight loss of 25% is compatible with the presence of a monolayer of oleic acid (molecule length, ∼1.97 nm; surface occupied by one molecule, ∼0.2 nm2) as already observed in similar systems.17 All the magnetic data discussed in Section 4.3 have been rescaled to the magnetic phase extracted from TGA results.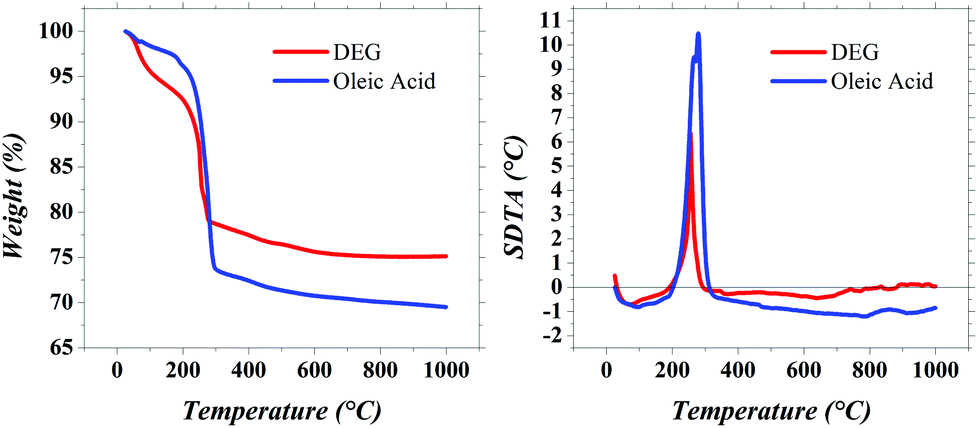 | ||
| Fig. 1 TGA (a) and simultaneous (S)DTA (b) curves of DEG and OA samples. | ||
Fourier transform infrared (FT-IR) analysis (Fig. 2) confirms the same landscape as described by the TGA analysis. The signals around 590 cm−1 and 400 cm−1 are attributed to the stretching vibrations of the metal in tetrahedral and octahedral sites, respectively, and the oxygen; these signals are typical of the spinel ferrite structure.33–35 The symmetrical and asymmetrical stretching of C–H (signals between 2922 and 2850 cm−1) are typical of both surfactants but their intensity increases with the longer chain of OA. The C–O stretching (around 1100 cm−1) confirms the presence of polyol.36 In particular, the interaction between polyol oxygen and metal cations at the surface of the particles finds evidence both in the small shift to lower frequencies of the C–O signals with respect to the pure polyol,19 and in their different intensity profiles,29,37 with two signals in place of the three small signals of pure DEG. The signals around 3377 and at 1616 cm−1 are referred to the stretching and bending modes of O–H of polyol and adsorbed water.36 Finally, the complex profile between 1500 cm−1 and 1400 cm−1 shows the emergence of COOH stretching signals after the substitution with OA.
 | ||
| Fig. 2 FT-IR analysis of DEG (red) and OA (blue) samples. | ||
4.2 Magnetic structure and DFT electronic structure calculations
In order to investigate the effect of the molecular coating on the magnetic structure, Mössbauer spectroscopy was performed under an intense magnetic field at low temperature. This is a powerful technique to investigate the magnetic structures of different Fe species through hyperfine interactions and to perform quantitative analysis from the refinement of the in-field Mössbauer spectrum. Fig. 3 shows the spectra recorded at 12 K under a magnetic field of 8 T applied parallel to the γ-beam for the two samples. These spectra are unambiguously consistent with a ferrimagnetic structure. We can attribute clearly the two sextets to Fe3+ in the interstitial site with tetrahedral (A) and octahedral symmetry (B) according to the values of the isomer shift and give the atomic Fe3+A/Fe3+B population ratio (Table 1). Note that from the value of the isomer shift for the two samples, we can exclude the presence of Fe2+ ions. In addition, the in-field spectrum does allow a quantitative estimation of the effective field Beff (vectorial sum of the hyperfine field Bhf and the applied field Bapp) and the canting angle θ (angle defined by the directions of Beff for both tetrahedral and octahedral iron components and the γ-beam direction).38,39 The in-field Mössbauer fitted parameters for the two samples are listed in Table 1. | ||
| Fig. 3 In-field Mössbauer spectra recorded at 12 K under an applied magnetic field of 8 T parallel to the γ-beam, for DEG and OA samples. | ||
| Sample | Site | <δ> (mm s−1) | <2ε> (mm s−1) | <Beff> (T) | <Bhf> (T) | <θ (°)> ±10° | FeA,B3+/Fetotal3+ |
|---|---|---|---|---|---|---|---|
| CoFe-Sp2-L4 | Fe3+A | 0.34(1) | −0.00(1) | 59.4(2) | 51.8(2) | 17 | 0.39(1) |
| Fe3+B | 0.48(1) | −0.02(1) | 56.5(2) | 54.1(2) | 20 | 0.61(1) | |
| CoFe-Sp2-L4-EXC-LIG | Fe3+A | 0.35(1) | −0.01(1) | 59.7(2) | 52.4(2) | 22 | 0.43(1) |
| Fe3+B | 0.48(1) | −0.04(1) | 46.7(2) | 54.4(2) | 16 | 0.57(1) |
The in-field sub-spectra (for A and B) (Fig. 3) show that the second and fifth lines have a non-zero intensity. Usually, when these peaks are distinctly observed, they evidence a canted structure for iron magnetic moments with respect to the applied field (non-collinear magnetic structure). The canting angle for both sites is quite low, in agreement with the high crystallinity of the particles in the two samples and they are equal within the experimental error. The refined value of the hyperfine field of Fe3+ located in octahedral sites (≅54.1 T) for the DEG sample is slightly lower than that of the OA sample (≅54.4 T) while we observe the opposite trend for Bhf in sites A. Also, an increase of the proportion of Fe3+ in site A in the OA sample (43%) is observed compared to that of the DEG sample (39%).
From these results, considering the stoichiometric sample as confirmed by ICP analysis, the cationic distribution was estimated as:
| (Fe0.78)[Co1.00Fe1.22]O4 (DEG) |
| (Co0.14Fe0.86)[Co0.86Fe1.14]O4 (OA) |
Starting from this cationic distribution, electronic structure calculations were performed for the two different ligands.
Fig. 4 shows the relaxed structures produced by DFT electronic calculations of the spherical particles. The figure on the left is the DEG sample and that on the right is the OA sample. In both samples, tetrahedral Fe possesses a smaller magnetic moment than octahedral Fe by a factor of 0.9. The mean magnetic moment per Fe ion is found to be 4.02μB for the DEG coated sample and 3.98 for the OA coated sample and those per Co ion are 2.65μB and 2.15μB, respectively. Some Co atoms initially placed in pseudo-octahedral sites show a reduced moment. This can be attributed to the fact that due to the spatial distortion of the nanoparticle configurations in comparison with the bulk, the O atoms are found at different distances from the corresponding ones of the non-distorted structure leading to a reduction of the d orbital moment. This affects a larger number of magnetic ions in the oleic acid coated sample reducing the mean magnetic moment per Co ion.
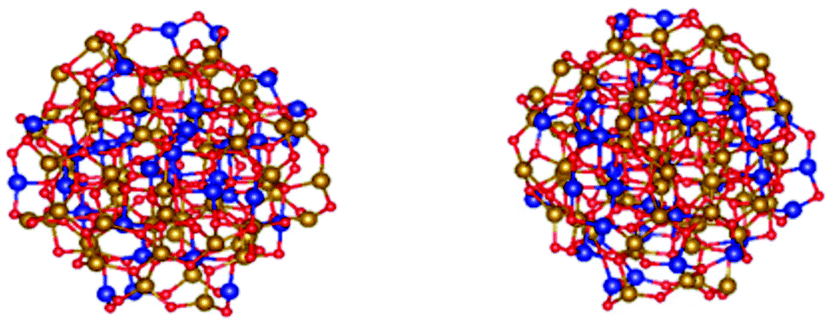 | ||
| Fig. 4 Relaxed structures of CoFe2O4 spherical particles: (left) DEG and (right) OA (Co: blue balls, Fe: yellow balls, O: red balls).40 | ||
After performing the ionic relaxation, different magnetic configurations were mapped on a Heisenberg model in order to obtain an estimation of the magnetic exchange constants. The mapping is performed in such a way that we have the interactions in each sublattice and between sublattices (Table 2). By rotating all spins and taking into account spin–orbit coupling non-self-consistently, the magnetic anisotropy energy (MAE) was calculated for the two samples. The results are shown in Fig. S4, ESI,† for the energy variation as a function of the squared cosine of the polar angle, which represents the magnetic moment rotation. The linear dependence indicates a uniaxial response in both cases. From the slope of the curve, we can extract the MAE, KV, where K is the anisotropy constant and V is the volume of the cell. Table 2 shows the net magnetic moment, the MAE and the exchange coupling constants for the two spherical samples. The DEG sample has a larger net magnetic moment approximately 1.3 times that of the OA sample, whereas the OA sample has approximately 1.5 times larger anisotropy energy than the DEG sample.
| Sample | M (μB) | MAE (meV) | J aa (meV per μB2) | J bb (meV per μB2) | J ab (meV per μB2) |
|---|---|---|---|---|---|
| DEG | 163.1 | 6.31168 | 0.8 | 1.3 | −1.4 |
| OA | 135.4 | 9.68672 | 0.9 | 1.2 | −1.51 |
We note that the exchange coupling parameters show no big variation between the two samples; however, they give the proper signs for the sublattices as it is observed in the literature for bulk Co ferrites.41
4.3 Magnetic properties: experiments and simulations
Field dependence and temperature dependence of magnetisation were investigated by DC magnetometry. M (H) at T = 5 K (Fig. 5a), as expected, shows hysteretic behaviour for both samples: the DEG sample shows higher saturation and lower magnetic anisotropy with respect to the OA sample (Table 3). The lower anisotropy in the DEG sample compared to the OA sample is confirmed also by the saturation field measurements (μ0Hκ, Table 3) which can be considered as the minimum field that is necessary to apply to reverse even the moment of the particles with the highest anisotropy energy. μ0Hκ was measured at the point at which the difference between the magnetising and demagnetising branches is under 1% of their maximum value. In addition, despite the fact that CoFe2O4 nanoparticles are relatively stable, in order to rule out the effect of oxidation, measurements were performed at different times after the synthesis. High reproducibility was observed with values of Ms and Hc being almost constant within the experimental error. | ||
| Fig. 5 Experimental findings (a, b) and Monte Carlo simulation results (c, d) for the hysteresis loops at 5 K and the ZFC/FC curves, respectively, for an assembly of interacting CoFe2O4 nanoparticles coated with DEG (red) and OA (blue) surfactants. | ||
| Sample | M S (A m2 kg−1) | μ 0 H C (T) | μ 0 H K (T) | T max (K) | T b (K) |
|---|---|---|---|---|---|
| DEG | 120(10) | 0.77(1) | 3.44(2) | 191(6) | 155(5) |
| OA | 83(9) | 1.11(1) | 3.93(2) | 181(6) | 140(6) |
Fig. 5b shows the ZFC/FC curves of the two samples. ZFC curves exhibit a maximum at a temperature (Tmax) that, for non-interacting particles, is directly proportional to the average blocking temperature, with a proportionality constant of β = 1.5–2, depending on the type of particle size distribution.42 Irreversible magnetic behaviour is observed below a given temperature (Tirr) that corresponds to the blocking of the biggest particles. In order to estimate the value of the blocking temperature (Tb, Table 3), a distribution of the blocking temperature was extracted from the difference between MZFC and MFC (see Fig. S5, ESI†). It is worth mentioning that MFC flattens out below Tmax, which is a typical feature of strong interparticle interactions, which induce a collective state with high anisotropy. All Tirr, Tmax and Tb are lower for OA with respect to the DEG samples.
In Fig. 5c and d, the Monte Carlo simulated hysteresis loops and the zero field cooled/field cooled magnetisation curves of an assembly of CoFe2O4 nanoparticles coated with DEG (red) and OA (blue) surfactants are presented. We observe that the DFT calculated increase of the magnetic moments of the surface sublattices and the decrease of the surface anisotropy as an effect of the DEG coating result in an increase of the saturation magnetisation and a decrease of the coercivity of the system in comparison with the saturation magnetisation and the coercivity values of the OA coated nanoparticles.
The increase in the saturation magnetisation in the case of the DEG sample results also in the increase in the dipolar strength and consequently the increase of the Tmax that corresponds to the maximum value of the ZFC magnetisation. Monte Carlo simulation results are in very good agreement with the experimental findings.
In Fig. 6 we present the hysteresis loops for both samples measured at T = 300 K. Both samples show superparamagnetic behaviour. As can be seen from Fig. 6, both samples have finite values of the saturation magnetisation. It is worth noting that the DEG sample shows saturation magnetisation values Ms = 120 A m2 kg−1 at T = 5 K and Ms = 110 A m2 kg−1 at T = 300 K higher than the corresponding bulk values of the Co ferrite (∼94 A m2 kg−1 at 4.2 K and 81 A m2 kg−1 at 298 K).43
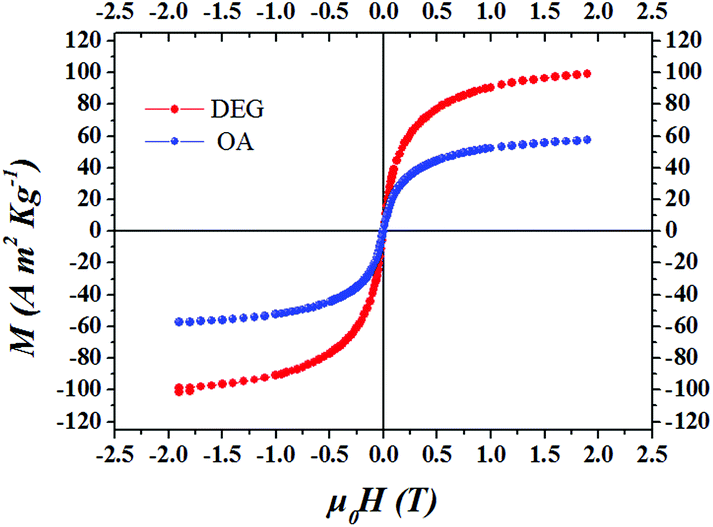 | ||
| Fig. 6 Field dependence of magnetisation recorded at 300 K for the DEG and OA samples. | ||
The efficiency of our 3-spin model was investigated by comparing it with the classical mesoscopic Stoner–Wohlfarth model where each nanoparticle is represented by a single spin with a mesoscopic magnetic moment and an effective anisotropy. The results for the hysteresis loops and the ZFC/FC magnetisation curves for this model are shown in Fig. S6 (in the ESI†). On comparing the results of Fig. S6† with those of Fig. 5, it becomes evident that the 3-spin model describes our systems in a better way, in particular the ZFC/FC magnetization curves, and it is in good agreement with the experimental findings. This is expected because the existence of the three spins in our model, which are exchange coupled, creates additional disorder and frustration that result in the narrowing of the ZFC curves around the maximum and the flattening of the FC curves. Our results show clearly that we need to include the surface contribution explicitly in our simulations to describe efficiently the magnetic behaviour of these systems, since the surface is directly affected by the surfactant.
To investigate further the effect of the surfactant layer on the strength of the interparticle interactions during the magnetisation reversal, remanence magnetisation studies were carried out at 5 K. Both Isothermal Remanent Magnetisation (IRM) and Direct Current Demagnetisation (DCD) remanent curves were measured (Fig. S7a, S7b, ESI†). Following the same experimental procedure, we also calculated the IRM and DCD magnetisation curves using MC simulations for these nanoparticle systems (Fig. S7c, S7d, ESI†).
In Fig. 7, ΔM(H) plots are calculated from the experimental and simulation data using the expression ΔM(H) = MDCD (H) − (1–2 × MIRM (H))31,44,45 (see the ESI† for more information). The negative ΔM indicates the existence of dipolar interparticle interactions and surface effects as was demonstrated in ref. 46.
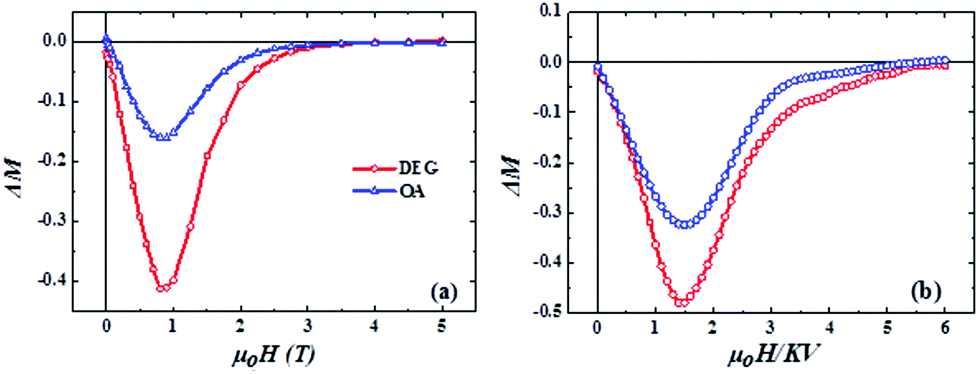 | ||
| Fig. 7 Experimental findings (a) and Monte Carlo simulation results (b) of ΔM plots for an assembly of interacting CoFe2O4 nanoparticles coated with DEG (red) and OA (blue) surfactants. | ||
Both experimental and MC simulations results (Fig. 7) indicate that in the case of DEG coated nanoparticles, a much stronger negative deviation is evident compared to the OA coating suggesting stronger dipolar interactions, which are attributed to the different saturation magnetisation values and interparticle distances in the samples (see the ESI† for more information). It is worth underlining that the presence of dipolar interactions only in the OA sample shows clearly that no-agglomeration among bare particles occurs during the ligand exchange process. In both samples, the coated nanoparticles are dipolarly coupled.
Finally, as demonstrated by our MC simulations (Fig. S8 in the ESI†), where the hysteresis loops for both samples were plotted for various concentrations, the decrease of the magnetic particle concentration results in the decrease of the saturation magnetisation and the increase of the coercive field in both samples. The decrease in the saturation magnetization is expected since the magnetic volume decreases with the decrease of the nanoparticle concentration. Also the role of the dipolar interaction decreases since the reduction of the concentration results in the increase of the interparticle distance.47 Therefore, as the concentration decreases, the single particle anisotropic character prevails. However, for all concentrations, the saturation magnetisation of the DEG sample is higher than that of the OA sample and the HC for the OA sample is higher than that of the DEG sample, in agreement with our electronic structure calculations for a single nanoparticle. These results underline the significance of the coatings in the magnetic behaviour of the Co ferrite nanoparticle assemblies.
5. Conclusions
We have studied the effect of an organic ligand on the magnetic behaviour of 5 nm Co ferrite nanoparticles coated with DEG and OA surfactants. The systems were characterised by TGA, DTA and FT-IR measurements. In-field Mössbauer spectra show different cationic distributions for the two systems. The hysteresis loops, the ZFC/FC magnetisation curves and ΔM plots show that the DEG ligand on the surface of the nanoparticles results in higher saturation magnetisation and lower coercive field than in the case of the OA ligand. This is attributed to the larger atomic magnetic moments and to the lower magnetocrystalline anisotropy of the DEG sample as was demonstrated by DFT calculations. The increase of the MS in the DEG sample results in the enhancement of the dipolar strength and the increase in ZFC Tmax. Multiscale modelling for the magnetic behaviour of these systems employing electronic structure calculations for the atomic structure and mesoscopic scale modelling for the internal structure of the nanoparticles and the interparticle interactions of the assembly showed very good agreement with the experimental findings. Finally, from Fig. 6 we see that both samples show superparamagnetic behaviour at room temperature retaining finite saturation magnetization. In particular, in the DEG sample, MS ≅ 110 A m2 kg−1 is higher than the MS for the pure Co ferrite bulk sample at temperature 300 K. This fact opens new perspectives for –OH based coating of nanoparticles for application in catalysis, biomedicine and thermoelectricity.Conflicts of interest
There are no conflicts of interest to declare.Acknowledgements
This work was supported by the European Union's Horizon 2020 Research and Innovation Programme: under grant agreement no. 731976 (MAGENTA). KNT, MV and NN acknowledge the computational time granted by the Greek Research & Technology Network (GRNET), in the Greek National HPC facility ARIS (http://hpc.grnet.gr), under the project NASIFMAG (pr004027).References
- R. H. Kodama, A. E. Berkowitz, E. J. McNiff and S. Foner, J. Appl. Phys., 1997, 81, 5552–5557 CrossRef CAS.
- K. N. Trohidou, M. Vasilakaki, D. Peddis and D. Fiorani, IEEE Trans. Magn., 2012, 48, 1305–1308 CAS.
- Y. Yin and A. P. Alivisatos, Nature, 2005, 437, 664–670 CrossRef CAS PubMed.
- M. Mamusa, J. Sirieix-Plénet, F. Cousin, R. Perzynski, E. Dubois and V. Peyre, J. Phys.: Condens. Matter, 2014, 26, 284113 CrossRef CAS PubMed.
- M. Mamusa, J. Sirieix-Plénet, F. Cousin, R. Perzynski, E. Dubois and V. Peyre, Soft Matter, 2014, 10, 1097–1101 RSC.
- W. Wu, Q. He and C. Jiang, Nanoscale Res. Lett., 2008, 3, 397–415 CrossRef CAS PubMed.
- C. C. Berry and A. S. G. Curtis, J. Phys. D: Appl. Phys., 2003, 36, R198 CrossRef CAS.
- D. Ling, M. J. Hackett and T. Hyeon, Nano Today, 2014, 9, 457–477 CrossRef CAS.
- A. Demortière, P. Panissod, B. P. Pichon, G. Pourroy, D. Guillon, B. Donnio and S. Bégin-Colin, Nanoscale, 2011, 3, 225–232 RSC.
- Y. Prado, N. Daffé, A. Michel, T. Georgelin, N. Yaacoub, J. M. Grenèche, F. Choueikani, E. Otero, P. Ohresser, M. Arrio, C. Cartier-dit-Moulin, P. Sainctavit, B. Fleury, V. Dupuis, L. Lisnard and J. Fresnais, Nat. Commun., 2015, 6, 10139 CrossRef CAS PubMed.
- C. R. Vestal and Z. J. Zhang, J. Am. Chem. Soc., 2003, 125, 9828–9833 CrossRef CAS PubMed.
- Y. Tanaka, S. Saita and S. Maenosono, Appl. Phys. Lett., 2008, 92, 093117 CrossRef.
- T. J. Salez, B. T. Huang, M. Rietjens, M. Bonetti, C. Wiertel-Gasquet, M. Roger, C. L. Filomeno, E. Dubois, R. Perzynski and S. Nakamae, Phys. Chem. Chem. Phys., 2017, 19, 9409–9416 RSC.
- G. Muscas, G. Singh, W. R. Glomm, R. Mathieu, P. A. Kumar, G. Concas, E. Agostinelli and D. Peddis, Chem. Mater., 2015, 27, 1982 CrossRef CAS.
- L. Suber and D. Peddis, in Nanomater. Life Sci, ed. C. S. S. R. Kumar, Wiley, Weinheim, 2010, p. 431475 Search PubMed.
- C. Cannas, A. Musinu, A. Ardu, F. Orrù, D. Peddis, M. Casu, R. Sanna, F. Angius, G. Diaz, G. Piccaluga and F. Orrù, Chem. Mater., 2010, 22, 3353 CrossRef CAS.
- D. Peddis, F. Orrù, A. Ardu, C. Cannas, A. Musinu and G. Piccaluga, Chem. Mater., 2012, 24, 1062–1071 CrossRef CAS.
- F. Fiévet and R. Brayner, Nanomaterials: A Danger or a Promise? A Chemical and Biological Perspective, ed. R. Brayner, F. Fiévet and T. Coradin, Springer-Verlag, London, 2013, vol. 1, pp. 1–25 Search PubMed.
- S. Ammar, A. Helfen, N. Jouini, F. Fiévet, I. Rosenman, F. Villain, P. Molinié and M. Danot, J. Mater. Chem., 2001, 11, 186–192 RSC.
- S. Chkoundali, S. Ammar, N. Jouini, F. Fiévet, P. Molinié, M. Danot, F. Villain and J. M. Grenèche, J. Phys.: Condens. Matter, 2004, 16, 4357–4372 CrossRef CAS.
- M. Günay, H. Erdemi, A. Baykal, H. Sözeri and M. S. Toprak, Mater. Res. Bull., 2013, 48, 1057–1064 CrossRef.
- H. Deligöz, A. Baykal, E. E. Tanriverdi, Z. Durmus and M. S. Toprak, Mater. Res. Bull., 2012, 47, 537–543 CrossRef.
- C. Cannas, A. Musinu, A. Ardu, F. Orrù, D. Peddis, M. Casu, R. Sanna, F. Angius, G. Diaz and G. Piccaluga, Chem. Mater., 2010, 22, 3353–3361 CrossRef CAS.
- G. Kresse and J. Furthmüller, Comput. Mater. Sci., 1996, 6, 15–50 CrossRef CAS.
- G. Kresse and J. Furthmüller, Phys. Rev. B: Condens. Matter Mater. Phys., 1996, 16, 11169–11186 CrossRef.
- S. Dudarev and G. Botton, Phys. Rev. B: Condens. Matter Mater. Phys., 1998, 57, 1505–1509 CrossRef CAS.
- E. C. Stoner, F. R. S. Wohlfarth and E. P. A. Wohlfarth, Phys. Trans. A, 1948, 240, 74 Search PubMed.
- M. Vasilakaki, G. Margaris, D. Peddis, R. Mathieu, N. Yaacoub, D. Fiorani and K. Trohidou, Phys. Rev. B, 2018, 97, 094413 CrossRef.
- G. Margaris, K. N. Trohidou and J. Nogués, Adv. Mater., 2012, 24, 4331–4336 CrossRef CAS PubMed.
- K. Binder and W. D. Heermann, Monte Carlo Simulation in Statistical Physics. An introduction In Solid-State Sciences, Springer-Verlag, Heidelberg, 1988, vol. 80 Search PubMed.
- K. N. Trohidou and J. A. Blackman, Phys. Rev. B: Condens. Matter Mater. Phys., 1995, 51, 11521–11526 CrossRef CAS.
- B. Aslibeiki, P. Kameli, M. H. Ehsani, H. Salamati, G. Muscas, E. Agostinelli, V. Foglietti, S. Casciardi and D. Peddis, J. Magn. Magn. Mater., 2016, 399, 236–244 CrossRef CAS.
- A. Baykal, H. Deligöz, H. Sozeri, Z. Durmus and M. S. Toprak, J. Supercond. Novel Magn., 2012, 25, 1879–1892 CrossRef CAS.
- C. Cannas, A. Ardu, A. Musinu, D. Peddis and G. Piccaluga, Chem. Mater., 2008, 20, 6364–6371 CrossRef CAS.
- C. Cannas, A. Falqui, A. Musinu, D. Peddis, G. Piccaluga and G. Piccaluga, J. Nanopart. Res., 2006, 8, 255 CrossRef CAS.
- W. Cai and J. Wan, J. Colloid Interface Sci., 2007, 305, 366–370 CrossRef CAS PubMed.
- H. Yang, C. Zhang, X. Shi, H. Hu, X. Du, Y. Fang, Y. Ma, H. Wu and S. Yang, Biomaterials, 2010, 31, 3667–3673 CrossRef CAS PubMed.
- D. Peddis, N. Yaacoub, M. Ferretti, A. Martinelli, G. Piccaluga, A. Musinu, C. Cannas, G. Navarra, J. M. Greneche and D. Fiorani, J. Phys.: Condens. Matter, 2011, 23, 426004 CrossRef CAS PubMed.
- E. Tronc, P. Prené, J. P. Jolivet, J. L. Dormann and J. M. Grenèche, Hyperfine Interact., 1998, 112, 97–100 CrossRef CAS.
- K. Momma and F. Izumi, J. Appl. Crystallogr., 2011, 44, 1272–1276 CrossRef CAS.
- P. G. Bercoff and H. R. Bertorello, J. Magn. Magn. Mater., 1997, 169, 314–322 CrossRef CAS.
- J. I. Gittleman, B. Abeles and S. Bozowski, Phys. Rev. B: Solid State, 1974, 9, 3891–3897 CrossRef CAS.
- M. Grigorova, H. J. Blythe, V. Blaskov, V. Rusanov, V. Petkov, V. Masheva, D. Nihtianova, L. M. Martinez, J. S. Mun and M. Mikhov, J. Magn. Magn. Mater., 1998, 183, 163–172 CrossRef CAS.
- E. P. Wohlfarth, J. Appl. Phys., 1958, 29, 595–596 CrossRef.
- P. E. Kelly, K. O'Grady, P. L. Mayo and R. W. Chantrel, IEEE Trans. Magn., 1989, 25, 3881–3388 CrossRef CAS.
- J. A. De Toro, M. Vasilakaki, S. S. Lee, M. S. Andersson, P. S. Normile, N. Yaacoub, P. Murray, E. H. Sánchez, P. Muñiz and D. Peddis, et al. , Chem. Mater., 2017, 29, 8258–8268 CrossRef CAS.
- M. Vasilakaki, G. Margaris and K. N. Trohidou, Nanoparticles Featuring Electromagnetic Properties: From Science to Engineering, ed. A. Chiolerio and A. Paolo, Signpost, Kerala, India, 2012, 5, 105–132 Search PubMed.
Footnote |
| † Electronic supplementary information (ESI) available: Exchange ligand process. Structural and morphological characterisation. DFT electronic structure calculations for the magnetic anisotropy. Distribution of magnetic anisotropy energy. Comparison of the 3-spin with the SW model. Interparticle interactions: measurements and calculation of the IRM and DCD plots. Effect of the concentration of the particles on the magnetic properties. See DOI: 10.1039/c8nr04566f |
| This journal is © The Royal Society of Chemistry 2018 |