 Open Access Article
New nanoscale toughening mechanisms mitigate embrittlement in binary nanocrystalline alloys†
Nathan M.
Heckman
 ,
Stephen M.
Foiles
 ,
Christopher J.
O'Brien
 ,
Michael
Chandross
,
Christopher M.
Barr
,
Nicolas
Argibay
,
Khalid
Hattar
,
Michael
Chandross
,
Christopher M.
Barr
,
Nicolas
Argibay
,
Khalid
Hattar
 ,
Ping
Lu
,
David P.
Adams
and
Brad L.
Boyce
,
Ping
Lu
,
David P.
Adams
and
Brad L.
Boyce
 *
*
Materials Science and Engineering Center, Sandia National Laboratories, Albuquerque, NM 87185, USA. E-mail: blboyce@sandia.gov
First published on 12th November 2018
Abstract
Nanocrystalline metals offer significant improvements in structural performance over conventional alloys. However, their performance is limited by grain boundary instability and limited ductility. Solute segregation has been proposed as a stabilization mechanism, however the solute atoms can embrittle grain boundaries and further degrade the toughness. In the present study, we confirm the embrittling effect of solute segregation in Pt–Au alloys. However, more importantly, we show that inhomogeneous chemical segregation to the grain boundary can lead to a new toughening mechanism termed compositional crack arrest. Energy dissipation is facilitated by the formation of nanocrack networks formed when cracks arrested at regions of the grain boundaries that were starved in the embrittling element. This mechanism, in concert with triple junction crack arrest, provides pathways to optimize both thermal stability and energy dissipation. A combination of in situ tensile deformation experiments and molecular dynamics simulations elucidate both the embrittling and toughening processes that can occur as a function of solute content.
Introduction
The interest in nanocrystalline metals stems largely from the Hall–Petch relationship, which correlates increases in yield strength to reductions in grain size.1–4 Because of this, nanocrystalline metals can exhibit a greater than tenfold increase in strength compared to their coarser-grained counterparts.1,4 While this increase in strength is potentially beneficial in engineering applications, there are several common limitations of nanocrystalline metals, namely that they are often thermally unstable,5–9 have relatively low ductility,1,10,11 and have commensurately low toughness at sufficiently small grain sizes.11,12 This potential lack of thermal stability, even at room temperature,5,6 can lead to a degradation of strength over time. To address these limitations, there are several methods to improve thermal and/or mechanical properties, including the use of grain boundary engineered nanocrystalline metals such as nanotwinned metals,13–15 the use of a bimodal grain structures,16–18 the incorporation of amorphous grain boundaries in the material,19–21 or – of specific interest to this study – the use alloyed nanocrystalline metals that display solute segregation.22–25 Other studies have examined the role of alloying on solute drag and Zener pinning, as well as grain boundary segregation, grain refinement, and thermodynamic stabilization.26–28 In addition, solute segregation has been shown to potentially inhibit grain boundary sliding and grain rotation in nanocrystalline alloys.29,30 The focus of the present study is to investigate how boundary-segregating solute content influences the tensile failure mechanisms and corresponding mechanical properties. While there are several binary alloys that have demonstrated enhanced thermal properties, the present study examines Pt–Au, which has been recently shown to exhibit extreme resistance to sliding wear degradation for potential electrical contact applications.31The framework for thermodynamic stabilization in solute-segregated binary alloys,26 as originally described by Weissmüller,23 and more recently by Chookajorn et al.,22 is that the driving force for boundary motion can be reduced or eliminated with particular solute elements that prefer to segregate to the grain boundary and simultaneously lower the grain boundary free energy.26 Conceptually, this mechanism could allow the material to retain its microstructure at elevated temperatures for an indefinite period of time, as opposed to kinetic stabilization which only slows down the grain growth process.32 While indefinite (perfect) stability has not yet been observed, substantial improvements in thermal stability have been observed in several alloys. An early example of this is Ni–W,33 where the nanocrystalline alloy displayed negligible grain growth at temperatures up to ∼875 K (homologous temperature of 0.45) for 24 hours due to the observed W segregation to boundaries that served to reduce the total boundary energy. As a potential means for perfect thermal stability, solute segregated alloys may be essential in the utilization of nanocrystalline metals as engineering materials, so it is critical to understand how this segregation influences the mechanical behavior.
There is a growing realization that the alloying pathways for thermal stabilization may in some cases lead to a deterioration of mechanical properties. Specifically, some recent simulations suggest that different grain boundary segregating elements in nanocrystalline Al can either strengthen or embrittle grain boundaries.29,30,34,35 The potential for grain boundary embrittlement has been explored in the context of thermodynamically stabilized binary alloys by Gibson and Schuh.36 The Gibson model speculates that an alloying element will be embrittling when two conditions are met: first that the binary pair has a positive heat of mixing, and second that the alloying element has a lower surface energy than that of the base material, promoting the tendency for grain boundary segregation. Furthermore, elemental pairs that have either a higher heat of mixing or lower ratio of surface energies (solute to solvent) are expected to be more embrittling, although the implications of this are not explicitly defined. Gibson and Schuh suggest that this model can predict the behavior for both coarse-grained and nanocrystalline metals, although to the authors’ knowledge the embrittling behavior of these binary systems has not yet been explicitly demonstrated for nanocrystalline alloys by experiment.
While grain boundary embrittlement has been observed in several fcc nanocrystalline metals,37,38 these studies do not focus on how the solute concentration influences the deformation; intergranular fracture is currently best understood in coarse-grained fcc materials.39 Embrittlement has been demonstrated not only through the presence of pre-existing embrittling elements (such as sulfur embrittlement in steels or nickel alloys),40,41 but also by exposing the metals to a corrosive environment, such as aqueous solutions for austenitic steels or nickel alloys, where hydrogen embrittlement can lead to stress corrosion cracking.42,43 An important observation in some fcc systems exhibiting stress corrosion cracking is that they show some potential to resist brittle crack propagation through crack arrest at triple junctions.42,43
In this study, the tensile deformation behavior of nanocrystalline Pt–Au is investigated and compared to that of pure Pt. This system is studied primarily due to the noble nature of Pt and Au,44 minimizing the overall impact of oxidation. To further improve the purity of the system, samples were synthesized by magnetron sputtering, avoiding the contamination often introduced through electrodeposition38,45 or ball milling46 processes. This alloy has previously been shown to strongly segregate Au solute to the Pt grain boundaries, and improved thermal stability and wear resistance has been demonstrated.31 The strength of the alloy comes from a combination of Hall–Petch strengthening as well as traditional and nanoscale solid solution strengthening.47 In the context of the previous work by Gibson and Schuh,36 Au is expected to embrittle Pt, consistent with the findings in this study. The present study focuses on identifying the dominant monotonic deformation mechanisms in these alloys and how they contribute to the materials’ mechanical properties. Tensile behavior and a mechanistic connection between deformation processes and resulting mechanical properties was observed through molecular dynamics (MD) simulations and experimental in situ tensile deformation experiments in the scanning electron microscope (SEM). Most importantly, the study revealed that grain boundary embrittlement may under some conditions be useful to enable distributed nanocracking as a toughening mechanism. Both grain boundary triple junctions and heterogeneous chemical segregation can arrest nanocracks thereby offering multiple potential toughening mechanisms.
Methods and procedures
In situ experiments
Tensile tests were performed on freestanding nanocrystalline films with a thickness of approximately 5 μm, synthesized by DC magnetron sputtering. Pt and Pt-10Au (at%) films were deposited onto Si substrates with a wafer diameter of 75 mm; deposition temperatures were determined to be below 100 °C (homologous temperature of 0.18 for the two alloys). The compositions of the as-sputtered films were determined using a JEOL model JXA-8530F Wavelength Dispersive Microscope operating at 7 kV on 1 μm thick witness films, where each film's composition was determined to be within 0.5 at% of the nominal compositions. In addition, the texture of each film was determined by precession electron diffraction where it was found that each film had a strong [1 1 1] texture in the growth direction. Microstructural characterization was performed by transmission electron microscopy (TEM) using an FEI Titan™ G2 80-200 STEM, operated at 200 kV. TEM samples were prepared by focused ion beam (FIB) liftout of site-specific electron-transparent foils. Scanning TEM (STEM) utilized a high-angle annular dark-field (HAADF) detector to image the film structure in both cross-sectional and in-plane views. STEM energy-dispersive X-ray spectroscopy (STEM-EDS) mapping was performed on the Pt–Au sample to determine Au segregation behavior. Au atomic concentration was calculated using the Cliff-Lorimer method.48Tensile specimens with reduced sections of 0.5 by 2.4 mm were cut into the as-sputtered films with a femtosecond pulsed Ti:Sapphire laser. The adhesion between the substrate and samples was low enough that dogbones readily delaminated from the substrate upon removal. To create an area of stress and strain localization for in situ observation, a notch with a 10 μm diameter circular tip and 50 μm length was cut into the sample with an FEI Nova 600 Nanolab FIB at an accelerating voltage of 8 kV. A stress concentration factor of 8.6 was calculated for this geometry using SOLIDWORKS FEA with a localized mesh size of 0.05 μm at the notch.
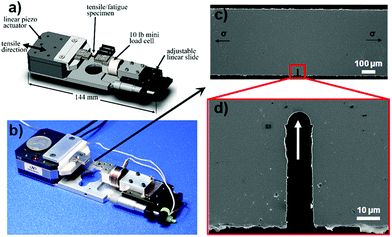
In situ SEM tensile tests were performed with a custom-built microtensile load frame, as illustrated in Fig. 1. Actuation was provided by a Newport NPX400SG piezoelectric actuator and force was measured with a Honeywell Model 31 44.5N force transducer. Interrupted tensile tests were performed with far-field strain steps of 0.02% at strain rates of 10−3 s−1 until final fracture, with each sample fracturing at the notch. At each step, 40 s SEM images were taken at an oblique viewing angle of 45° to the notch using a JEOL IT300HR SEM operated at 10 kV. Far-field engineering stress was determined using the force measurements and initial cross-sectional area of the gage section (as measured by SEM), and far-field engineering strains were measured by tracking particles on the sample surface with a gage length of 0.5 mm. Note that a separate set of tests was performed on additional samples with far-field strain rate steps of 0.1%, producing repeatable results to those presented in this manuscript.
Post-mortem SEM and TEM characterization was performed on the samples to identify any differences in morphological or microstructural deformation between Pt and Pt-10Au. Morphological analysis was performed by SEM utilizing a JEOL IT300HR SEM at an accelerating voltage of 10 kV; both the fracture surface and sample surface were analyzed to identify any features that formed during deformation or fracture. Additional microstructural characterization was performed at the sample notch features utilizing FIB liftout (FEI Nova 600 Nanolab at 8 kV) and TEM (FEI Tecnai F30 operated at 300 kV) to identify microstructural changes due to tensile deformation.
Molecular dynamics simulations
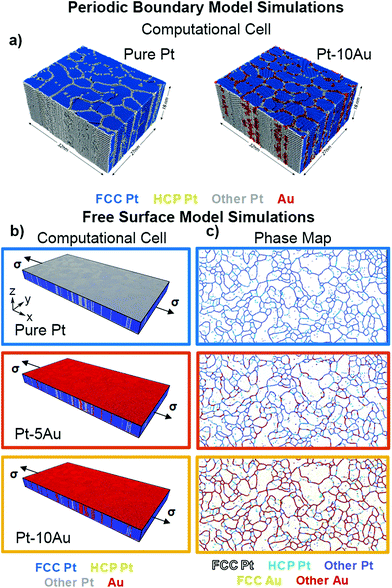
Two separate and independent Molecular Dynamics (MD) simulation approaches were employed to explore tensile behavior. Inspired by the blind independent comparative modeling employed in the Sandia Fracture Challenges,49,50 these two independent MD models provide a rare example of prediction differences arising from differing assumptions and boundary conditions, providing for a more robust interpretation and comparison to experimental observations. The two independent modeling subteams, both with extensive expertise in MD modeling, had the same goal of replicating the experimental behavior, and a secondary outcome of the present study was to illustrate the breadth of differences and important similarities arising from two arguably valid approaches. In one approach, hereafter considered the free surface model (FSM), the top and bottom surfaces of the generated samples were free surfaces. In the other system, hereafter the periodic boundary model (PBM), the top and bottom surfaces of the generated samples were periodic. Both simulations employ an embedded atom method (EAM) potential designed to treat Pt–Au alloys based on a fit to an extensive density functional theory (DFT) database, as described in detail in O'Brien, et al.51,52 Note that in both simulations, atom swaps were performed to allow for boundary segregation, however the microstructures were not demonstrated to be perfectly thermodynamically stable in either simulation. All MD simulations were performed using the LAMMPS code53 and the Monte Carlo (MC) simulations were performed using a code developed by Foiles.54,55Periodic computational cells were generated in LAMMPS with an initial size of 32 × 27 × 18 nm3 with a total of 957![[thin space (1/6-em)]](https://www.rsc.org/images/entities/char_2009.gif) 754 atoms (see Fig. 2a). The initial PBM microstructure was generated from a 6 × 6 × 1 array of superimposed cylinders filled with atoms from which overlapping atoms were removed. For both Pt and Pt–Au, this initial microstructure had a total of 36 grains. The resulting microstructure was annealed for 2 × 10⁴ ps at 300 K with a Nose–Hoover thermostat using an NPT ensemble at zero pressure to preserve the overall microstructure while allowing equilibrium grain boundary structures to form. The Pt-10Au sample was generated by performing an MC atom swap procedure, where a swap was accepted with a probability proportional to the Boltzmann factor; note a similar procedure was utilized in the FSM simulation, as described in the following section. At each of the 3000 MC steps per atom, atom type swaps or displacements of two atoms of the same type were conducted with equal probability. Prior to tensile loading, both the Pt and Pt-10Au samples had a total of 33 grains, with equivalent circular diameters of 7.1 nm and 8.2 nm, respectively. The displacements ensured that the system maintained a temperature of 300 K.
754 atoms (see Fig. 2a). The initial PBM microstructure was generated from a 6 × 6 × 1 array of superimposed cylinders filled with atoms from which overlapping atoms were removed. For both Pt and Pt–Au, this initial microstructure had a total of 36 grains. The resulting microstructure was annealed for 2 × 10⁴ ps at 300 K with a Nose–Hoover thermostat using an NPT ensemble at zero pressure to preserve the overall microstructure while allowing equilibrium grain boundary structures to form. The Pt-10Au sample was generated by performing an MC atom swap procedure, where a swap was accepted with a probability proportional to the Boltzmann factor; note a similar procedure was utilized in the FSM simulation, as described in the following section. At each of the 3000 MC steps per atom, atom type swaps or displacements of two atoms of the same type were conducted with equal probability. Prior to tensile loading, both the Pt and Pt-10Au samples had a total of 33 grains, with equivalent circular diameters of 7.1 nm and 8.2 nm, respectively. The displacements ensured that the system maintained a temperature of 300 K.
The tensile behavior of the PBM models were examined at 300 K, applying a periodic boundary condition to the plane normal to the loading direction. The remaining surfaces normal to the y and z-directions were unconstrained. The simulation was conducted using a NPT ensemble with a Nose–Hoover thermostat. Strain was applied every 2 ps corresponding to a strain rate of 1 × 10⁸ s−1. The resultant stress in the x-direction was calculated by averaging for 1 ps after the incremental strain was applied.
To create the Pt-5Au and Pt-10Au samples, an equilibrium MC simulation technique was employed. First, atoms were selected at random and converted from Pt to Au to obtain the desired Au concentration. For subsequent chemical migration, an MC procedure was employed that picked two atoms of opposite type and swapped their chemical identity. The energy for this swap was computed and the swap was accepted with a probability proportional to the Boltzmann factor of the energy change at a temperature of 775 K. Note that these swaps could occur between atoms located arbitrarily in the system. While this is not the physical process, it leads to a more efficient determination of the equilibrium configuration, but does not follow the kinetic path of a physical diffusion process. 50 million MC swaps were attempted followed by a short 1 picosecond MD equilibration timestep to allow for local structural relaxation. This cycle was repeated 250 times to produce the initial state for the deformation simulations. Note that the grain structures of the three samples were very similar, but not identical as the inclusion of the MD steps in the generation of Pt-5Au, and Pt-10Au led to modest grain evolution.
The initial computational cell for the three systems is shown in Fig. 2b, where it can be observed in the Pt–Au systems that Au migrated both towards boundaries and the free surfaces. The strong surface segregation of Au to a Pt free surface is well known experimentally.56,57 In order to analyze the Pt–Au region in each sample, only the middle 50% of the sample thickness (3.75 to 11.25 nm in the z-direction) is shown in the figure and analyzed for deformation; the initial microstructure for this regime is presented in Fig. 2c for all three compositions. Au migration to boundaries was heterogeneous for both Pt-5Au and Pt-10Au, where, by length, ∼50% of the boundaries were Au-rich in Pt-5Au and more than 90% of the boundaries were Au-rich in Pt-10Au. Note that after Au migration to the free surfaces in Pt-5Au and Pt-10Au, the remaining Au concentration in the analyzed, Pt-rich region of the two samples was 2.13 at% and 6.84 at%, respectively. Note that this does result in less boundary saturation in the Pt-10Au sample in the FSM model compared to the PBM simulation.
The deformation responses of the materials were examined by simulating a displacement-controlled tensile test with displacement along the x-axis of the sample. The periodic length along the long (x) direction was uniformly increased by 1% strain per nanosecond corresponding to a strain rate of 107 s−1. The simulation employed a Nose–Hoover thermostat at 775 K. The box was adjusted to maintain zero virial stress in the y-direction; the surfaces in the z-direction were free to move. The overall and local stresses were evaluated based on the virial expression.
Results
In situ tensile tests
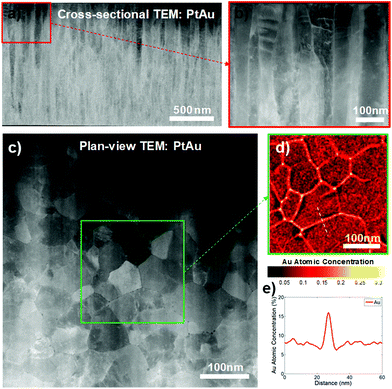
For both Pt and Pt–Au, the as-sputtered microstructures were observed to be columnar with an average grain width of approximately 50 nm (Fig. 3a and b). Note that samples did show some gradient in microstructure, with finer grains observed on the substrate side of the as-sputtered film. In addition, both Pt and Pt-10Au were observed to have some nanopores along grain boundaries (such as those in Fig. 3c), however the pore distribution was found to be relatively consistent between the two materials. Consistent with both theory and the simulations, STEM-EDS revealed heterogeneous segregation of Au towards grain boundaries (Fig. 3d and e); the grain interiors were observed to contain ∼8 at% Au (higher than that of the evolved state in the simulations) while the concentrations at boundaries ranged from 8 at% to 30 at%, further emphasizing the heterogeneous Au concentration.The far-field stress–strain curves from the in situ SEM tensile tests for Pt and Pt-10Au are shown in Fig. 4a. While the notch is expected to have some influence over the shape of the curves, these curves give some indication of the far-field plastic behavior in the material, allowing for a comparison to simulated results. Pt-10Au exhibited a 16% higher Young's modulus than Pt, with values of 145 and 125 GPa respectively. A difference in yield behavior was evident as well, identified by deviations from linear behavior. In Pt, there is a clear deviation from linear behavior at a stress of ∼1000 MPa, whereas the Pt-10Au curve begins to deviate at ∼1250 MPa. Due to the presence of the notch, an accurate measure of the 0.2% offset yield strength is not possible, but these curves do reveal that measurable far-field plastic flow occurs in nanocrystalline Pt at a lower stress than in Pt-10Au. Note that a fracture toughness (K1c) cannot be directly determined from these experiments, due to the influence of the blunt notch and the lack of valid plane-strain conditions.58,59 References to toughness throughout this manuscript focus primarily on the potential for energy absorption in tension,59 measured as area under the tensile stress–strain curves in the simulations, and the potential mechanisms to toughen the material are explored in both the simulations and experiments.
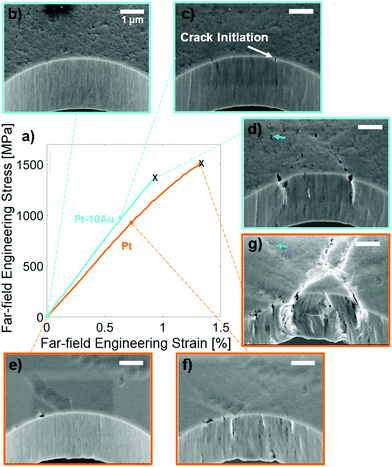 | ||
| Fig. 4 Tensile behavior observed during in situ SEM tensile tests. Far-field stress–strain curves (a) for Pt and Pt-10Au were determined from low magnification SEM images using a gage length of 0.5 mm. The black dashed lines show extended linear portions of the curves to highlight deviations from linear behavior. SEM images of the notches for Pt–Au (b–d) and pure Pt (e–g) show the sample deformation behavior at different points during the tensile test. Pt–Au shows crack formation at a far-field stress of 900 MPa (b), which form into a crack network prior to fracture at 1400 MPa (c). Pt shows plastic deformation at the notch and shear band formation (f) at 1000 MPa with significant slip (g) prior to sample fracture at 1500 MPa. The full deformation of the samples can be viewed in ESI Videos A and B.† | ||
SEM images of the deformation at the notch at various points during the test are shown for Pt-10Au in Fig. 4b–d and Pt in Fig. 4e–g; the complete evolution during the test can be seen in ESI Videos A and B.† Some clear differences in deformation were observed for the two materials. In Pt, as shown in Fig. 4e–g, shear bands emanating from the notch (such as those highlighted by the blue arrow in Fig. 4g) were observed to form at ∼45° angles to the loading direction, starting at a far-field stress of ∼1000 MPa, corresponding to the deviation from macroscopic linearity in the stress–strain curves. Some crack-like mode-I surface flaws nucleated at roughness perturbations of the notch surface and were found to blunt plastically during subsequent loading. Near final fracture, these surface flaws triggered two catastrophic shear bands which coalesced into a mode-I crack. In Pt-10Au, small cracks on the order of tens of nanometers were observed to form at a far-field stress of 1000 MPa (highlighted in Fig. 4c), prior to any macroscopic deviation from linearity in the stress–strain curve. Immediately prior to fracture, these cracks grew to a maximum length of ∼500 nm, and a network of smaller cracks (highlighted for example by the blue arrow in Fig. 4d) were observed ahead of the notch with a similar orientation to the slip bands observed in Pt. The final fracture in Pt-10Au followed a similar mode-I crack path as in Pt.
Post-mortem morphological analysis of the samples, shown in Fig. 5, highlights differences in deformation and fracture response between nanocrystalline Pt and Pt-10Au. Representative SEM images of the shear bands in Pt and cracking in Pt-10Au are shown in Fig. 5a and d. In Pt, none of the shear bands showed any indication of the distributed nanocracking that was observed in Pt-10Au ahead of the notch. Higher magnification images of the cracks in Pt-10Au reveals their morphology, with crack flank surfaces having columnar features with widths comparable to the as-sputtered grain size (∼50 nm). Fractography at the notches was performed at various angles, shown in Fig. 5b, c and e, f for Pt and Pt-10Au respectively. In Pt, the sample exhibited extensive localized necking, with a nearly complete reduction of cross-sectional area. The extensive necking is a signature of extensive ductility and in thin film samples is more relevant than the geometry-sensitive macroscopic failure far-field strain.60 In contrast, Pt-10Au displayed less localized necking with a ∼50% reduction in area, and the fracture surface was characterized by brittle-like columnar microstructural features (widths ranging from 100–200 nm).
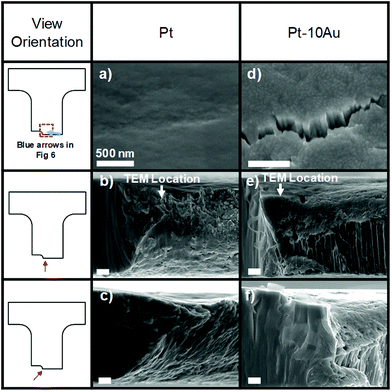 | ||
| Fig. 5 Post-mortem morphological analysis of nanocrystalline Pt (a–c) and Pt-10Au (d–f). The shear bands in Pt (highlighted in Fig. 4) show no indications of cracking (a), and the fracture surface shows localized necking to a point where it is characterized by plastic elongations (b–c). The cracks in Pt–Au (highlighted in Fig. 4) show vertical columnar features on the order of 50 nm, near the sample's original columnar grain width (d). The fracture surface of Pt–Au shows some localized necking, with a thickness reduction of roughly 50%, and vertical columnar features along the fracture surface (e–f). | ||
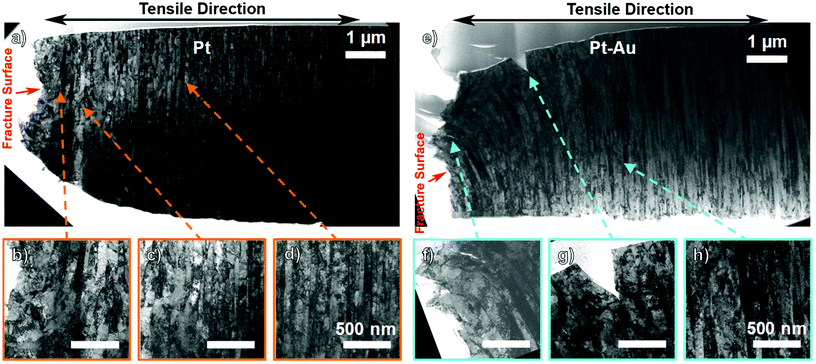
Post-mortem TEM cross-sectional microstructural analysis at the fracture sites is shown in Fig. 6, corresponding to the regions highlighted by white arrows in Fig. 5b and e. Bright-field TEM images of the entire fracture surface as well as local regions are shown to highlight notable features such as microstructural evolution and cracking. In Pt, the sample exhibited microstructural deformation consistent with localized plastic deformation. As shown in Fig. 6a–d, in Pt, the as-deformed grain morphology varied with distance from the fracture surface. Within ∼1 μm of the fracture surface (Fig. 6b), the microstructure was observed to have transformed to a non-columnar microstructure with maximum grain sizes of 200–300 nm, six times larger than the columnar width of the as-sputtered system; this region intersects with the entire fracture surface. Between ∼1 and 2 μm from the fracture surface (Fig. 6c), the grains were distorted and larger than the as-sputtered grains. Beyond 2 μm from the fracture surface, the sample had a columnar microstructure with an average grain width of ∼50 nm (Fig. 6d), comparable to the as-sputtered sample. The nanocrystalline Pt sample therefore exhibited plastic behavior through microstructural deformation with a combination of both grain growth and microstructural transformation (from columnar to equiaxed grains), consistent with previous research.61
In Pt-10Au, the sample exhibited a combination of plastic behavior through both microstructural evolution (albeit more localized and limited than in Pt) and brittle behavior through intergranular and transgranular cracking. Similar to Pt, there was a gradient in microstructure based on distance from the fracture surface, shown in Fig. 6e–h. Along the fracture surface of the material, multiple sample morphologies were observed. In the regime where columnar features were observed in fractography (Fig. 6f), samples primarily showed brittle fracture through either transgranular or intergranular fracture. In regimes associated with necking, samples showed some equiaxed nanocrystalline grains with grain sizes on the order of 50 nm, smaller and more localized than those observed in Pt. While columnar grains tended to maintain their columnar structure and width, the grain boundary morphology had tilted to align with the plastic flow direction up to 2 μm from the fracture surface. A combination of surface (Fig. 6g) and sub-surface (Fig. 6f) intergranular cracking was observed, where the cracks were observed to arrest with total crack depths of less than 100 nm. At distances further than 2 μm from the fracture surface (Fig. 6h), the sample retained the as-sputtered grain structure.
MD simulations
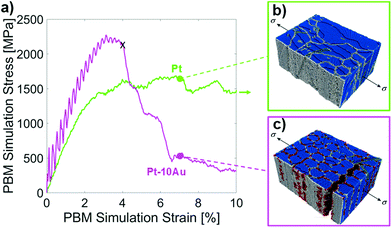
The deformation behavior of Pt and Pt-10Au at a total strain of 7% are illustrated in Fig. 7b and c. While the strength values were different due to differences in the boundary conditions, the qualitative ductility changes and corresponding mechanisms were consistent with that observed in the FSM simulations (as discussed in the following section); Pt displayed ductile behavior, dominated by grain growth, while Pt-10Au displayed little plastic deformation, and the material deformed primarily through the formation of nanocrack networks with little grain growth. As illustrated in Fig. 7c and observed in ESI Video E,† Pt-10Au ultimately failed by the coalescence of intergranular cracks. The lack of grain growth (consistently observed in the experiments and simulations) in the Pt-10Au samples attests to the stability of the microstructure.
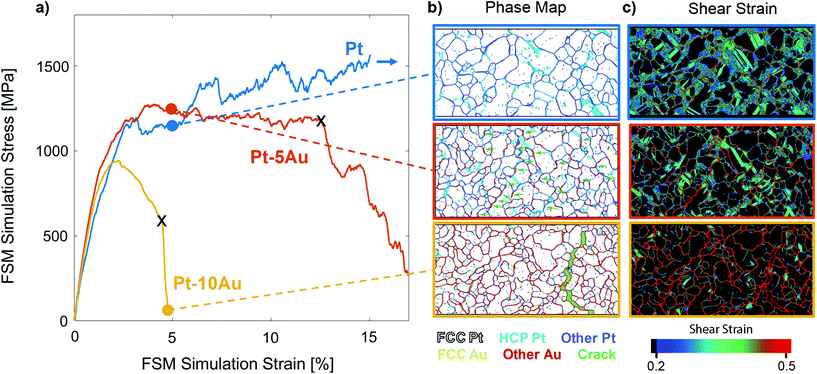 | ||
| Fig. 8 Tensile properties from the FSM simulations. Stress–strain curves in (a) show the tensile response of the Pt, Pt-5Au, and Pt-10Au samples. Phase maps with green arrows showing locations of arrested nanocracks for Pt-5Au (b) and shear strain maps (c) are shown for a total strain of 5% for each of the samples. In the phase maps, the microstructure can be observed as non-FCC regimes represent boundaries, identified by either dark blue (boundaries lacking Au), light blue (twin boundaries lacking Au), or red (boundaries rich in Au). In addition to showing microstructural differences, we also show intergranular cracks in green. Grain growth was clearly observed in pure Pt, and intergranular cracking was only observed in the Pt-5Au and Pt-10Au samples. In (c), the accumulated shear strain in each system is shown. Solid cyan sections indicate regions of dislocation activity, distorted dark blue sections indicate regions of grain boundary migration, and red sections indicate high strains at boundaries due to either decohesion, separation, or shear. The evolution of the phase and shear strain maps for each system are available as Videos C–H in the ESI.† | ||
The deformation behavior of Pt, Pt-5Au, and Pt-10Au in the FSM can be observed through both the phase maps and von Mises strain maps, illustrated at 5% strain for each sample in Fig. 8b and c. The evolution of each map throughout the entire test can be viewed in ESI Videos C–H.† Comparing the deformation-induced microstructural evolution of the three alloys reveals that there was a tendency for mechanically-induced grain growth in pure Pt which diminished with increasing Au concentration. This is illustrated in Fig. 8b, where at 5% strain, the average grain size decreased with increasing Au content. In the Pt sample at 5% strain, none of the original small grains remained and large grains were approximately 2–3 times their original size. For Pt-5Au, some grain growth was observed, albeit less than that of pure Pt (see Videos C and E in ESI†). The Pt-10Au sample showed almost no grain growth: the microstructure at 5% total strain was nearly identical to that of the unstrained sample. The mechanism for grain growth can be observed in the strain maps (Fig. 8c) and deformation videos (ESI Videos C–F†), where grain boundary migration, specifically of boundaries with low Au concentration, led to the consumption of smaller grains (and subsequent absorption into larger grains).
Increasing Au concentration was also correlated with decreasing dislocation activity, as can be observed in the strain maps (Fig. 8c). In all three materials, dislocations typically nucleated from one boundary at an angle allowing for a favorable shear stress for dislocation motion, and either stopped at or absorbed into the opposing boundary. In Pt, the dislocation activity was the highest of the three materials. With the addition of 5 at% Au, the dislocation activity was only slightly reduced, although boundary migration was markedly suppressed. Further increasing solute concentration to 10 at% Au, there was a significant decrease in dislocation activity compared to either Pt or Pt-5Au, and the sample fractured prior to any significant dislocation activity.
Mechanistically, the increasing Au concentration resulted in a higher tendency for intergranular cracking. In Pt, no stable nanocracking was observed up to strains of 17%. Intergranular cracks were observed to form in Pt-5Au at Au-rich boundaries at strains as low as 2% (see ESI Video E†). These cracks were observed to arrest, however, and failure through crack coalescence did not occur until a strain of 12%. A network of intergranular cracks in Pt-10Au formed at a similarly low strain of approximately 2% (see ESI Video G†). In Pt-10Au, however, cracks were observed to coalesce with failure at a strain of 4%. Note that in both of the Pt–Au samples, intergranular cracking caused stress to shed that produced apparent work softening; the rate of decrease was more gradual in the Pt-5Au compared to Pt-10Au.
Discussion
Mechanical properties
Since the primary goal of this manuscript is to understand how the alloy content in nanocrystalline Pt–Au influences the mechanical behavior, we primarily focus on the change in material properties with the added solute element when comparing the experiments and simulations. The quantitative discrepancies between the simulations and experiments can be attributed primarily to a difference in both time and length scales. The highest strengths were observed in the PBM simulations, where stresses above 2 GPa were observed for Pt-10Au. Both the experiments and FSM simulations show lower strengths, with maximum values approximately half of the PBM simulations. While the grain size and time scales in the FSM model were approximately the same as the PBM model, the relatively lower strengths of the former can be attributed to the higher deformation temperature (775 K) and Au migration to the free surfaces; since Au migration to boundaries is minimal in the sputtered films, the experimental results can be compared more directly to the PBM simulations. Both simulations tend to show lower moduli compared to the experiments, with the simulated moduli approximately half that of the experimental values, and even lower compared to expected literature modulus values for coarse-grained Pt–Au. These differences in modulus are thought to be largely attributable to the excess compliance of grain boundaries: the ratio of grain boundary area to sample volume is ∼1 μm−1 for a microcrystalline metal, ∼400 μm−1 for the columnar experimental samples, and >106 μm−1 for equiaxed 5 nm grains, similar to those studied in simulations.The experiments and both simulations reveal a tendency for modulus increasing with Au concentration. The increase in modulus observed in both the experiments and FSM model were 16% and 33% respectively. While this increase is qualitatively consistent with both simulation methods, it is notably opposite to the expected trend based on rule of mixtures, where 10% Au would be expected to result in a 9% decrease in modulus, highlighting the important effect of grain boundary bonding in the elastic behavior of nanocrystalline metals. It should be noted here that the elastic modulus will affect the overall toughness of the material, in the sense that the resilience (recoverable contribution to toughness in elastic regime) depends on a combination of both modulus and strength;62 in the case where yield strength remains unchanged and modulus increases, the resilience decreases, which contributes negatively to toughness.
Differences in initial yield behavior were seen in the experimental and simulated results. In both the PBM simulations and in situ experiments, an increase in resistance to yield is observed for Pt-10Au compared to pure Pt. This is not observed in the FSM simulations, however, which highlights how critical it is to consider how simulation parameters can influence perceived material properties. In this case, for example, an important consideration is that much of the Au migrated to the free surfaces in the FSM simulation. In addition to reducing the amount of Au within the Pt-rich region in the material, this creates layers of Au which contribute to the overall strength of the material, and if the strengths of these regions are lower than the nanocrystalline Pt–Au, it would be expected to lower the overall strength of the material. This may explain why the PBM simulations accurately reflect the yield strength trends observed in experiments while the FSM models do not.
The strengthening behavior in Pt-10Au (in the PBM models and in situ experiments) can be attributed to a combination of solid solution strengthening (both traditional and nanocrystalline) and grain boundary stabilization. Traditional solid solution strengthening occurs primarily when the solute atom radius is different than the solvent, leading to lattice distortions that impede dislocation motion.62 The atomic radius of Au (166 pm) is smaller than that of Pt (175 pm) by ∼5%, which may contribute to increases in strength in Pt-10Au less than ten MPa based on similar systems;63 systems with larger differences in atomic radii would lead to higher amounts of solid solution strengthening. Nanocrystalline solid solution strengthening occurs due to changes in the shear modulus and Burgers vector due to the presence of a solute, that can influence the flow stresses for boundary mediated plasticity at the nanoscale.47 The amount of strengthening due to this effect is increased at smaller grain sizes, and, based on the observed changes in elastic modulus, may be expected to contribute to additional increases in strength on the order of tens of MPa for the experimental grain size and tens to hundreds of MPa for the simulation grain size.
Some evidence for strengthening through grain boundary stabilization can be seen in the FSM simulations. This strengthening mechanism has been discussed previously by Rupert et al. in nanocrystalline Ni–W,64 where it was postulated that some of the strengthening observed in this system was due to the high W presence at grain boundaries leading to mechanical stability of the boundaries. Previous studies suggest that this strengthening may be due to the inhibition of grain boundary sliding or grain rotation due to the solute presence at grain boundaries.29 In the present study, the FSM simulation showed that Au segregation contributed to a suppression of grain boundary mediated grain growth, qualitatively consistent with the experimental observations. While Au additions in the present study provided stability against both thermal31 and mechanical grain boundary migration, this does not necessarily imply that the mechanism for growth is the same, nor that there is a causal relationship between thermal and mechanical stabilization.
In simulations and experiments, Au additions led to reduced ductility. Both FSM and PBM simulations indicated that pure Pt can withstand relatively high plastic strains (greater than 15% in the FSM simulation), by deforming primarily through grain boundary migration mediated grain growth. This is supported by the experiments, where Pt showed more extensive plasticity (necking) compared to Pt–Au, with grain growth as one of the observed deformation mechanisms. In Pt-10Au simulations, little plasticity was observed prior to fracture, and failure occurred at 4% strain. Again, this is supported by the experiments, where a tendency for brittle fracture was observed in the Pt–Au sample. As demonstrated in the FSM simulations, however, with smaller quantities of Au (Pt-5Au, specifically) the system was capable of withstanding considerable plastic deformation, reaching a strain of 12% prior to failure. The potential for intermediate Au concentrations to achieve some ductility enhancement can be explained by a competition of deformation mechanisms, specifically between grain boundary embrittlement and nanocrack toughening; the following sections discuss these in detail. Based on these competing mechanisms, a framework is presented by which nanocrystalline alloys show the potential to maintain or even improve in toughness despite the presence of an embrittling element.
Competing mechanisms: grain boundary embrittlement and crack arrest
In the in situ experiments and simulations for Pt-10Au, nearly all boundaries were Au-rich and intergranular crack formation only occurred at these boundaries. The observed nanocracking mechanism was consistent between FSM and PBM models despite differences in free surface effects, temperature, and strain-rate. Strong evidence that the Au segregation led to embrittlement can be found by investigating the FSM simulations in the Pt-5Au sample, where only the boundaries that contain a relatively high Au content show intergranular crack formation. Consistent with the previous work by Gibson and Schuh,36 this suggests weaker bonding along boundaries that are rich in Au compared to the internal grain regimes. Note that, as an extension of this concept, the lack of cracking at boundaries starved in Au suggests that these boundaries also have stronger bonding than those rich in Au. This is further highlighted by the pure Pt samples, which showed relatively high potential for plastic deformation (through primarily grain growth and dislocation motion) when compared to the Pt–Au samples. While intergranular cracking was observed in all Pt–Au simulations and experiments, embrittlement did not lead to immediate failure for any of the materials, but rather crack arrest was observed as discussed in the following section.
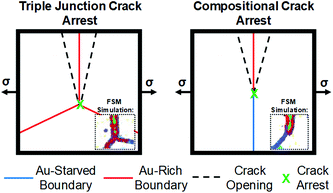
One potential mechanism, triple junction crack arrest (illustrated schematically in Fig. 9), occurs when a crack along one grain boundary intersects a triple junction and certain criteria are met: the grain boundary containing the crack must be Au-rich and have a normal which is nearly parallel to the loading direction; in this case there is maximum de-cohesive force on the boundary and weaker bonding at the boundary, leading to the brittle fracture mode discussed in the previous section. Once this crack intersects with a triple junction, the crack can arrest, due the reduced driving force for both intergranular propagation on the Au-rich inclined boundary or the increased resistance for transgranular propagation through the tougher Pt grain. This mechanism, observed to occur in both Pt-5Au and Pt-10Au in the FSM simulations, is similar to crack arrest at triple junctions observed in traditional steels and nickels,42,43 although in nanocrystalline metals there are many more sites for this arrest process, leading to finer scale nanocracks.
A previously unobserved crack arrest mechanism, compositional crack arrest, occurs when a boundary high in Au concentration intersects with a boundary which is either low or lacking in Au concentration; this is also shown schematically in Fig. 9. As with triple junction crack arrest, the grain boundary containing the initial crack must be Au rich and have a normal that is nearly parallel to the loading direction to promote crack formation. The crack then arrests at the boundary with low or no Au concentration, as this boundary has higher cohesion. Because this mechanism relies on a gradient in material composition along the grain boundaries, it requires heterogeneous segregation of the solute to boundaries, as was observed for all Pt–Au systems in this study. Since this mechanism relies on boundaries to be partially saturated in Au, it is necessary to consider whether such a system can physically exist. The possibility of such transformations at grain boundaries are a wetting phenomenon67,68 as discussed by Wynblatt and Chatain69 in analogy with surface miscibility gaps.70 The segregation behavior in nanoscale Pt–Au alloys has been examined in detail by both simulation and experimental observation by O'Brien, et al.52 where the presence of qualitatively similar segregation behavior is observed. In this study, while compositional crack arrest was observed to occur at several boundaries in Pt-10Au in the FSM model, it was most dominant in the Pt-5Au sample due to a higher density of Au-starved boundaries.
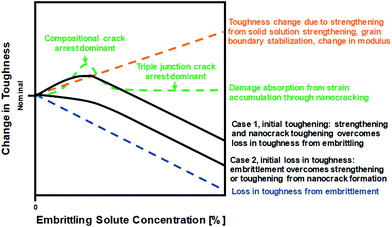
This study demonstrates that toughness of this material can be tuned, or potentially optimized, by changing the Au content. The total toughness can be attributed to the combined impact of embrittlement (that decreases toughness), energy dissipation through nanocrack network formation, and strengthening through solid solution strengthening and grain boundary stabilization (that can increase toughness) as well as modulus changes (which can either positively or negatively influence resilience and therefore toughness). The qualitative influence of these parameters on the toughness at varying alloy content for any binary system with an embrittling solute are represented schematically in Fig. 10. In the case where the loss in toughness from embrittlement is small compared to the gains from strengthening and nanocrack toughening, the material can potentially show an increase in total toughness with small quantities of the embrittling element (Case 1 in Fig. 10). Since compositional crack arrest was demonstrated to be more effective than triple junction crack arrest, it is expected that a maximum in toughness would occur in a regime where compositional crack arrest is dominant. In the case where the material quickly embrittles from increased solute content, however, the material could retain some initial toughness from compositional crack arrest, but would not be expected to show an increase in toughness compared to the pure metal (Case 2 in Fig. 10). Different binary alloys are expected to show different behavior, displaying either Case 1 or Case 2 toughening behavior depending on the relative effects of the solute.
Conclusion
As nanocrystalline metals are modified chemically to achieve enhanced thermal stability, it is necessary to also understand the synergistic or degrading effects of solute on mechanical performance. As demonstrated in the present study, Au is confirmed to act as an embrittling solute in Pt–Au, where it migrates to grain boundaries and promotes intergranular decohesion and fracture. Despite this, the material shows some potential for toughening through the formation of nanocrack networks in addition to dislocation and boundary migration mechanisms. The effects that these crack networks have on the fracture behavior depends on the Au content, which affects the competition between crack formation and crack arrest mechanisms.In the case where nearly all boundaries are saturated in Au, at a bulk concentration of ∼10 at% Au, the deformation is controlled primarily by a competition between grain boundary decohesion from Au embrittlement at boundaries and crack arrest at triple junctions. Simulations suggest the possibility that when the overall Au content is decreased and some boundaries have relatively low Au content, compositional crack arrest could become a potential toughening mechanism, where the cracks arrest and blunt at boundaries lacking in the embrittling element. These observations motivate the possibility for future studies to optimize solute content for both thermal stability and mechanical performance.
Conflicts of interest
There are no conflicts to declare.Acknowledgements
The authors acknowledge Dr Timothy Furnish for his insightful comments in the review of this manuscript. This work was funded by the United States Department of Energy, Office of Basic Energy Sciences (BES) (Grant No. 15013170), Division of Materials Science and Engineering. MC NA, PL, and DA were supported by a Laboratory Directed Research and Development project. Sandia National Laboratories is a multi-mission laboratory managed and operated by National Technology and Engineering Solutions of Sandia, LLC, a wholly owned subsidiary of Honeywell International, Inc., for the U.S. Department of Energy's National Nuclear Security Administration under contract DE-NA0003525. The authors acknowledge use of microscopy facilities at the Center for Integrated Nanotechnologies, an Office of Science User Facility operated for the U.S. Department of Energy (DOE) Office of Science by Sandia National Laboratories (Contract DE-NA-0003525). Any subjective views or opinions that might be expressed in the paper do not necessarily represent the views of the U.S. Department of Energy or the United States Government.References
- M. A. Meyers, A. Mishra and D. J. Benson, Prog. Mater. Sci., 2006, 51, 427–556 CrossRef CAS.
- T. Nieh and J. Wadsworth, Scr. Metall. Mater., 1991, 25, 955–958 CrossRef CAS.
- J. Weertman, Mater. Sci. Eng., A, 1993, 166, 161–167 CrossRef.
- C. Carlton and P. Ferreira, Acta Mater., 2007, 55, 3749–3756 CrossRef CAS.
- V. Y. Gertsman and R. Birringer, Scr. Metall. Mater., 1994, 30, 577–581 CrossRef CAS.
- M. Ames, J. Markmann, R. Karos, A. Michels, A. Tschöpe and R. Birringer, Acta Mater., 2008, 56, 4255–4266 CrossRef CAS.
- J. Eckert, J. Holzer and W. Johnson, J. Appl. Phys., 1993, 73, 131–141 CrossRef CAS.
- H. Natter, M. Schmelzer and R. Hempelmann, J. Mater. Res., 1998, 13, 1186–1197 CrossRef CAS.
- U. Klement, U. Erb, A. El-Sherik and K. Aust, Mater. Sci. Eng., A, 1995, 203, 177–186 CrossRef.
- P. G. Sanders, J. Eastman and J. Weertman, Acta Mater., 1997, 45, 4019–4025 CrossRef CAS.
- E. Ma, Scr. Mater., 2003, 49, 663–668 CrossRef CAS.
- M. Morris-Munoz, A. Dodge and D. G. Morris, Nanostruct. Mater., 1999, 11, 873–885 CrossRef CAS.
- X. Zhang and A. Misra, Scr. Mater., 2012, 66, 860–865 CrossRef CAS.
- O. Anderoglu, A. Misra, H. Wang and X. Zhang, J. Appl. Phys., 2008, 103, 094322 CrossRef.
- K. Lu, L. Lu and S. Suresh, Science, 2009, 324, 349–352 CrossRef CAS PubMed.
- D. Witkin, Z. Lee, R. Rodriguez, S. Nutt and E. Lavernia, Scr. Mater., 2003, 49, 297–302 CrossRef CAS.
- Y. Wang, M. Chen, F. Zhou and E. Ma, Nature, 2002, 419, 912 CrossRef CAS PubMed.
- O. Sitdikov, E. Avtokratova, R. Babicheva, T. Sakai, K. Tsuzaki and Y. Watanabe, Mater. Trans., 2012, 53, 56–62 CrossRef CAS.
- Z. Pan and T. J. Rupert, Acta Mater., 2015, 89, 205–214 CrossRef CAS.
- A. Khalajhedayati, Z. Pan and T. J. Rupert, Nat. Commun., 2016, 7, 10802 CrossRef CAS PubMed.
- J. D. Schuler, O. K. Donaldson and T. J. Rupert, Scr. Mater., 2018, 154, 49–53 CrossRef CAS.
- T. Chookajorn, H. A. Murdoch and C. A. Schuh, Science, 2012, 337, 951–954 CrossRef CAS PubMed.
- J. Weissmüller, Nanostruct. Mater., 1993, 3, 261–272 CrossRef.
- R. Kirchheim, Acta Mater., 2002, 50, 413–419 CrossRef CAS.
- P. C. Millett, R. P. Selvam and A. Saxena, Acta Mater., 2007, 55, 2329–2336 CrossRef CAS.
- J. R. Trelewicz and C. A. Schuh, Phys. Rev. B: Condens. Matter Mater. Phys., 2009, 79, 094112 CrossRef.
- A. Michels, C. Krill, H. Ehrhardt, R. Birringer and D. Wu, Acta Mater., 1999, 47, 2143–2152 CrossRef CAS.
- A. J. Detor and C. A. Schuh, Acta Mater., 2007, 55, 371–379 CrossRef CAS.
- R. I. Babicheva, S. V. Dmitriev, L. Bai, Y. Zhang, S. W. Kok, G. Kang and K. Zhou, Comput. Mater. Sci., 2016, 117, 445–454 CrossRef CAS.
- R. I. Babicheva, S. V. Dmitriev, Y. Zhang, S. W. Kok, N. Srikanth, B. Liu and K. Zhou, Comput. Mater. Sci., 2015, 98, 410–416 CrossRef CAS.
- J. F. Curry, T. F. Babuska, T. A. Furnish, P. Lu, D. P. Adams, A. B. Kustas, B. L. Nation, M. T. Dugger, M. Chandross and B. G. Clark, Adv. Mater., 2018, 1802026 CrossRef PubMed.
- J. W. Martin, J. W. Martin, R. D. Doherty and B. Cantor, Stability of microstructure in metallic systems, Cambridge University Press, 1997 Search PubMed.
- C. Koch, R. Scattergood, K. Darling and J. Semones, J. Mater. Sci., 2008, 43, 7264–7272 CrossRef CAS.
- R. I. Babicheva, D. V. Bachurin, S. V. Dmitriev, Y. Zhang, S. W. Kok, L. Bai and K. Zhou, Philos. Mag., 2016, 96, 1598–1612 CrossRef CAS.
- R. I. Babicheva, S. V. Dmitriev, D. V. Bachurin, N. Srikanth, Y. Zhang, S. W. Kok and K. Zhou, Int. J. Fatigue, 2017, 102, 270–281 CrossRef CAS.
- M. A. Gibson and C. A. Schuh, Acta Mater., 2015, 95, 145–155 CrossRef CAS.
- M. Herbig, D. Raabe, Y. Li, P. Choi, S. Zaefferer and S. Goto, Phys. Rev. Lett., 2014, 112, 126103 CrossRef CAS PubMed.
- Y. Wang, S. Cheng, Q. Wei, E. Ma, T. Nieh and A. Hamza, Scr. Mater., 2004, 51, 1023–1028 CrossRef CAS.
- R. Messmer and C. Briant, Acta Metall., 1982, 30, 457–467 CrossRef CAS.
- W. Johnson, J. Doherty, B. Kear and A. Giamei, Scr. Metall., 1974, 8, 971–974 CrossRef CAS.
- D. Bika, J. Pfaendtner, M. Menyhard and C. McMahon Jr., Acta Metall. Mater., 1995, 43, 1895–1908 CrossRef CAS.
- M. Arafin and J. Szpunar, Corros. Sci., 2009, 51, 119–128 CrossRef CAS.
- V. Y. Gertsman and S. M. Bruemmer, Acta Mater., 2001, 49, 1589–1598 CrossRef CAS.
- S. G. Bratsch, J. Phys. Chem. Ref. Data, 1989, 18, 1–21 CrossRef CAS.
- F. Dalla Torre, H. Van Swygenhoven and M. Victoria, Acta Mater., 2002, 50, 3957–3970 CrossRef CAS.
- C. Koch, Nanostruct. Mater., 1997, 9, 13–22 CrossRef CAS.
- T. J. Rupert, J. C. Trenkle and C. A. Schuh, Acta Mater., 2011, 59, 1619–1631 CrossRef CAS.
- G. Cliff and G. W. Lorimer, J. Microsc., 1975, 103, 203–207 CrossRef.
- B. L. Boyce, S. L. Kramer, H. E. Fang, T. E. Cordova, M. K. Neilsen, K. Dion, A. K. Kaczmarowski, E. Karasz, L. Xue and A. J. Gross, Int. J. Fract., 2014, 186, 5–68 CrossRef.
- B. Boyce, S. Kramer, T. Bosiljevac, E. Corona, J. Moore, K. Elkhodary, C. Simha, B. Williams, A. Cerrone and A. Nonn, Int. J. Fract., 2016, 198, 5–100 CrossRef CAS.
- C. O'Brien, Z. Rák and D. W. Brenner, J. Phys.: Condens. Matter, 2013, 25, 445008 CrossRef PubMed.
- C. J. O'Brien, C. M. Barr, P. M. Price, K. Hattar and S. M. Foiles, J. Mater. Sci., 2018, 53, 2911–2927 CrossRef.
- S. Plimpton, P. Crozier and A. Thompson, Sandia Natl. Lab., 2007, 18, 43 Search PubMed.
- S. M. Foiles, Simulation of Equilibrium Segregation in Alloys Using the Embedded Atom Method Book: MRS Proceedings, in Computer-Based Microscopic Description of the Structure and Properties of Materials, ed. J. Broughton, W. Krakow and S. T. Pantelides, 1986, vol. 63, pp. 61–66 Search PubMed.
- S. M. Foiles, Phys. Rev. B: Condens. Matter Mater. Phys., 1989, 40, 11502 CrossRef CAS.
- T. Tsong, Y. S. Ng and S. McLane Jr., J. Chem. Phys., 1980, 73, 1464–1468 CrossRef CAS.
- Y. S. Ng, T. Tsong and S. McLane Jr., Surf. Sci., 1979, 84, 31–53 CrossRef CAS.
- W. R. Lanning, S. S. Javaid and C. L. Muhlstein, Fatigue Fract. Eng. Mater. Struct., 2017, 40, 1809–1824 CrossRef CAS.
- W. D. Callister, Google Scholar, 1997.
- J. A. Sharon, H. A. Padilla and B. L. Boyce, J. Mater. Res., 2013, 28, 1539–1552 CrossRef CAS.
- J. Sharon, P. Su, F. Prinz and K. Hemker, Scr. Mater., 2011, 64, 25–28 CrossRef CAS.
- D. McLean, Mechanical properties of metals, Krieger Pub Co, 1977 Search PubMed.
- W. D. Callister and D. G. Rethwisch, Materials science and engineering, John Wiley & Sons NY, 2011 Search PubMed.
- T. J. Rupert, J. R. Trelewicz and C. A. Schuh, J. Mater. Res., 2012, 27, 1285–1294 CrossRef CAS.
- Y. Fu and A. Evans, Acta Metall., 1985, 33, 1515–1523 CrossRef.
- A. Evans and Y. Fu, Acta Metall., 1985, 33, 1525–1531 CrossRef.
- J. W. Cahn, J. Chem. Phys., 1977, 66, 3667–3672 CrossRef CAS.
- J. W. Cahn, Phys. A, 2000, 279, 195–202 CrossRef.
- P. Wynblatt and D. Chatain, Mater. Sci. Eng., A, 2008, 495, 119–125 CrossRef.
- P. Wynblatt and Y. Liu, J. Vac. Sci. Technol., A, 1992, 10, 2709–2717 CrossRef CAS.
Footnote |
| † Electronic supplementary information (ESI) available. See DOI: 10.1039/c8nr06419a |
| This journal is © The Royal Society of Chemistry 2018 |

