 Open Access Article
Creative Commons Attribution 3.0 Unported Licence
Large-scale dewetting assembly of gold nanoparticles for plasmonic enhanced upconversion nanoparticles†
Christian
Clarke
 a,
Deming
Liu
b,
Fan
Wang
 a,
Yongtao
Liu
a,
Chaohao
Chen
a,
Yongtao
Liu
a,
Chaohao
Chen
 a,
Cuong
Ton-That
*a,
Xiaoxue
Xu
*a and
Dayong
Jin
 *ac
*ac
aInstitute for Biomedical Materials and Devices, Faculty of Science, University of Technology Sydney, NSW 2007, Australia. E-mail: dayong.jin@uts.edu.au; xiaoxuehelen.xu@uts.edu.au; cuong.ton-that@uts.edu.au
bDepartment of Chemistry and Biochemistry, Concordia University, Montréal, QC H4B 1R6, Canada
cARC Research Hub for Integrated Device for End-user Analysis at Low-levels (IDEAL), Faculty of Science, University of Technology Sydney, NSW 2007, Australia
First published on 6th March 2018
Abstract
Plasmonic nanostructures have been broadly investigated for enhancing many photophysical properties of luminescent nanomaterials. Precisely controlling the distance between the plasmonic nanostructure and the luminescent material is challenging particularly for the large-scale production of individual nanoparticles. Here we report an easy and reliable method for the large-scale dewetting of plasmonic gold nanoparticles onto core–shell (CS) upconversion nanoparticles (UCNPs). A commensurate NaYF4 shell with a thickness between 5 nm and 15 nm is used as a tunable spacer to control the distance between the UCNP and the plasmonic gold nanoparticles. The upconversion emission intensity of single gold decorated core–inert shell (Au–CS) UCNPs is quantitatively characterized using a scanning confocal microscope. The results demonstrate the highest feasible enhancement of upconversion emission and a record reduction in lifetime for UCNPs fabricated in this manner. The Au–CS UCNPs are further investigated by simulation and synchrotron near edge X-ray absorption fine structure (NEXAFS) analysis.
1. Introduction
The sequential absorption of two or more low energy photons to emit one higher energy photon is the process referred to as photon upconversion.1 The current upconversion research is focused on developing upconversion nanoparticles (UCNPs),2 with sizes in the range of 5 to 100 nm for applications such as bioimaging,3,4 biosensing,5 nanoscopy, theranostics, anti-counterfeiting, displays and photovoltaics.6 One of the most efficient UCNP materials, lanthanide ion (Ln3+) doped β-NaYF4 host nanocrystals, still suffers a low quantum yield (ϕ < 5%),7 which is far lower than the theoretical value for the two-photon process of upconversion (ϕ = 50%),8 limiting the practical applications of UCNPs.To address this issue, a number of methods have been applied to enhance upconversion emission including host lattice manipulation, surface passivation, energy transfer modulation, broadband sensitization, surface plasmon coupling and photonic crystal engineering.9 Plasmonic nanoparticles of noble metals such as gold (Au) and silver (Ag) with tunable visible light absorption and scattering are frequently used to couple with UCNPs to enhance their upconversion emission. This plasmonic enhancement is typically dependent on the size, shape and composition of the noble metal nanoparticles used as well as the distance between the UCNPs and noble metal nanoparticles.10,11 These factors have led to both Au and Ag being used for plasmonic coupling in the forms of spherical nanoparticles,12 nanowires,13 nanoislands14 and lithographically patterned nanoarrays.15
In this work, Au is easily produced into uniform spherical nanoparticles by sputtering, thermal annealing and dewetting. Dewetting is the disaggregation of a thin film into discrete particles, mediated by a minimisation of surface energy.16 This dewetting method allows the shape and size of the Au nanoparticles to be precisely controlled on a large scale so that their plasmon resonance can be tuned to match the emission wavelength of Er3+ emitters in NaYF4 UCNPs17 by simply varying the film thickness, annealing temperature and annealing time.18,19 Secondarily, the annealing during the dewetting of the Au onto the surface of the CS UCNPs promotes the diffusion of Ln3+ dopants within the UCNPs, reducing internal crystal defects which can lead to an increased quantum efficiency.20
The design, consisting of an optically active UCNP core, an inert shell spacer and satellite plasmonic Au nanoparticles decorated on the shell, is chosen to suit the dewetting method for a large-scale assembly of Au nanoparticles onto single and mono-dispersed hybrid CS UCNPs. Fundamental to this design is the spacer which is vital for minimising the non-radiative energy transfer which causes luminescence quenching due to the direct contact of the UCNPs with the Au nanoparticle surface.12
From this design, similar structures have been previously fabricated including both metal core–spacer–UC shell nanoparticles21–23 and UC core–spacer–metal shell nanoparticles24,25 as summarised in Table S1.† However, these previous studies relied exclusively on a spacer of metal, polymer or SiO2 for attaching the Au nanoparticles by solution processing, which inhibits the plasmonic enhancement of luminescence due to the apparent parasitic absorption by these materials at the thicknesses required for optimum enhancement.26,27
This limitation is overcome in this work by a third enhancement method using an undoped inert crystal shell. The thickness of inert shells is highly controllable and can be varied, allowing nanometre control by adjusting the concentration and amount of the shell precursor added during the epitaxial growth.28–30 Inert shells of the host crystal (NaYF4 devoid of Ln3+) are employed to achieve both a reduction in surface defects to enhance the luminescence31 and functionality as the spacer in the design. To the authors’ knowledge, this integrated method constitutes the first combination of core–shell UCNPs, annealing and plasmonic enhancement in a single process to produce a singularly enhanced UCNP.
2. Results and discussion
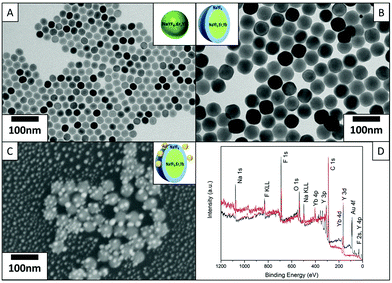
Fig. 1(A) shows the TEM images of the core UCNPs with an average diameter of 25 nm. The core UCNPs are well-dispersed nanoparticles with a highly morphological uniformity. Fig. 1(B) and Fig. S1(A & C)† show the CS UCNPs with an inert NaYF4 shell coating of thicknesses 5 nm, 10 nm and 15 nm respectively; thus, the formed uniform CS UCNPs are of sizes 35 nm, 45 nm and 55 nm. The ellipsoid shape of the 35 nm CS UCNPs is due to the longitudinal preference of the epitaxial growth, which is especially pronounced when thin shell coatings are grown. This variation in the UCNP diameter of the near-spherical UCNPs is within 2 nm, significantly smaller than the incremental step (5 nm) in the varied shell thickness. The dewetted Au nanoparticles shown in Fig. S1(B)† are uniformly scattered on the substrate having an average size of 15 nm. The Au–CS UCNPs in Fig. 1(C) show the typical morphology of the dewetted Au onto the surface of CS UCNPs. The CS UCNPs have not undergone any morphology change while the Au nanoparticles have directly dewetted onto the surface of the UCNPs and the desired structure of Au–CS UCNPs is produced. Fig. S1(D)† shows an additional image of the same sample as shown in Fig. 1(C) of the Au–CS UCNPs, and it highlights that the method can produce well-dispersed single Au–CS UCNPs. The far separated CS UCNPs coated with Au can be used directly for single nanoparticle luminescence measurement. XPS survey spectra of both 55 nm CS UCNPs and the as-obtained Au–CS UCNPs after dewetting in Fig. 1(D) confirm the composition of the samples. The presence of Na, Y, F and Yb in both spectra can be attributed to the CS UCNPs and the C and O peaks result from adventitious carbon.32 The additional Au peak is only present in the Au–CS UCNPs after dewetting. High surface density samples were prepared for XPS on a Si substrate. The absence of Si signals in both spectra indicates that XPS signals arise from the UCNP films with no contributions from the silicon substrate. As a result, the entire Au signal is detected from the dewetted Au nanoparticles on the CS UCNPs rather than Au dewetted on the surface of the substrate.The dewetting treatment at 400 °C for 1 hour is not only crucial to convert the Au film into discrete nanoparticles of specific size18 on the CS UCNPs surface, but it is also the optimum condition to prevent the CS UCNPs from aggregating and changing the phase. The XRD characterization in Fig. S2(C)† on the CS UCNPs before and after annealing at 400 °C for 1 hour shows that the CS UCNPs retain their β phase.33,34
To investigate the effect of annealing on the diffusion of Er and Yb dopants within the CS UCNPs, Near Edge X-ray Absorption Fine Structure (NEXAFS) analysis was conducted at the Australia Synchrotron. NEXAFS analysis in partial electron yield (PEY) and total fluorescent yield (TFY) using a modified procedure35 was performed to measure the re-distribution of the Er and Yb dopants in the CS UCNPs due to the annealing process. Fig. 2(A & C) shows NEXAFS spectra in TFY mode which probes the entire UCNP volume. The TFY intensity for both Er (Fig. 2A) and Yb (Fig. 2C) before and after annealing is the same, and this indicates that for both samples, the surface coverage of UCNPs on the substrate is approximately equal. In PEY mode, the NEXAFS spectra are being primarily generated from only the shell volume allowing for any change in the distribution of the dopants to be identified. For both Er (Fig. 2B) and Yb (Fig. 2D) after annealing, there is an increase in the intensity in the PEY spectrum. This suggests a denser Yb and Er dopant distribution towards the surface of the CS UCNPs after annealing, indicating that both dopants have diffused further from the core towards the inert shell during the annealing process. The driving force for the diffusion would be the concentration gradient of the dopant from the core nanocrystal to the inert shell accelerated under the annealing conditions. As the surface coverage was approximately equal, the relative increase of dopants diffused towards the shell after annealing can be estimated to be a factor of 3.8 and 4.4 for Er and Yb, respectively. As expected, the increase in Yb is higher than Er due to the higher concentration gradient of Yb to Er (20% to 2%) across the CS UCNPs. The same result was demonstrated by the CS UCNPs and Au–CS UCNPs with a 15 nm shell. The results are shown in Fig. S2,† in which a relative increase in Yb after annealing is estimated to be a factor of 1.9.
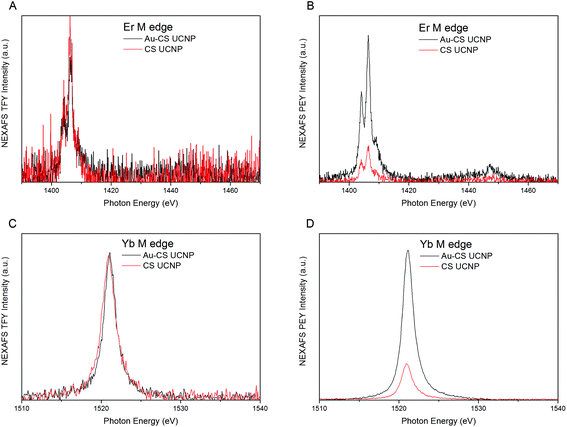 | ||
| Fig. 2 NEXAFS spectra for Er M edge and Yb M edge of the CS UCNPs with a 5 nm shell before (CS UCNP) and after annealing (Au–CS UCNP) in TFY (A & C) and PEY (B & D) modes. | ||
The diffusion of the dopant ions from the core UCNPs to the inert shell firstly produces a reduced effective distance between the Au nanoparticles on the inert shell and the active core UCNPs. Concurrently, this diffusion also confirms that the annealing has facilitated an increase in the diffusion coefficient of the Ln3+ dopants producing an improved and refined crystal from internal defect removal during diffusion.20,34
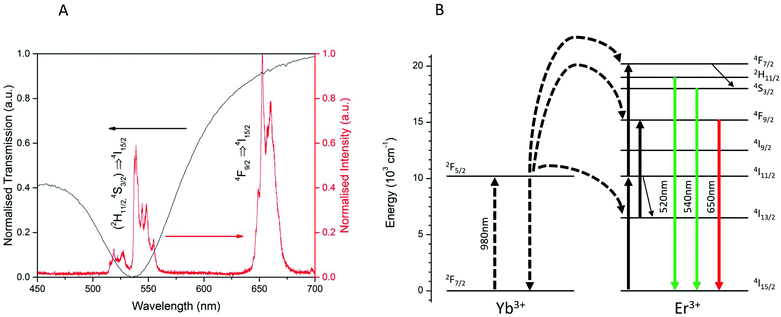
To study the surface plasmon resonance of the Au–CS UCNPs system, the luminescent emission of CS UCNPs and the optical transmission of the dewetted Au nanoparticles were characterized. As shown in Fig. 3(A), the Au nanoparticles of size 15 nm produced from dewetting show a broad absorption peaked at 540 nm. The luminescent emission of the CS UCNPs shows the green emission at 525 nm and 540 nm and the red emission at 650 nm and 660 nm. The surface plasmon resonance of the Au nanoparticles overlaps precisely with the green emissions which are the radiative transitions of (2H11/2,4S3/2) → 4I15/2 of Er3+ from the UCNPs as shown in Fig. 3(B).
To investigate the luminescence performance of the Au–CS UCNPs, the emission intensity of single CS UCNPs, annealed CS UCNPs and assembled Au–CS UCNPs were recorded using a purpose-built scanning confocal microscopy system for single nanoparticles.36,37 The scanned images of Fig. 4 show the single nanoparticle emission images of the core UCNPs (A), CS UCNPs with a 5 nm, 10 nm and 15 nm inert shell (B–D), core Au–UCNPs (E), and Au–CS UCNPs with a 5 nm, 10 nm and 15 nm inert shell (F–H), respectively. Fig. S3† additionally shows the annealed CS UCNPs scanned images of the core UCNPs (A), and CS UCNPs with a 5 nm, 10 nm and 15 nm inert shell (B–D) after annealing under identical conditions but without an Au film. Single UCNPs can be reliably identified using this method due to their near identical emission intensity. The summary of these emission intensity measurements in Fig. 4(I) has the CS UCNPs’ emission enhancement saturated at a shell thickness of 5 nm and above as reported previously,31 while the luminescence intensity of the annealed CS UCNPs without Au displays an insignificant variation to the CS UCNPs with increasing shell thickness. This result is expected from the XRD results in Fig. S2(C)† that show the annealed CS UCNPs retained their β phase. It also suggests that any luminescence enhancement resulting from the improved crystal quality obtained by the reduction of internal defects during the diffusion of dopants as demonstrated by the NEXAFS results in Fig. 2 has been effectively cancelled out by the increase in the distance between the dopant Yb and Er ions this diffusion would cause. This increase in distance between the dopant ions would reduce the probability of energy transfer between Yb–Yb and Yb–Er reducing upconversion emission.
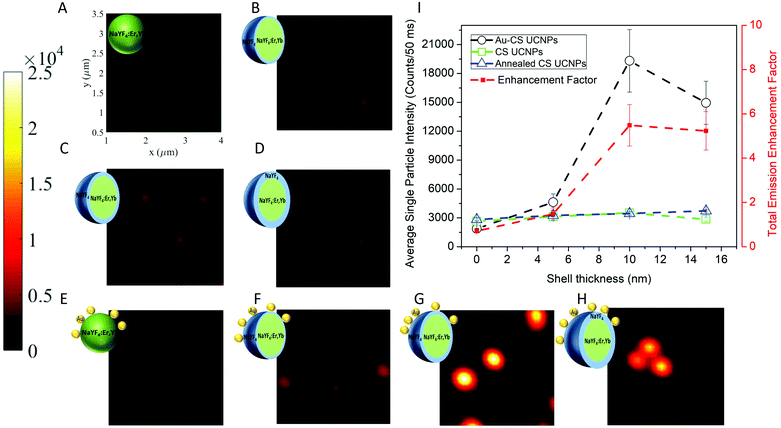 | ||
| Fig. 4 The scanning confocal images of the core UCNPs (A), CS UCNPs with a 5 nm, 10 nm and 15 nm inert shell (B–D), and core Au–UCNPs (E), Au–CS UCNPs with a 5 nm, 10 nm and 15 nm inert shell (F–H), respectively. Each scanned image is 3 μm × 3 μm as indicated in (A) and the colour bar indicates the emission intensity range of the single UCNPs. Single UCNP total emission intensity and enhancement factor (I) for CS UCNPs (A–D), Au–CS UCNPs (E–H) and annealed CS UCNPs (Fig. S3A–D†). The laser power was fixed at 20 mW, which was measured at the objective back aperture. | ||
On the other hand, the luminescence intensity of the CS UCNPs decorated with dewetted Au nanoparticles (Au–CS UCNPs) demonstrates a clear dependence on the shell thickness. A maximum enhancement factor of 5.5 for total emission is achieved by the 10 nm shell Au–CS UCNPs. This maximum enhancement factor at a separation of 10 nm is consistent with the simulation results in Liu's work.38 These simulations ascribe the total enhancement (ftot) from the Au nanoparticle to be a product of the excitation enhancement from the local E-field intensity (E) and the emission enhancement from the increased Purcell factor (F) plus antenna efficiency (ηa). As ηa is related to the initial quantum efficiency (η0) of the UCNPs, ftot from the Au nanoparticle is highly dependent on the η0 of the UCNPs, with a higher η0 resulting in substantially lower total enhancement factors, i.e. η0 = 0.1% and ftot = 30 vs. η0 = 10.0% and ftot = 5. The coating of an inert shell onto a UCNP increases the quantum efficiency by reducing surface defects,6,8 so does the annealing of certain UCNPs by reducing internal defects.20 In this work, both processes are applied cooperatively to the UCNPs. Simulations of the initial quantum efficiency attenuation to the internal defect density in Fig. S4(B)† show that the η0 of UCNPs is highly dependent on the density of internal defects. This explains the modest total enhancement factor of 5.5 to be a value approaching the highest feasible factor achievable for the already highly efficient annealed CS UCNPs.
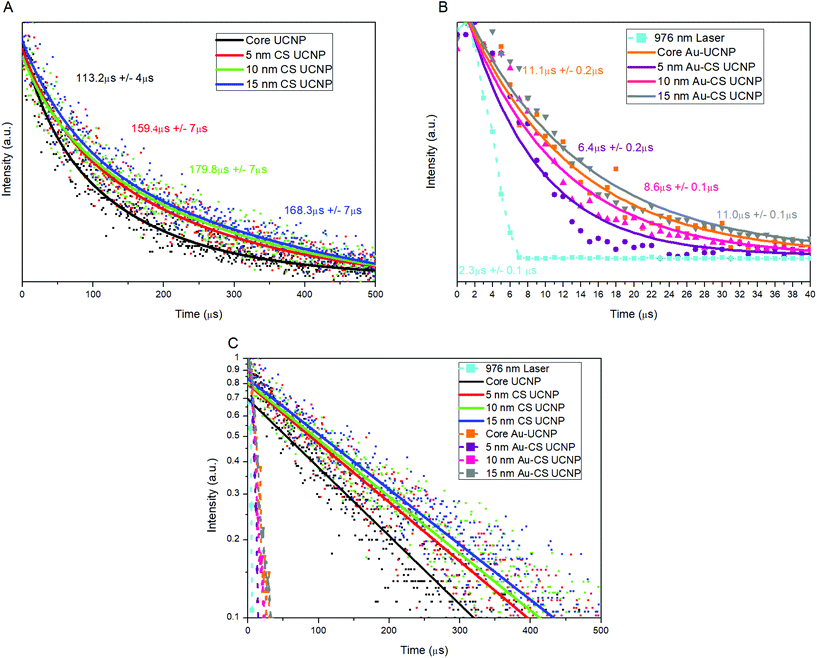
To further verify the surface plasmonic effect of Au nanoparticles on the CS UCNPs, we compared the lifetime of the single CS UCNPs and Au–CS UCNPs. The CS UCNPs display in Fig. 5(A) a common trend of increased lifetime with increasing shell thickness due to the nature of the lifetime of the Yb3+ 2F5/2 energy level increasing continuously with the inert shell thickness as non-radiative surface-quenching processes become passivated more effectively. This increased Yb3+ 2F5/2 lifetime allows more time for the excitation energy to migrate through the nanocrystal, increasing the probability of energy transfer to an Er3+.31 For all Au–CS UCNPs, a significant reduction in total lifetime was observed as shown in Fig. 5(B). The total lifetime of the Au–CS UCNPs was reduced at a maximum by a factor of 25, and this magnitude is clearly shown in Fig. 5(C). This approached the same magnitude as the lifetime of the laser used in the system measured at 2.3 μs to verify the sensitivity of the system.
The decrease in emission lifetime for all Au–CS UCNPs is significant being among the highest recorded for plasmonic coupling39,40 demonstrating the competition between two processes occurring, the Purcell effect and quenching from Förster-type energy transfer (FRET).41 The first process is the Purcell effect, which can increase the radiative recombination rate of an emitter by increasing the local density of transition states, thereby enhancing the emission intensity and reducing the emission lifetime. For upconversion emitters, e.g. Er3+, the intrinsic non-radiative recombination rate is much faster than the radiative decay rate,42 thus the change in the total lifetime of the emitter is dominated by the change in its radiative rate. Therefore, the total lifetime of Au–CS UCNPs is dramatically reduced, as its emission wavelength matches with the plasmonic resonance of the Au nanoparticles as shown in Fig. 3(A), which is consistent with previous research.43
Förster-type energy transfer (FRET) is the other process where the carriers on the emitter's energy level directly interact with the Au nanoparticles, leading to a reduction in both the emission intensity and lifetime through increasing the non-radiative rate. FRET is still significant when the effective separation distance between the dewetted Au nanoparticles and Er3+ emitters is below 15 nm (ref. 38), especially for the Au–CS UCNPs due to the direct contact of Au nanoparticles with the surface of the CS UCNP NaYF4 host material.
The competition between the Purcell effect and FRET has been explored in the Au–CS UCNPs through the lifetime measurements. As a result of the competition, the lifetime of Au–UCNPs (11 μs) is longer than that of the Au–CS UCNPs with a shell thickness of 5, 10 and 15 nm, as shown in Fig. 5(B). As the shell thickness is increased to 15 nm, the influence of FRET starts to diminish; however, the lifetime of the Au CS UCNPs is still an order of magnitude lower than the CS UCNPs lifetime, indicating that the Purcell effect dominates over the FRET. Further evidence of the dominant role of the Purcell effect is the decreased intensity in Fig. 4(I) and the increased lifetime in Fig. 5(B) and (C), as the shell thickness is increased beyond 10 nm on the Au–CS UCNPs. The thicker shell will reduce the Purcell effect, thereby reducing the radiative recombination rate, which leads to a decrease in intensity and an increase in lifetime.
3. Conclusion
The novel combination of CS UCNP synthesis, thermal annealing and dewetting of Au explored in this work produces Au–CS UCNPs that exhibit the optimized plasmonic enhanced single particle upconversion emission. This enhancement is strongly dependent upon the thickness of the inert shell with a maximum enhancement factor of 5.5 in total emission intensity achieved by the 10 nm shell Au–CS UCNPs. The design and integrated method of fabrication of these Au–CS UCNPs represents a new direction in the research on the plasmonic enhancement of upconversion emission.Conflicts of interest
The authors declare no competing financial interest.Acknowledgements
XPS and NEXAFS measurements were undertaken on the Soft X-ray Spectroscopy beamline at the Australian Synchrotron. We wish to acknowledge the technical assistance of Drs Bruce Cowie and Anton Tadich. This project was primarily supported by the Australian Government Research Training Program Scholarship (Christian Clarke) and China Scholarship Council CSC scholarships (Chaohao Chen: No. 201607950009 and Yongtao Liu: No. 201607950010).References
- F. Auzel, Chem. Rev., 2004, 104, 139–174 CrossRef CAS PubMed.
- S. Gai, C. Li, P. Yang and J. Lin, Chem. Rev., 2013, 114, 2343–2389 CrossRef PubMed.
- M. Nyk, R. Kumar, T. Y. Ohulchanskyy, E. J. Bergey and P. N. Prasad, Nano Lett., 2008, 8, 3834–3838 CrossRef CAS PubMed.
- L. Cheng, K. Yang, Y. Li, X. Zeng, M. Shao, S.-T. Lee and Z. Liu, Biomaterials, 2012, 33, 2215–2222 CrossRef CAS PubMed.
- L. Wang, R. Yan, Z. Huo, L. Wang, J. Zeng, J. Bao, X. Wang, Q. Peng and Y. Li, Angew. Chem., Int. Ed., 2005, 44, 6054–6057 CrossRef CAS PubMed.
- J. C. Goldschmidt and S. Fischer, Adv. Opt. Mater., 2015, 3, 510–535 CrossRef CAS.
- M. Pokhrel, A. Kumar Gangadharan and D. K. Sardar, Mater. Lett., 2013, 99, 86–89 CrossRef CAS.
- J.-C. Boyer and F. C. Van Veggel, Nanoscale, 2010, 2, 1417–1419 RSC.
- S. Han, R. Deng, X. Xie and X. Liu, Angew. Chem., Int. Ed., 2014, 53, 11702–11715 CrossRef CAS PubMed.
- S. Fischer, F. Hallermann, T. Eichelkraut, G. von Plessen, K. W. Krämer, D. Biner, H. Steinkemper, M. Hermle and J. C. Goldschmidt, Opt. Express, 2012, 20, 271–282 CrossRef CAS PubMed.
- S. Fischer, D. Kumar, F. Hallermann, G. von Plessen and J. C. Goldschmidt, Opt. Express, 2016, 24, A460–A475 CrossRef CAS PubMed.
- S. Schietinger, T. Aichele, H.-Q. Wang, T. Nann and O. Benson, Nano Lett., 2009, 10, 134–138 CrossRef PubMed.
- W. Feng, L.-D. Sun and C.-H. Yan, Chem. Commun., 2009, 4393–4395 RSC.
- H. Zhang, D. Xu, Y. Huang and X. Duan, Chem. Commun., 2011, 47, 979–981 RSC.
- H. P. Paudel, L. Zhong, K. Bayat, M. F. Baroughi, S. Smith, C. Lin, C. Jiang, M. T. Berry and P. S. May, J. Phys. Chem. C, 2011, 115, 19028–19036 CAS.
- C. M. Müller and R. Spolenak, Acta Mater., 2010, 58, 6035–6045 CrossRef.
- R. Gupta, M. Dyer and W. Weimer, J. Appl. Phys., 2002, 92, 5264–5271 CrossRef CAS.
- C. Worsch, M. Kracker, W. Wisniewski and C. Rüssel, Thin Solid Films, 2012, 520, 4941–4946 CrossRef CAS.
- M. Kracker, C. Worsch, C. Bocker and C. Rüssel, Thin Solid Films, 2013, 539, 47–54 CrossRef CAS.
- N. C. Dyck, F. C. van Veggel and G. P. Demopoulos, ACS Appl. Mater. Interfaces, 2013, 5, 11661–11667 CAS.
- F. Zhang, G. B. Braun, Y. Shi, Y. Zhang, X. Sun, N. O. Reich, D. Zhao and G. Stucky, J. Am. Chem. Soc., 2010, 132, 2850–2851 CrossRef CAS PubMed.
- W. Ge, X. Zhang, M. Liu, Z. Lei, R. Knize and Y. Lu, Theranostics, 2013, 3, 282–288 CrossRef CAS PubMed.
- C. Zhang and J. Y. Lee, J. Phys. Chem. C, 2013, 117, 15253–15259 CAS.
- L. L. Li, R. Zhang, L. Yin, K. Zheng, W. Qin, P. R. Selvin and Y. Lu, Angew. Chem., Int. Ed., 2012, 51, 6121–6125 CrossRef CAS PubMed.
- P. Kannan, F. Abdul Rahim, R. Chen, X. Teng, L. Huang, H. Sun and D.-H. Kim, ACS Appl. Mater. Interfaces, 2013, 5, 3508–3513 CAS.
- Z. Wang, W. Gao, R. Wang, J. Shao, Q. Han, C. Wang, J. Zhang, T. Zhang, J. Dong and H. Zheng, Mater. Res. Bull., 2016, 83, 515–521 CrossRef CAS.
- J. Shen, Z. Li, Y. Chen, X. Chen, Y. Chen, Z. Sun and S. Huang, Appl. Surf. Sci., 2013, 270, 712–717 CrossRef CAS.
- X. Li, D. Shen, J. Yang, C. Yao, R. Che, F. Zhang and D. Zhao, Chem. Mater., 2012, 25, 106–112 CrossRef.
- N. J. Johnson, A. Korinek, C. Dong and F. C. van Veggel, J. Am. Chem. Soc., 2012, 134, 11068–11071 CrossRef CAS PubMed.
- D. Liu, X. Xu, Y. Du, X. Qin, Y. Zhang, C. Ma, S. Wen, W. Ren, E. M. Goldys and J. A. Piper, Nat. Commun., 2016, 7, 10254 CrossRef CAS PubMed.
- S. Fischer, N. D. Bronstein, J. K. Swabeck, E. M. Chan and A. P. Alivisatos, Nano Lett., 2016, 16, 7241–7247 CrossRef CAS PubMed.
- T. L. Barr and S. Seal, J. Vac. Sci. Technol., 1995, 13, 1239–1246 CrossRef CAS.
- G. Yi, H. Lu, S. Zhao, Y. Ge, W. Yang, D. Chen and L.-H. Guo, Nano Lett., 2004, 4, 2191–2196 CrossRef CAS.
- H. Assaaoudi, G.-B. Shan, N. Dyck and G. P. Demopoulos, CrystEngComm, 2013, 15, 4739–4746 RSC.
- X. Xu, C. Clarke, C. Ma, G. Casillas, M. Das, M. Guan, D. Liu, L. Wang, A. Tadich and Y. Du, Nanoscale, 2017, 9, 7719–7726 RSC.
- C. Ma, X. Xu, F. Wang, Z. Zhou, D. Liu, J. Zhao, M. Guan, C. I. Lang and D. Jin, Nano Lett., 2017, 17, 2858–2864 CrossRef CAS PubMed.
- C. Ma, X. Xu, F. Wang, Z. Zhou, S. Wen, D. Liu, J. Fang, C. I. Lang and D. Jin, J. Phys. Chem. Lett., 2016, 7, 3252–3258 CrossRef CAS PubMed.
- X. Liu and D. Y. Lei, Sci. Rep., 2015, 5, 15235 CrossRef CAS PubMed.
- D. M. Wu, A. García-Etxarri, A. Salleo and J. A. Dionne, J. Phys. Chem. Lett., 2014, 5, 4020–4031 CrossRef CAS PubMed.
- W. Zhang, F. Ding and S. Y. Chou, Adv. Mater., 2012, 24, OP236–OP241 CAS.
- W. Park, D. Lu and S. Ahn, Chem. Soc. Rev., 2015, 44, 2940–2962 RSC.
- M. Saboktakin, X. Ye, S. J. Oh, S.-H. Hong, A. T. Fafarman, U. K. Chettiar, N. Engheta, C. B. Murray and C. R. Kagan, ACS Nano, 2012, 6, 8758–8766 CrossRef CAS PubMed.
- D. Lu, S. K. Cho, S. Ahn, L. Brun, C. J. Summers and W. Park, ACS Nano, 2014, 8, 7780–7792 CrossRef CAS PubMed.
Footnote |
| † Electronic supplementary information (ESI) available: General procedures, simulation details, additional TEM/SEM images of the synthesized materials, simulation results, additional NEXAFS/XRD spectra, additional scanning confocal images and an optical path diagram of the confocal scanning microscope. See DOI: 10.1039/c7nr08979a |
| This journal is © The Royal Society of Chemistry 2018 |

