In situ generation of ultrasmall sized and highly dispersed CuO nanoparticles embedded in silica matrix and their catalytic application†
Linxu
Xu
,
Jiajia
Zhang
,
Zhenhui
Li
,
Qinghai
Ma
,
Yan
Wang
 ,
Fang
Cui
 * and
Tieyu
Cui
 *
*
School of Chemistry and Chemical Engineering, Harbin Institute of Technology, Harbin, 150080, People's Republic of China. E-mail: cuifang@hit.edu.cn; cuit@hit.edu.cn
First published on 24th November 2018
Abstract
CuO nanoparticles (CuO NPs) with ultrasmall size (∼3.6 nm) and a highly-dispersed pattern embedded in a silica matrix were obtained in situ through a calcination process of organic copper salt. By means of rational selection of reactants, organic copper salt was introduced into Si–O–Si networks via covalent bonding during the sol–gel process under neutral conditions without any additional catalyst. The introduction of organic copper salt via covalent bonding as well as the compact Si–O–Si networks allowed for the formation of highly dispersed and ultrasmall sized CuO NPs. Scanning electron microscopy (SEM) and transmission electron microscopy (TEM) revealed that the obtained silica complex had spherical morphology and well-dispersed small sized CuO NPs. The as-obtained CuO@SiO2 nanocomposites exhibited good catalytic property on the reduction of organic dye with NaBH4 as the reducing agent.
Introduction
Nano-sized metal or metal oxide particles (mNPs), particularly transition metals, have attracted considerable attention due to their unique physico-chemical properties. These properties have endowed them with remarkable optical, electrical and catalytic properties, which have been exploited in many fields for unparalleled applications such as sensors, optical switches, bioimaging, photodetectors and catalysts.1–5 Among the various application domains, the catalytic property of mNPs is extremely fascinating due to their high activity and selectivity.6,7 However, one unsatisfactory point is that naked mNPs are unacceptable for large-scale use because of easy aggregation, deactivation and poisoning.8 Thus, efforts have been devoted to protecting mNPs from damage by using stabilizers or by the formation of composites with polymers, carbonaceous material, silica and so on.9–11 Silica is regarded as a good substrate because of its satisfactory nontoxicity, biocompatibility and designability. Since Stöber method was reported in 1968, this alkali-catalytic model has become the most popular route for obtaining a uniform spherical silica nano-matrix. Various metal or metal oxide nanoparticles such as gold, platinum, silver, ferric oxide, and copper oxide have been encapsulated in or supported on a silica substrate to form the so-called core–shell nanocomposites.12–16 As for the metal nanocatalysts, the most important characteristic they should possess is that the size and distribution of mNPs in supported substrates should be small and uniform.17 The formation processes widely used to synthesize mNPs/silica nanocomposites are encapsulation and deposition. However, both these processes face significant challenges in terms of preparing composite silica spheres equipped with ultrasmall sized and highly dispersed mNPs. In the case of encapsulation, mNPs must be stabilized using a stabilizing agent in order to suppress aggregation, and the content and distribution of mNPs are difficult to control. In the deposition method, the size of the generated mNPs is uncontrollable due to the lack of constraining forces.Alternatively, the in situ method may provide an opportunity to obtain silica composites loaded with ultrasmall sized and highly dispersed mNPs. Typically, a metal ion precursor (such as an organic metal salt) is primarily introduced into the silica matrix and then, mNPs are generated in situ by post-treatment. The success of this method depends on a key premise: the metal ion precursor must be uniformly introduced into the silica matrix and well-protected. However, extreme pH conditions are indispensable for traditional Stöber-based methods. These conditions are incompatible with the in situ route due to a restricted problem that the metal ion precursor is more sensitive to either acidic or basic environment; thus, a mild condition must be required. Recently, a synthetic route under near neutral pH condition that depends on a protonated amine as the catalytic site to obtain silica material has been widely reported.6,18 Compared with the Stöber-based methods, the greatest advantage of this method is that no additional basic catalyst is needed, which may satisfy the requirement of the in situ generation route.
Herein, CuO@SiO2 nanocomposites were synthesized using the in situ generation route, and their catalytic performance was explored. CuO nanoparticles were chosen primarily because of their low cost, nontoxicity and high activity for various chemical reactions such as hydrogenation, and catalytic reduction.16,19,20 By rational selection of reactants, organic copper salt was bonded on silicon alkoxides through a nucleophilic substitution reaction, resulting in the formation of a multifunctional precursor that not only contained copper ions, but also silicon groups. Therefore, organic copper salt could be introduced into the silica matrix via chemical bond formation, which can ensure a molecular-level dispersion of copper ions. This phenomenon favours the in situ formation of ultrasmall sized and well-dispersed CuO NPs. Since no additional base or acid catalysts as well as toxic organic solvents were needed in the entire process, this strategy is in accordance with the concept of green chemistry. We hope that such silica-based core–shell nanocomposites prepared using our presented route could be the ideal succedanea for preparing products prepared using the traditional alkali-catalytic model taking into consideration the increasing concern for sustainability and environmental protection.
Experimental
Materials
(3-Aminopropyl) triethoxysilane (APTES, ≥99%), bromoacetic acid (HBA, ≥99%) and polyvinylpyrrolidone (PVP) were purchased from Sigma-Aldrich Corporation (Shanghai, China). Basic cupric carbonate (Cu2(OH)2CO3, 99.9%) was purchased from Aladdin Company (Shanghai, China). Absolute ethanol (EtOH, ≥99.7%) was purchased from Sinopharm Chemical Reagent Co., Ltd (Shanghai, China). Water used in experiments was deionized with the resistivity of 18 MΩ cm−1. All the reagents were used as obtained without further purification.Preparation of copper bromoacetate (CuBA)
Cu2(OH)2CO3 (11.05 g, 0.05 mol) and HBA (13.89 g, 0.1 mol) were mixed in 150 mL deionized water under magnetic stirring at 60 °C. After stirring for 4 h, the mixture was filtered and the filtered liquor was subjected to vacuum-rotary evaporation at room temperature to remove water. Then, the obtained blue powder was collected.Preparation of CuO@SiO2 nanocomposites
PVP (0.5 g, MW = 1![[thin space (1/6-em)]](https://www.rsc.org/images/entities/char_2009.gif) 300
300![[thin space (1/6-em)]](https://www.rsc.org/images/entities/char_2009.gif) 000) was dissolved in 18 mL absolute ethyl alcohol. Then, APTES (1.2 mL, 5 mmol) was injected into the above mixture solution under vigorous stirring. The as-obtained CuBA (0.447 g, 1.25 mmol) powder was dissolved in the mixture solution of water (0.5 mL) and absolute ethyl alcohol (17 mL), and then added to the ethanol solution containing APTES and PVP. The mole ratio of copper bromoacetate, APTES, water and ethanol was 1
000) was dissolved in 18 mL absolute ethyl alcohol. Then, APTES (1.2 mL, 5 mmol) was injected into the above mixture solution under vigorous stirring. The as-obtained CuBA (0.447 g, 1.25 mmol) powder was dissolved in the mixture solution of water (0.5 mL) and absolute ethyl alcohol (17 mL), and then added to the ethanol solution containing APTES and PVP. The mole ratio of copper bromoacetate, APTES, water and ethanol was 1![[thin space (1/6-em)]](https://www.rsc.org/images/entities/char_2009.gif) :
:![[thin space (1/6-em)]](https://www.rsc.org/images/entities/char_2009.gif) 4
4![[thin space (1/6-em)]](https://www.rsc.org/images/entities/char_2009.gif) :
:![[thin space (1/6-em)]](https://www.rsc.org/images/entities/char_2009.gif) 22.4
22.4![[thin space (1/6-em)]](https://www.rsc.org/images/entities/char_2009.gif) :
:![[thin space (1/6-em)]](https://www.rsc.org/images/entities/char_2009.gif) 480. The whole process was conducted under magnetic stirring at 60 °C in a water bath. After the mixture was continuously stirred for 4 h, the resultant solution was statically kept at room temperature for 12 h to age. Then, the generated deposits were collected after centrifugation, washed with absolute ethanol several times and transferred to an oven at 60 °C to dry (donated as CuBA@SiO2). Finally, the powder was calcined at 600 °C for 4 h to obtain the CuO@SiO2 composites.
480. The whole process was conducted under magnetic stirring at 60 °C in a water bath. After the mixture was continuously stirred for 4 h, the resultant solution was statically kept at room temperature for 12 h to age. Then, the generated deposits were collected after centrifugation, washed with absolute ethanol several times and transferred to an oven at 60 °C to dry (donated as CuBA@SiO2). Finally, the powder was calcined at 600 °C for 4 h to obtain the CuO@SiO2 composites.
Catalytic performance testing
The catalytic property of CuO@SiO2 composites was evaluated by studying the change in the intensity at the maximum absorbance wavelength (λmax) of methyl orange (MO) dye. Typically, the CuO@SiO2 composites (2 mg) were homogeneously dispersed into a 2.5 mL MO dye solution (0.01 mg mL−1), followed by rapid injection of a 0.5 mL NaBH4 solution (0.5 mg mL−1). In the recycling study, the catalysts were separated from the solution by centrifugation after the reduction reaction was completely finished. After washing with water twice, the catalysts were used in the next reaction run. The procedure was repeated 6 times.Characterization
Fourier-transform infrared (FT-IR) spectra were recorded using a KBr carrier containing the powder sample employing a Nicolet AVATAR 360 FT-IR spectrometer. A 1H-NMR spectrum was obtained for the copper bromoacetate powder dissolved in D2O using a Bruker AVANCE500 liquid NMR spectrometer. A JEOL JSM-6700F scanning electron microscope (SEM) with a primary electron energy of 15 kV was employed to examine the surface morphologies of the products. TEM images were obtained by applying a FEI Tecnai G2F30 transmission electron microscope with an accelerating voltage of 300 kV. X-ray diffraction (XRD) data were collected with a Rigaku D/Max-2500 X-ray diffractometer using a Cu target radiation source. Ultraviolet-Visible (UV-Vis) spectra were acquired at room temperature using a SHIMADZU 3100 UV-vis-near-IR spectrophotometer. X-ray photoelectron spectra (XPS) were collected using a VG ESCALAB MKII with Al Kα excitation (1361 eV). Binding energy calibration was based on the C 1s spectrum at 284.6 eV. Inductively coupled plasma (ICP) atomic emission spectroscopy measurements were performed on an Optima 7000 DV.Results and discussion
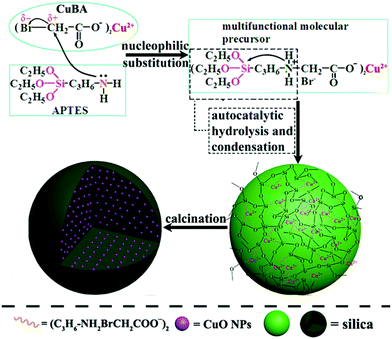
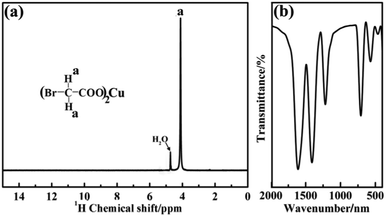
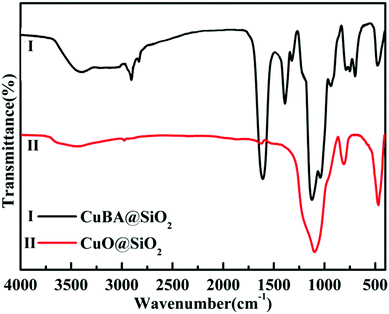
The key for obtaining ultrasmall sized and highly dispersed CuO NPs in situ is that organic copper salt must be homogeneously introduced into the silica matrix without any damage. Scheme 1 shows the synthesis pathway for the preparation of CuO@SiO2 nanospheres. APTES was chosen because it not only contains a silanol group, but also an electron-rich amine group on its unhydrolyzed alkyl chain. On the copper bromoacetate (CuBA) molecule, there is an electron-deficient α-C due to the high electronegativity of the bromine substituent group. Thus, when APTES and CuBA were mixed, a nucleophilic substitution reaction occurred at ambient temperature. As a result, CuBA was covalently bonded with APTES, resulting in the formation of a multifunctional molecule that not only contained silicon alkoxides but also contained copper ions. Most importantly, the protonated amine groups, which have been proven to have the ability to catalyse silica formation,21 were simultaneously generated on the multifunctional molecule. Thus, the formation of Si–O–Si networks can be induced spontaneously without any additional acidic or basic catalysts. This phenomenon favours the protection of pH-sensitive organic copper salt. As mentioned earlier, CuBA was covalently bonded with APTES through a nucleophilic substitution reaction. This powerful chemical bond can ensure the molecular-level dispersion of copper ions, which is key for the formation of ultrasmall sized CuO NPs with a highly dispersed spatial distribution. Finally, copper ions converted to CuO NPs in situ under thermal treatment.In order to explore the structure of the pre-synthesized CuBA, nuclear magnetic resonance and Fourier-transform infrared spectra were obtained. As shown in Fig. 1(a), the chemical shift of 4.24 ppm can be assigned to the methylene ion of CuBA. The FT-IR spectrum shown in Fig. 1(b) illustrates three strong absorption peaks at 1606, 1407 and 710 cm−1, which can be assigned to the antisymmetric stretching vibration, symmetric stretching vibration and deformation vibration of the carboxylate groups, respectively. The two bands appearing at 1216 and 570 cm−1 are ascribed to the out-of-plane vibration of methylene and the stretching vibration of C–Br groups, respectively. Since no chemical shift of proton of the carboxylate radical (11 ppm) in the 1H-NMR spectrum and characteristic absorption peaks of carboxylic acid in the FT-IR spectrum was observed, we believe that copper bromoacetate was successfully synthesized. When the sol–gel process was spontaneously initiated with the help of the protonated amine groups under near neutral pH conditions (the pH was measured dynamically and the value is shown in Fig. S1, ESI†), CuBA was synchronously introduced into Si–O–Si networks without any damage, which can be confirmed by FT-IR spectroscopy. Fig. 2 shows the FT-IR spectra of hybrid organic–inorganic CuBA@SiO2 and CuO@SiO2 nanocomposites. We can see that all the characteristic absorption peaks of CuBA are presented. It is worth noting that the C–N strength of the primary amine group on APTES molecular disappeared (1168 cm−1, Fig. S2, ESI†), while a strong absorption peak for the secondary amine group was observed at 1134 cm−1. These findings demonstrated that the nucleophilic substitution reaction indeed occurred. The peaks at 1041 and 936 cm−1 are ascribed to the antisymmetric and symmetric stretching vibration of organic Si–O–Si networks, respectively. The three adjacent peaks located at 788, 750 and 698 cm−1 are typical of Si–C stretching, confirming that the organic chains are covalently bound on the Si–O–Si networks. Finally, the organic–inorganic hybrid CuBA@SiO2 material was converted to CuO@SiO2 nanocomposites by thermal treatment. All the organic parts disappeared and the CuO NPs were generated in situ. The peaks located at 1100 and 802 cm−1 as shown in curve (II) are ascribed to the antisymmetric stretching vibration and symmetric stretching vibration of amorphous Si–O–Si. These findings explained that organosilicone transformed into amorphous silica materials.
The microstructure of the obtained CuBA@SiO2 nanocomposites was measured using scanning electron microscopy (SEM) and transmission electron microscopy (TEM). A spherical morphology with an average diameter of ∼500 nm was observed in Fig. 3(a) and (b). The inset image in Fig. 3(b) demonstrates the compact and homogeneous structure of this material. This reveals that the organic copper salt was uniformly dispersed in the entire silica matrix due to the introduction of covalent bond. The energy dispersed spectrum (EDS) shown in Fig. 3(c) provides information on the expected elements of O, Si, Br and Cu, which also makes us believe that CuBA has been perfectly introduced into the silica matrix. In order to further explore the spatial distribution of the elements, energy-dispersive X-ray (EDX) element mapping was performed. Fig. 3(d)–(g) show that all the expected elements were observed and Cu2+ ions were well-dispersed in the hybrid silica matrix, which was crucial for preparing silica composites with ultrasmall sized and highly dispersed CuO NPs.
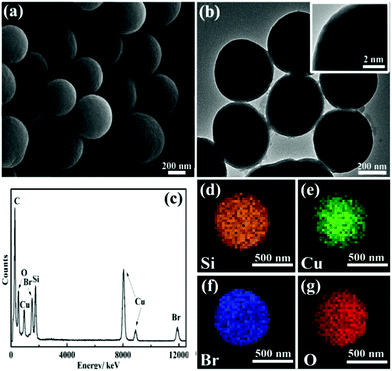 | ||
| Fig. 3 SEM image (a), typical TEM image (b), EDS spectrum (c) and EDX element mappings (d–g) of CuBA@SiO2 nanocomposites. The inset in (b) is the magnified TEM image. | ||
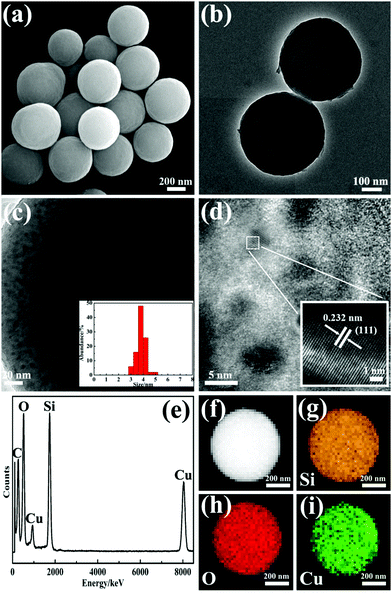
The organic–inorganic hybrid CuBA@SiO2 nanospheres were converted to CuO@SiO2 materials under thermal treatment. Fig. 4(a) and (b) show the micro-morphology of the as-obtained CuO@SiO2 materials. Even though the average size decreased to around ∼480 nm, the spherical structure was still maintained, revealing the good mechanical stability of the hybrid CuBA@SiO2 nanospheres. In the pyrolysis process, the organic copper salt was transformed into CuO nanoparticles in situ. Because CuBA was covalently connected on APTES and introduced into silica matrix in the sol–gel process, Cu2+ ions were surrounded by continuous alkyl chains and compact Si–O–Si networks. This favoured the formation of small sized and well-dispersed CuO NPs. In the magnified TEM image shown in Fig. 4(c), we can see that the CuO nanoparticles with average size of around ∼3.6 nm (inset in Fig. 4(c) shows the statistics of the size distribution) are separated from each other. Fig. 4(d) shows the high-resolution TEM image. In order to clearly present the morphology, the selected part was enlarged and the corresponding image is provided in the inset of Fig. 4(d). A clear crystalline lattice with the interplanar spacing of 0.232 nm can be observed, corresponding to the (111) lattice of CuO crystals (JCPDS no. 80-1916). After thermal treatment, all alkyl chains were decomposed. The EDS spectrum shown in Fig. 4(e) illustrates the expected remnant elements of O, Si and Cu. The well-dispersed organic copper salt in situ generated well-dispersed CuO NPs. Similarly, EDX mappings provided expected information about the uniform spatial distribution of the nanoparticles (Fig. 4(f)–(i)). The weight percentage of the CuO NPs in the CuO@SiO2 nanocomposites was determined by inductive coupled plasma emission spectrometer (ICP) measurements, which provided a value of 18.6%.
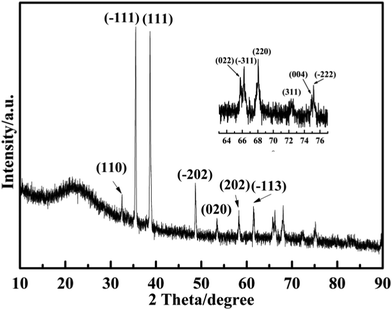
In order to obtain more detailed information on the crystal phases of CuO nanoparticles, XRD analysis was performed. Fig. 5 shows the typical powder XRD patterns of CuO@SiO2 nanocomposites. The diffraction peaks demonstrate that CuO nanoparticles can be indexed to the monoclinic structure with the cell parameters a = 4.692, b = 3.428, c = 5.137 and β = 99.546 (JCPDS no. 80-1916), which agree with HRTEM data. The values of 2θ that appear at 32.5°, 35.5°, 38.6°, 48.6°, 53.4°, 58.2°, 61.4°, 65.7°, 66.1°, 68.0°, 72.3°, 74.9° and 75.1° (magnified inset image) are in good accordance with the (110), (−111), (111), (−202), (020), (202), (−113), (022), (−311), (220), (311), (004) and (−222) planes, which illustrate the in situ formation of pure CuO nanoparticles with high crystallinity.
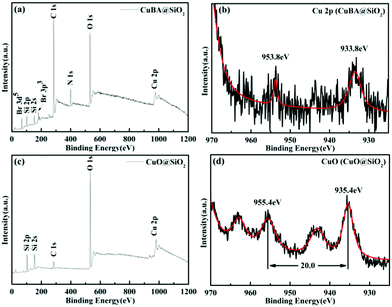
To study the chemical and bonding environment of the obtained materials, X-ray photoelectron spectroscopy (XPS) was performed. Fig. 6 shows the typical XPS spectra of the obtained silica-based materials before and after thermal treatment. The full scanned spectrum (Fig. 6(a)) demonstrates that Br, Si, C, N, O and Cu elements exist in CuBA@SiO2 nanocomposites. The oxidation state of Cu in CuBA@SiO2 nanocomposites is shown in Fig. 6(b). The two bands located at 953.8 and 933.8 eV are attributed to Cu 2p1/2 and Cu 2p3/2, respectively, which is consistent with the report for Cu in the 2+ oxidation state.22 After thermal treatment, all alkyl chains were decomposed and CuO NPs were generated in situ. Fig. 6(c) provides the information for the remnant elements of O, Si and Cu. Fig. 6(d) reveals several peaks of Cu 2p after thermal treatment. The main Cu 2p3/2 peak at 935.4 eV and the corresponding Cu 2p1/2 peak that shifted to 20 eV higher binding energies can be attributed to CuO.23 The two satellite peaks in the region of 940–944 eV and 963.3 eV provide more evidence for the formation of CuO NPs.24
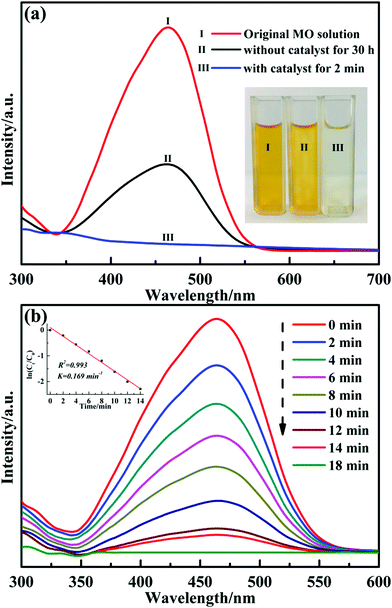
It has been reported that transition metal oxides nanoparticles are promising materials in catalytic applications. Particularly, CuO is becoming increasingly popular owing to its low band-gap energy, non-toxic nature and abundant resources.16,25 We explored the catalytic activity of the obtained nanocomposites by employing the reduction of methyl orange (MO) dye with excess NaBH4 as the reducing agent under ambient conditions. Because the yellow colour of the solution gradually vanished, the results of reduction reaction can be monitored by naked eyes. Fig. 7(a) shows the UV-Vis spectra of MO dye during the reaction in the presence and absence of CuO@SiO2 nanocomposites. Comparative experiments were performed to explore the catalytic property of the CuO@SiO2 nanocomposites. Curve (I) is the spectrum for the initial MO dye solution of yellow colour with λmax at 464 nm; the corresponding digital photograph (I) is shown in the inset of Fig. 7(a). Curve (II) shows the mixture of MO dye and NaBH4 after 30 h. The intensity at λmax decreased and the percentage value was about 61.1% according to the Lambert–Beer law. However, when a trace of CuO@SiO2 nanocomposites (2 mg) were added into the mixture, the λmax of the MO solution at 464 nm quenched within 2 minutes, and the colour of the solution quickly changed from orange to colourless (corresponding digital picture (III) is shown in the inset image in Fig. 7(a)). The results of the UV-Vis spectra analysis demonstrate that the obtained CuO@SiO2 nanocomposites have excellent catalytic activity for the reduction of organic dye.
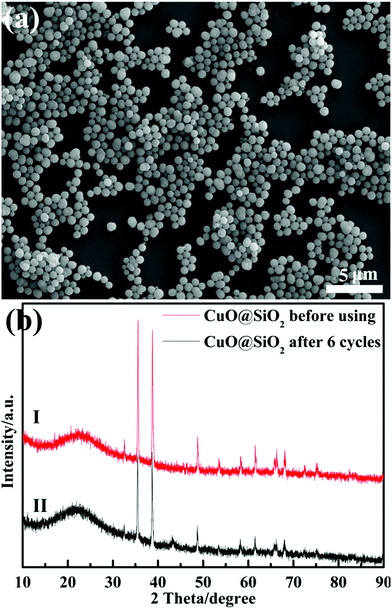
The reaction rate of MO solution in the presence of NaBH4 and 2 mg CuO@SiO2 catalyst was too fast to monitor. Therefore, we had to reduce the amount of catalyst to 0.1 mg. Fig. 7(b) presents the UV-Vis spectra of the reduction reaction for MO dye measured at different times using 0.1 mg CuO@SiO2 nanocomposites as the catalyst. The rate constant K was determined using a linear plot of ln(Ct/C0) and reaction time t (Ct and C0 were the MO dye concentrations at time t and 0, respectively, measured from the relative intensity of the respective absorbance At and A0 according to the Lambert–Beer law). The linear relationship between ln(Ct/C0) and the reaction time (t) is shown in the inset of Fig. 7(b). The constant K was calculated from the equation ln(Ct/C0) = Kt and the slope of the linear fit result was 0.169 min−1. Stability and reusability are also very important for catalysts in practical applications. Thus, we have performed the cycling experiment to explore the stability and reusability of CuO@SiO2 nanocomposites. After the reaction with 2 mg catalyst for 2 minutes in each cycle, the intensity of the ultraviolet absorption at λmax for the MO solution was immediately measured by UV-Vis spectroscopy (Fig. S3, ESI†), and the conversion of the MO solution was calculated. Fig. 8 shows the degradation rate of the mixture solution of MO and NaBH4 in the presence of CuO@SiO2 nanocomposites for different cycles. Even after 6 cycles, the conversion of MO dye could still reach up to 80%. As expected, the loss of catalyst could not be avoided during the processes of collection and washing. Thus, the mass of the catalyst could be gradually reduced, which inevitably affects the catalytic activity. Furthermore, the stability of the CuO@SiO2 nanocomposites was measured via SEM and XRD analysis. As shown in Fig. 9, the nanocomposite with spherical morphology was still observed (Fig. 9(a)). Fig. 9(b) shows the information for CuO@SiO2 nanocomposites before and after cycling. A new diffraction peak at 2θ = 43.2°, can be observed in pattern (II), which can be attributed to metallic Cu. The peak emerged because some CuO NPs were inevitably exposed on the silica surface, which made it possible for reducing some CuO NPs to metallic Cu because the exposed CuO NPs were directly in contact with NaBH4. However, most of the diffraction peaks were attributed to CuO NPs. The XPS profile of the CuO NPs after the recycling experiment was measured (Fig. S4, ESI†), which also revealed the good stability of CuO NPs. Overall, we believe that the embedded CuO NPs were well protected by the silica matrix.
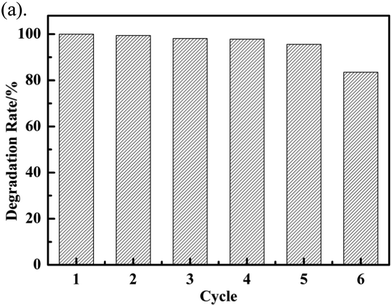 | ||
| Fig. 8 The degradation rate of each cycle of MO solution in presence of 2 mg CuO@SiO2 catalyst in 2 minutes. | ||
Conclusion
In summary, an organic copper salt was covalently introduced into the silica matrix and then converted to CuO NPs in situ. An autocatalytic route that relied on the protonated amine group as a catalytic site provided all the necessary conditions for ensuring the perfect and uniform introduction of the organic copper salt into the silica matrix. This was key in obtaining ultrasmall sized and well-dispersed CuO NPs. The as-obtained CuO@SiO2 nanocomposites exhibited good catalytic performance for the reduction of organic dye. Compared with the traditional Stöber methods used for synthesizing silica-based metal nanocomposites that require complex multi-steps and extreme pH conditions, this in situ generation route is facile and efficient. We anticipate that diverse silica-based nanocomposites with controllable properties, such as optical, magnetic and electrical, can be designed using this route.Conflicts of interest
There are no conflicts to declare.Acknowledgements
We thank the financial support from the National Nature Science Foundation of China (No. 51673055 and 51873049).Notes and references
- J. P. Yang, F. Zhang, Y. R. Chen, S. Qian, P. Hu, W. Li, Y. H. Deng, Y. Fang, L. Han, M. Luqman and D. Y. Zhao, Chem. Commun., 2011, 47, 11618–11620 RSC
.
- X. Q. Xu, C. H. Deng, M. G. Gao, W. J. Yu, P. Y. Yang and X. G. Zhang, Adv. Mater., 2006, 18, 3289–3293 CrossRef CAS
.
- D. Jariwala, V. K. Sangwan, L. J. Lauhon, T. J. Marks and M. C. Hersam, ACS Nano, 2014, 8, 1102–1120 CrossRef CAS
.
- Q. H. Wang, K. Kalantar-Zadeh, A. Kis, J. N. Coleman and M. S. Strano, Nat. Nanotechnol., 2012, 7, 699–712 CrossRef CAS
.
- P. Wu and X. P. Yan, Chem. Soc. Rev., 2013, 42, 5489–5521 RSC
.
- L. X. Xu, F. Cui, J. J. Zhang, Y. J. Hao, Y. Wang and T. Y. Cui, Nanoscale, 2017, 9, 899–906 RSC
.
- F. Cui, Q. Shao, T. Y. Cui, L. X. Xu, T. J. Yao and X. Zhang, J. Mater. Chem. A, 2015, 3, 20073–20079 RSC
.
- M. V. Canamares, J. V. Garcia-Ramos, J. D. Gomez-Varga, C. Domingo and S. Sanchez-Cortes, Langmuir, 2005, 21, 8546–8553 CrossRef CAS
.
- T. Y. Cui, F. Cui, J. H. Zhang, J. Y. Wang, J. Huang, C. L. Lu, Z. M. Chen and B. Yang, J. Am. Chem. Soc., 2006, 128, 6298–6299 CrossRef CAS
.
- F. Cui, L. X. Xu, T. Y. Cui, T. J. Yao, J. Yu, X. Zhang and K. N. Sun, RSC Adv., 2014, 4, 33408–33415 RSC
.
- L. Shang, T. Bian, B. H. Zhang, D. G. Zhang, L. Z. Wu, C. H. Tung, Y. D. Yin and T. R. Zhang, Angew. Chem., Int. Ed., 2014, 53, 250–254 CrossRef CAS
.
- N. S. Abadeer, M. R. Brennan, W. L. Wilson and C. J. Murphy, ACS Nano, 2014, 8, 8392–8406 CrossRef CAS
.
- Z. Q. Zhang, Y. Luo, Y. Guo, W. X. Shi, W. Wang, B. Zhang, R. J. Zhang, X. Bao, S. Y. Wu and F. Y. Cui, Chem. Eng. J., 2018, 344, 114–123 CrossRef CAS
.
- L. Han, H. Wei, B. Tu and D. Y. Zhao, Chem. Commun., 2011, 47, 8536–8538 RSC
.
- F. Lu, A. Popa, S. W. Zhou, J. J. Zhu and A. C. S. Samia, Chem. Commun., 2013, 49, 11436–11438 RSC
.
- C. Q. Chen, J. Qu, C. Y. Cao, F. Niu and W. G. Song, J. Mater. Chem., 2011, 21, 5774–5779 RSC
.
- M. Epifani, C. Giannini, L. Tapfer and L. Vasanelli, J. Am. Ceram. Soc., 2000, 83, 2385–2393 CrossRef CAS
.
- F. Cui and T. Y. Cui, Chem. Commun., 2014, 50, 14801–14804 RSC
.
- P. Munnik, M. Wolters, A. Gabrielsson, S. D. Pollington, G. Headdock, J. H. Bitter, P. E. Jongh and K. P. Jong, J. Phys. Chem. C, 2011, 115, 14698–14706 CrossRef CAS
.
- S. B. Wang, X. Q. Wang, H. L. Zhang and W. B. Zhang, J. Alloys Compd., 2016, 685, 22–27 CrossRef CAS
.
- T. Coradin, O. Durupthy and J. Livage, Langmuir, 2002, 18, 2331–2336 CrossRef CAS
.
- T. L. Freeman and S. D. Evans, Thin Solid Films, 1994, 244, 784–788 CrossRef CAS
.
- F. Klein, R. Pinedo, P. Hering, A. Polity, J. Janek and P. Adelhelm, J. Phys. Chem. C, 2016, 120, 1400–1414 CrossRef CAS
.
- S. Poulston, P. M. Parlett, P. Stone and M. Bowker, Surf. Interface Anal., 1996, 24, 811–820 CrossRef CAS
.
- J. Zhang, J. Liu, Q. Peng, X. Wang and Y. Li, Chem. Mater., 2006, 18, 867–871 CrossRef CAS
.
Footnote |
| † Electronic supplementary information (ESI) available: pH change; FT-IR spectrum and UV-Vis spectrum. See DOI: 10.1039/c8nj04517h |
| This journal is © The Royal Society of Chemistry and the Centre National de la Recherche Scientifique 2019 |

