Binding aspects of dietary flavone, luteolin, with polymorphic forms of natural DNA: a spectroscopic and molecular docking approach
Sutanwi
Bhuiya
,
Lucy
Haque
,
Taniya
Dutta
,
Susmita
Chowdhury
and
Suman
Das
 *
*
Physical Chemistry Section, Department of Chemistry, Jadavpur University, Raja S. C. Mullick Road, Jadavpur, Kolkata 700 032, India. E-mail: sumandas10@yahoo.com; s.bhuiya12@gmail.com; lucy.haque@gmail.com; duttataniya16@gmail.com; chowdhurysusmita72@gmail.com; Fax: +91 33 2414 6266; Tel: +91 94 3437 3164 Tel: +91 33 2457 2349
First published on 12th November 2018
Abstract
Physicochemical studies on the interactions of small molecules with different polymorphs of DNA are relevant for elucidation at the molecular level of the processes occurring in vivo. In our work, various spectroscopic techniques combined with molecular modeling computations have been used to explore the interactions of luteolin (LTN), a pharmacologically important bioactive flavone, with two polymorphic forms of natural DNA. These include the low pH induced left-handed protonated and right-handed B forms of DNA in aqueous buffer medium. The association was characterized by hypochromic and red shifted absorption maxima, enhanced fluorescence intensity and strong perturbation in the circular dichroism (CD) spectra. Binding parameters along with significant thermal stabilization indicate a greater extent of association of LTN with the protonated form in comparison to the native B form structure of DNA. Viscometric and molecular docking studies together infer that the binding mode of LTN to the protonated DNA is external stacking while with B DNA it is intercalation.
Introduction
DNA plays a pivotal role in the synthesis of proteins (gene expression) and its own replication makes it a potential target for drugs, especially for antiviral, antibiotic and anticancer actions. Thus, the study of small molecules that bind to nucleic acids is one of the most important parameters in the design and development of new therapeutic agents. Being a structurally polymorphic macromolecule DNA can adopt a variety of conformations depending on the nucleotide sequence and environmental conditions.1 These conformations of DNA include A, B, C and Z forms, and hairpin or cruciform structures.2 Substantial efforts have been expended to reveal the biological consequences of such structures.3 The right-handed B form (antiparallel double helical structure) DNA can exist in a few other conformations, viz., A and C forms etc. In several cases, the right-handed B form conformation gets converted to the unusual left-handed Z form in solution by alternating guanine–cytosine polynucleotides and retaining the Watson–Crick base pairing.4,5 The conformational divergences exhibited by A, B and Z DNA are primarily an outcome of sugar puckering that fixes the chirality of the helix. A detailed understanding of the physiological consequences of the said conformations in vivo has still remained scanty. Proton addition or release is often found in biological systems that gained substantial interest in various enzymatic reactions, triple helical nucleic acid formation etc. DNA assumes the well-known right-handed B form structure via Watson–Crick base pairing at normal physiological pH, while protonation-induced DNA structures got severe attention due to the critical aspects of pH in biological processes. Studies on the environmental influence on DNA topology and pH regulated gene expression have been of great significance as they engage the structure–function relationship of DNA. It has been witnessed that in many biological systems, certain physiological functions are relatively favoured under low pH conditions. Li et al. have shown a pH-dependent enhancement of DNA binding by the ultrabithorax homeodomain and this report highlights the significance of the protonation induced conformational study of nucleic acids.6 In another study, it has been clearly revealed that the fusion of Epstein–Barr virus with Raji (lymphoblastoid) cells at low pH is significantly enhanced compared to that at neutral pH.7 The survival of Helicobacter pylori, the major aetiological factor in chronic gastritis in humans, in a low pH environment is probably related to its pathogenicity.8 Foster has reported studies on the low pH adaptation and tolerance response (ATR) of Salmonella typhimurium and has found that the key to ATR is the synthesis of a series of acid shock induced proteins for the log and stationary phases of ATR.9 These studies together with earlier reports of Hicky and Hirshfield10 have drawn considerable attention to pH regulated gene expression and related environmental influences over DNA topology and subsequent effects on selected gene expression.9 The influences over the DNA topology of pH regulated genes is thus of particular interest as it involves a great many structural aspects of DNA correlated with its functions. A Raman spectroscopic study of low-pH-induced changes in the DNA structure of polytene chromosomes reveals that a left-handed DNA structure is present at low pH.11Based on the abovementioned facts, it is important to recognize the pH induced DNA polymorphism and their binding to small molecules. Earlier, the protonation in the DNA structure has been suggested to cause some nonspecific conformational changes in DNA samples that in due course lead to acid denaturation.12 Various contradicting statements are available regarding the protonation sites in DNA. Considering several spectroscopic studies, protonation at low pH is assigned to be on N7 of a guanine moiety.13 Again from Raman spectroscopic study, the first protonation site on calf thymus (CT) DNA was considered to be an adenine followed by cytosine giving rise to a C type conformation of DNA.14 Soon after from NMR studies on oligonucleotides, it has been found that the first protonation site in DNA is N3 of cytosine leading to the formation of a unique left-handed structure with Hoogsteen base pairing.15 The formation and stability of the protonated structure of DNA are dependent on pH and temperature. It is practically a low temperature and low pH induced structure which makes this form less stable under normal physiological conditions. In fact protonated DNA has a left-handed conformation in comparison to the right-handed B form structure and it is formed via Hoogsteen base pairing instead of Watson–Crick base pairing in B DNA.16–18 These unusual structures of protonated DNA are not only stabilized by negative supercoiling but also by acidic pH at which protonation occurs.19 Depending on the base composition of the nucleic acids and the ionic strength of the medium, protonation causes considerable changes in the DNA conformation.20 A few reports are available that highlight the biological and physicochemical consequences of protonation induced conformational study of nucleic acids with respect to different biological systems.4,5,21
Drug–DNA interaction is an active area of research that leads to the path of designing new efficient drugs targeted to DNA or RNA. Small molecules can act as drugs and can bind to nucleic acids in several ways. These include intercalation between adjacent nitrogenous base pairs, binding to the minor groove/major groove and electrostatic interactions.22 Among the different nucleic acid binding small molecules, flavonoids are considered for their various pharmacological properties such as anti-inflammatory, anti-bacterial, anti-viral, anti-allergic, anti-oxidant etc.23,24 The general structure of flavonoid molecules consists of two aromatic rings, often denoted by A (benzoyl ring) and B (cinnamoyl ring) rings, which are joined by a “bridge” of three-carbon atoms: C6–C3–C6 (Fig. 1A).25 These polyphenolic compounds are classified into different classes of flavones, flavanonols, flavonols, flavanones or isoflavones etc. considering the oxidation state of the heterocyclic ring. Luteolin (C15H10O6) (3′,4′,5,7-tetrahydroxyflavone, Fig. 1B, herein after LTN) is a hydroxyflavone derivative that exerts various pharmacological effects and anti-oxidant properties associated with its ability to scavenge oxygen and nitrogen mediated free radicals.26 Apart from its potent anti-oxidant and anti-inflammatory properties, LTN has been shown to act as a potential drug against epilepsy, autism spectrum disorders, and neurodegenerative disorders such as Alzheimer's disease, Parkinson's disease etc.27 LTN reportedly suppresses the development and growth of a series of solid tumors, ascites and leukemic cell lines.26 It acts as a prospective inhibitor against cytokine expression, nuclear factor kappa B (NFkB) signaling and TLR4 signaling at micromolar concentrations in immune cells that include mast cells etc.28–30 LTN reduces the mRNA expression of numerous genes upregulated in response to exogenous 6-OHDA, including BIM (a pro-apoptotic BH3-only member of the Bcl-2 family, required for the initiation of apoptosis induced by endoplasmic reticulum stress).27
In the recent past, Zhang et al. have investigated the interaction of LTN with CT DNA at physiological pH ∼ 7.4 employing various spectroscopic and viscometric measurements and they have concluded the mode of LTN binding to B form DNA as intercalation.31 On the other hand, Zou et al. have performed a comparative study on the interaction of LTN with single and double stranded DNA.32 Again, on the basis of molecular dynamics simulations, Sudarsanakumar and his group have suggested that intercalation could be the potential binding mode for the action of LTN on DNA.33 However, their biophysical studies suggested a minor groove binding mode of LTN to DNA under the experimental conditions they have employed. Keeping in view the DNA binding ability of LTN and also the importance of a low pH induced polymorphic form of nucleic acid, in the present work, we have focused on the comparative binding aspects of LTN with the low pH induced protonated form and B form of CT DNA using a combination of extensive biophysical and molecular docking studies. In the present study, we have carried out spectrophotometric and spectrofluorimetric measurements, excited state lifetime measurement, anisotropy calculation, thermal melting study and viscometric analysis to fulfill the requirements of experimental purpose and molecular docking study to monitor the said interaction theoretically. A detail investigation on the mechanism of the interaction of LTN with protonated and B form DNA is anticipated to be the route to assist in designing new DNA-targeted drugs and their screening in vitro.
Experimental/theoretical details
Materials
LTN and CT DNA were purchased from Sigma-Aldrich Corporation (St. Louis, MO, USA). The concentration of CT DNA was determined using a known molar extinction coefficient value of 13![[thin space (1/6-em)]](https://www.rsc.org/images/entities/char_2009.gif) 200 M−1 cm−1 at 260 nm and expressed in terms of molarity of base pairs.34 Analytical grade reagents and deionized double distilled water were used to prepare buffer solutions. Freshly prepared LTN solution was kept in the dark to prevent photochemical changes. The molar extinction coefficient of LTN was calculated from a measured known concentration of LTN. Within the employed experimental concentration range of our study, Beer's law was not violated.
200 M−1 cm−1 at 260 nm and expressed in terms of molarity of base pairs.34 Analytical grade reagents and deionized double distilled water were used to prepare buffer solutions. Freshly prepared LTN solution was kept in the dark to prevent photochemical changes. The molar extinction coefficient of LTN was calculated from a measured known concentration of LTN. Within the employed experimental concentration range of our study, Beer's law was not violated.
Buffers
1. Formation of the protonated form of the CT DNA structure and its interaction with LTN were carried out in citrate-phosphate (CP) buffer of pH 3.4 containing a constant [Na+] of 10 mM (designated as buffer 1) at 5 °C.2. Citrate-phosphate (CP) buffer of pH 7.0, containing a constant [Na+] of 10 mM, designated as buffer 2 was used to monitor the interaction studies of B form DNA with LTN at 25 °C. Nucleic acid stock solutions were also prepared in this buffer.
All the buffer solutions were filtered through 0.45 μm Millipore filters to remove any particulate matter.
Methods
 | (1) |
![[thin space (1/6-em)]](https://www.rsc.org/images/entities/char_2009.gif) :
:![[thin space (1/6-em)]](https://www.rsc.org/images/entities/char_2009.gif) LTN [(1 − χLTN)
LTN [(1 − χLTN)![[thin space (1/6-em)]](https://www.rsc.org/images/entities/char_2009.gif) :
:![[thin space (1/6-em)]](https://www.rsc.org/images/entities/char_2009.gif) χLTN] where χLTN symbolizes the mole fraction of LTN calculated as the ratio of LTN to the total molar concentration of LTN and DNA. The results reported here are an average of at least three experiments.
χLTN] where χLTN symbolizes the mole fraction of LTN calculated as the ratio of LTN to the total molar concentration of LTN and DNA. The results reported here are an average of at least three experiments.
 | (2) |
For multi-exponential decay, the average lifetime 〈τ〉 was calculated using the equation,38
 | (3) |
 | (4) |
 | (5) |
 | (6) |
![[thin space (1/6-em)]](https://www.rsc.org/images/entities/char_2009.gif) 000 energy evaluations and the population size was set to 150 with a crossover rate of 0.8 (LGA). The best optimized docked model with the lowest docking energy was chosen for further analysis of docking simulations which was best viewed using PyMOL and Mercury software.
000 energy evaluations and the population size was set to 150 with a crossover rate of 0.8 (LGA). The best optimized docked model with the lowest docking energy was chosen for further analysis of docking simulations which was best viewed using PyMOL and Mercury software.
Results and discussion
Characterization of protonated DNA from the B form of CT DNA
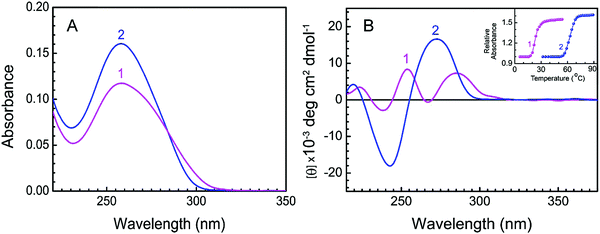
The conformational transition of the B form to the protonated form of DNA was initiated by the slow addition of the DNA stock solution into buffer 1 under constant stirring conditions maintaining the temperature at 5.0 ± 0.5 °C.21 This conformational change follows fast kinetics and gets completed in about 1 s. An equilibrium of 5 minutes was given before recording the spectra. The distinctive UV spectra of protonated (curve 1) and B (curve 2) forms of CT DNA are presented in Fig. 2A. At low pH, there was a hypochromic effect in the 260 nm absorption band of CT DNA. An isosbestic point at 284 nm suggests the presence of equilibrium between the protonated and B forms of CT DNA. The CD spectra of protonated (curve 1) and B (curve 2) forms are presented in Fig. 2B. At pH 7.0, B form DNA exhibited conservative circular dichroic spectra, characterized by a positive CD band around 273 nm followed by a negative band at 248 nm. At pH 3.4, the 273 nm band exhibited hypochromic and bathochromic effects along with a decrease in the negative band ellipticity. Two positive bands appeared around 254 and 286 nm in the case of protonated DNA. Our spectral data are in good accordance with the reported data.21 The inset of Fig. 2B represents the thermal melting profiles of protonated (curve 1) and B (curve 2) forms of CT DNA. The thermal melting profiles of both forms of DNA appeared to be cooperative with sharp melting transitions where the thermal melting temperature (Tm) of the protonated form was significantly lower than that of the B DNA. Tm of the protonated form and B form of CT DNA were found to be 23.5 °C and 64.2 °C respectively (inset of Fig. 2B). The difference in the Tm value between protonated and B form DNA can be attributed to the occurrence of different numbers of hydrogen bonds in the two different polyforms of DNA. At pH 3.4, the number of hydrogen bonds in protonated DNA decreases to two from three in the case of GC base pairing. Therefore under low pH conditions, the thermal stability of protonated DNA decreases due to a reduction in the number of hydrogen bonds. Such a decrease in Tm has been reported to be more pronounced in the case of DNA having a greater extent of GC content.40 A sharp cooperative transition profile for the protonated form of CT DNA signifies the duplex nature even at a low pH of 3.4.21Spectrophotometric study
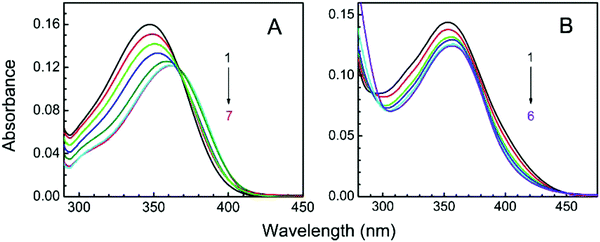
LTN exhibited a characteristic absorption spectrum in the wavelength region of 250–400 nm. At pH 3.4, the wavelengths of absorption bands were 346 (band I) and 264 (band II) nm while at pH 7.0 the absorption maxima appeared at 354 (band I) and 267 (band II) nm respectively (Fig. 3). Band I at higher wavelength is assigned to the n → π* transition in the B ring (cinnamoyl system) and band II is the outcome of π → π* chromophoric transition in the A ring (benzoyl system).41,42 Representative absorption spectra of LTN in the absence and presence of CT DNA solution in respective buffer medium are presented in Fig. 4. Addition of increasing concentrations of protonated and B form DNA exhibited hypochromic effects on the absorbance maxima of LTN at 346 nm (in pH 3.4) and 354 nm (in pH 7.0). The extent of hypochromicity is more pronounced in the case of protonated DNA bound LTN (∼33%) (Fig. 4A) than that of B DNA bound LTN (∼14%) (Fig. 4B). In addition, ∼9 nm bathochromic shift of the λmax of LTN in the case of protonated DNA and ∼5 nm bathochromic shift in the case of B form DNA were observed. Hypochromism and bathochromism usually result due to the involvement of a strong π–π* stacking interaction between the aromatic chromophore and the base pairs of CT DNA. The empty π* orbital of the LTN ligand couples with the π* orbital of the DNA base pairs resulting in a decrease in the required energy of π–π* transition leading to bathochromism.5 At the same time, the empty π* orbital of LTN gets partially filled with electrons and reduces the transition probability leading to hypochromism. An isosbestic point appearing at 366 nm for protonated DNA bound LTN ensures the presence of two-state equilibrium between free LTN and protonated DNA bound LTN. Thus the overall spectrophotometric results ensure the binding interaction of LTN with both the protonated and B form DNA in buffer 1 and buffer 2 respectively. These results are further cast into the Scatchard plot to evaluate the binding parameters for the association of LTN with protonated and B form DNA.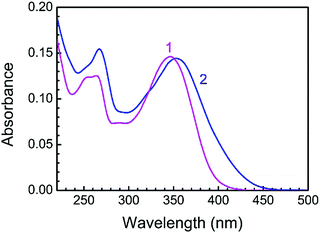 | ||
| Fig. 3 Absorption spectra of 8.85 μM LTN in buffer 1 (curve 1) and buffer 2 (curve 2) at 5 °C and 25 °C. | ||
Spectrofluorimetric studies of DNA binding
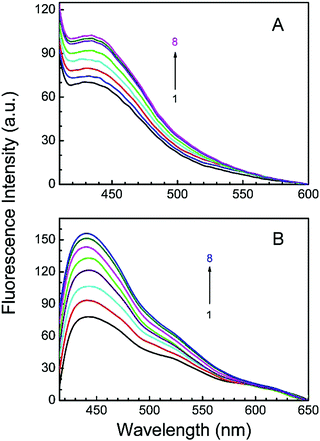
LTN is a weak fluorescent molecule in aqueous buffer solution. The maximum fluorescence intensity of LTN was observed at around 434 nm (in buffer 1) and 440 nm (in buffer 2) when scanned within the wavelength region of 360–750 nm and excited at 353 and 346 nm in buffer 1 and buffer 2 respectively. Fig. 5 represents the spectrofluorimetric titration of LTN with protonated and B forms of CT DNA in the respective buffer medium. As can be seen, in the presence of either form of protonated DNA (Fig. 5A) or B DNA (Fig. 5B), the emission intensity of LTN increases regularly with increasing concentration of DNA eventually reaching saturation without any significant shift of the emission maxima. This fluorescence enhancement of LTN can be attributed to the binding of LTN in the hydrophobic region of the nucleic acids where it is protected against quenching by the aqueous solvent. The results of the spectrofluorimetric titration confirm the association of LTN with protonated as well as B forms of CT DNA.Analyzing association of LTN with protonated and B form DNA
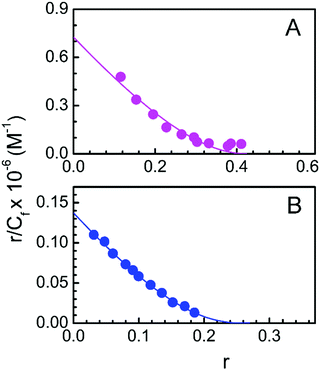
The data obtained from spectrophotometric titration of LTN with protonated and B form DNA are further cast into the Scatchard plot of r/Cfversus r (Fig. 6) to obtain the binding parameters. The plots were nonlinear and non-cooperative (negative slope for all values of r) for the binding of LTN with both protonated and B form DNA. The plotted data were fitted and analyzed by a non-cooperative binding model using the classical McGhee and von Hippel equation (eqn (1)).36 The binding constants were found to be (7.26 ± 0.40) × 105 M−1 and (1.37 ± 0.15) × 105 M−1 for LTN-protonated DNA and the LTN–B DNA complex respectively and the respective binding stoichiometries were ∼2.32 ± 0.1 and ∼3.67 ± 0.2. Our binding data reveal comparatively higher association of flavonoid LTN with protonated DNA than that with B form DNA.LTN is a poly-phenolic compound having four hydroxyl groups (as shown in Fig. 1). The compound shows different acid–base equilibria in different pH ranges. In fact, as reported earlier, LTN shows three pKa values (6.9, 8.6 and 10.2).43 The first pKa value corresponds to the ionization of the OH group at the 7 position in ring A, and the second pKa value is for the ionization of 4′-OH in ring B. The last pKa value is probably due to the superposition of deprotonations of 3′-OH and 5-OH. In our case, LTN predominantly exists in the neutral form at a low pH of 3.4 (buffer 1) and as a mono-anionic species at a physiological pH of 7.0 (buffer 2).43 Therefore, under the two different pH conditions, two different forms of LTN exist which have been reflected in the two slightly dissimilar absorption spectra of flavonoid under two distinct pH conditions. Thus it is expected to have comparatively higher affinity of LTN to the protonated DNA under low pH conditions in comparison to the B form of DNA at physiological pH where the interaction is relatively weak owing to the repulsion between mono-anionic LTN and the negative phosphate backbone of the DNA double helix.
Stoichiometry of the association
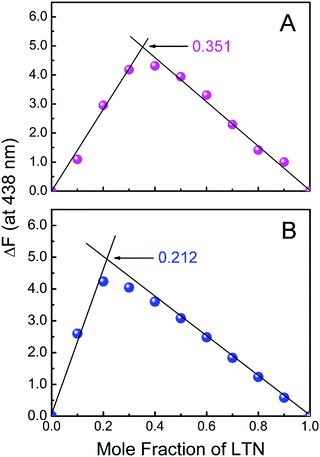
The binding stoichiometry of LTN with protonated and B form DNA was verified by employing the method of continuous variation known as Job's plot using fluorescence spectroscopy. Fig. 7 represents Job's plot for the binding of LTN with either form of DNA. The inflection points were observed at χLTN = 0.351 and 0.212 for LTN-protonated DNA and LTN–B form DNA complexes in buffer 1 and buffer 2 respectively. From the inflection point, the stoichiometry was calculated to be ∼1.9 and ∼3.7 for the association of LTN with protonated and B form DNA respectively. A lower stoichiometry obtained in the case of protonated DNA bound LTN than the corresponding B DNA bound LTN indicates closer binding sites of LTN in protonated DNA in comparison to B form DNA.Fluorescence lifetime measurements
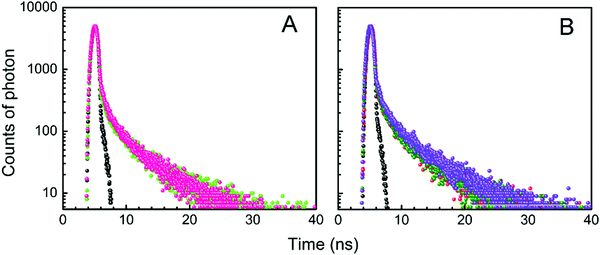
The fluorescence decay profiles of LTN in the absence and presence of increasing concentrations of protonated and B forms of CT DNA are shown in Fig. 8. When a mono-exponential fit did not adjust well, bi-exponential fittings were used. The decay profile of free LTN was bi-exponential in buffer 1 and buffer 2 respectively. This particular type of decay profile is common where the fluorophore can exist in the normal form (non-proton transferred) and photo produced tautomeric form (proton transferred) in the excited state.5 The lifetime value of free LTN was 0.107 (τ1) and 4.635 (τ2) ns with an average lifetime value of 4.18 ns. On binding with protonated DNA and B form DNA, the average lifetime value of LTN in buffer 1 and buffer 2 remained almost the same at the maximum added concentration of DNA. From the abovementioned time-resolved fluorescence analysis, it is apparent that the fluorescence lifetime of LTN remains unperturbed even in the presence of both forms of DNA which is primarily due to the formation of the ground state complex of LTN with protonated as well as B forms of CT DNA.38Fluorescence polarization anisotropy measurement
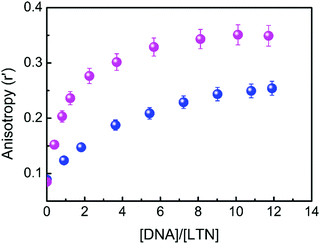
The immediate vicinity of a fluorophore can be assessed from steady-state fluorescence anisotropy measurement. The alleged environment induced rotational restriction on the mobility of the fluorophore in a confined environment is detectable through the variation in anisotropy, thereby providing evidence to find the location of the probe within the biological environments. Fig. 9 shows the variation of steady-state fluorescence anisotropy of LTN with increasing concentration of protonated and B forms of DNA in respective buffer medium. An initial steep rise in the anisotropy value indicates an increase in the motional restriction on LTN due to insertion into the confined environment of DNA, which is then followed by the ability to reach a plateau region, possibly marking the saturation of the interaction between LTN and DNA. In pure buffer solution, the anisotropy value of LTN was 0.089 in both cases and an increased anisotropy value of 0.349 and 0.254 was achieved in buffer 1 and buffer 2 respectively in the presence of CT DNA. Thus in the presence of the protonated form of DNA the anisotropy value increases ∼4 fold while for B form DNA such an increment is ∼3 fold. A significantly increased anisotropy value at the saturation level reflects that the LTN molecules experience considerable motional restriction in their bound state. A greater extent of change in anisotropy in the case of protonated DNA bound LTN clearly specifies a greater amount of restriction of rotational motion of LTN when it is bound to protonated DNA in comparison to B DNA.Fluorescence quenching studies
Fluorescence quenching analysis is a convenient way to address the mode of binding of small molecules to nucleic acid structures.38 In principle, molecules that are bound between the nitrogenous base pairs of the nucleic acids are inaccessible to the quencher while those that are either free or bound on the surface of nucleic acids are easily accessible to the quencher. The negative charge on the phosphate backbone restricts the penetration of the anionic quencher into the interior core of the helix via electrostatic barriers due to the same charge with anionic quencher. Hence very little or no quenching is observed in the presence of such a quencher if the binding involves intercalation. This results in a lower magnitude of the Stern–Volmer quenching constant (KSV) for the intercalating ligands than those of the free molecules or molecules that are bound at the exterior helix surface. Using eqn (5), the Stern–Volmer plots are constructed and representative Stern–Volmer plots for free, protonated and B DNA bound LTN are shown in Fig. 10. The Stern–Volmer quenching constants (KSV) for free, protonated and B DNA bound LTN are found to be 3.51 × 10², 3.29 × 10² and 1.78 × 10² M−1 respectively. As can be seen from the data, the KSV values for free LTN and its complex with protonated DNA are much higher than those for B DNA bound LTN. This indicates that B DNA bound LTN is less accessible to the quencher probably due to its intercalative mode of binding within DNA base pairs. On the other hand, a higher value of KSV for protonated DNA bound LTN suggests the accessibility of the formed complex to the quencher which is only possible if LTN is stacked externally or binds at the groove of the protonated DNA. But from the structural features of protonated DNA it is clear that very narrow groove exists in protonated DNA44,45 which does not suit well for the binding of ligands. Thus, the probable mode for binding of LTN with protonated DNA is stacking at the exterior of the helix which makes LTN available to the quencher.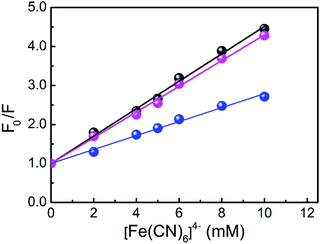 | ||
Fig. 10 Stern–Volmer plots for the fluorescence quenching of free LTN (●), protonated DNA bound LTN ( ) and B DNA bound LTN ( ) and B DNA bound LTN ( ) by K4[Fe(CN)6] in respective buffers. ) by K4[Fe(CN)6] in respective buffers. | ||
Spectropolarimetric studies on DNA binding of LTN
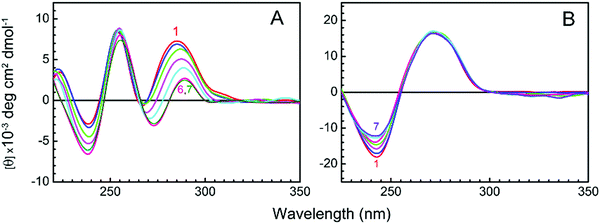
The circular dichroic spectral method is useful in the diagnosis of the modifications in DNA morphology during DNA–ligand interactions, as the CD bands of DNA are pretty sensitive to the mode of interactions of small molecules with natural DNA.46 The observed changes in the CD bands of DNA upon interaction with small molecules may often be assigned to the corresponding conformational changes in the DNA structure.47 The right-handed B form is the most frequently observed conformation of CT DNA. It is already known that the intercalation of planar molecules into the base pairs of B DNA induces large chirality changes and consequently significantly affects their CD spectra.48 Again, groove binding and electrostatic interaction of small molecules show less or no perturbation on the CD bands of B DNA.49 On the other hand, the CD spectrum of left-handed protonated DNA is different from that of B DNA5 as well as its consequences on the CD spectrum upon interaction with small molecules. The CD spectral behaviour of protonated and B forms of CT DNA on interaction with LTN is presented in Fig. 11. The CD spectrum of B DNA shows two conservative CD bands in the UV region; a negative band at 243 nm (due to helicity) and a positive band at 273 nm (due to the base stacking) which is the characteristic of DNA in its right-handed B conformation.50 In the presence of LTN, the ellipticity of the negative band of B DNA decreases while the positive band ellipticity remains unaltered with no appreciable shift of the CD signals. This alteration in CD spectra is a sign of an increase in conformational variability of B DNA on interaction with LTN via the intercalating mode. At pH 3.4, the protonated form of CT DNA was characterized by two positive bands around 254 and 286 nm followed by a negative band around 238 nm. The CD spectrum of protonated DNA was strongly perturbed on interaction with LTN and the changes are depicted in Fig. 11A. In the presence of LTN, the ellipticity of the positive band at 286 nm decreases in addition to ∼4 nm bathochromic shift in the wavelength. Another positive band at around 254 nm and the negative band at 238 nm experience irregular changes in the presence of LTN and ultimately decreased the ellipticity at saturation. These changes in the CD spectra reflect the alterations in the DNA helical backbone and orientation of the bases to accommodate the LTN ligand. Since fluorescence quenching data did not support the fact that the mode of binding for LTN with protonated DNA is intercalation, this alteration in CD spectra could be due to strong stacking interaction of LTN with the sugar-phosphate backbone of protonated DNA.Viscometric study
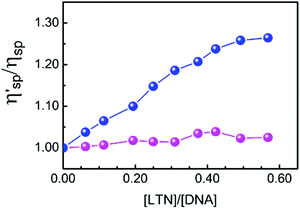
The hydrodynamic changes are the consequences of the diminished bending between layers, the weakening of length-specific mass and the lengthening of the macromolecules.51 The viscosity of DNA solution increases significantly due to intercalation of small molecules into the nitrogenous base pairs of DNA but it is slightly disturbed by groove binding or electrostatic binding of molecules. To get further insight into the DNA binding mode of LTN, viscosity measurements of LTN bound to protonated and B form DNA have been performed, as viscosity measurement is regarded as the least ambiguous and the most critical assessment of a DNA binding model in solution and provides strong arguments for the intercalative mode of binding. The change in specific viscosity of DNA solution upon addition of LTN is presented in Fig. 12. In the case of B form DNA a significant change in the specific viscosity of the solution is observed which is quite reasonable with ligands that are bound to CT DNA via intercalation.4,52,53 On the other hand, almost no change in viscosity of protonated DNA solution in the presence of LTN rules out the chance of intercalation of the ligand.Helix melting study
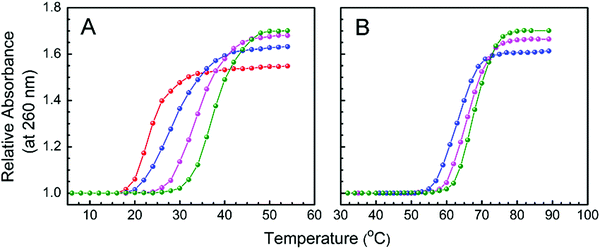
Dissociation or denaturation of a double helical nucleic acid into two single strands results in significant hyperchromism around 260 nm at which DNA molecules strongly absorb. This hyperchromicity appears due to the unstacking of the nucleotide bases. Binding of a small molecule to a nucleic acid alters the denaturation temperature depending on the potency of its interactions with the different polymorphic forms of nucleic acid. Hence, thermal denaturation profiles provide a convenient way for monitoring binding and also for detecting relative binding strengths of ligands. Cooperative and sharp melting curves of protonated and B form DNA, monitoring the absorbance at 260 nm as a function of temperature in the presence and absence of LTN, are presented in Fig. 13. The midpoint of the transition profile is referred to as the melting temperature.Thermal melting temperatures (Tm) of free protonated and B form DNA were observed at 23.5 and 64.2 °C respectively. In the presence of LTN (D/P of 0.5), protonated DNA was stabilized by ∼14 °C while B DNA was stabilized by ∼4 °C. The melting temperature data are summarized in Table 1. From a literature survey, it is found that double helical nucleic acids are stabilized when ligands are bound to them via intercalation or strong stacking interaction.5,54 Thus in our case, the thermal stabilization of B DNA supports the fact that the mode of binding for LTN is intercalation which is in good agreement with fluorescence quenching or viscometric data. Alongside, our melting data clearly support better stacking of LTN with protonated DNA which results from the greater extent of stabilization than that of the LTN–B DNA complex.
| System | D/P | T m (°C) |
|---|---|---|
| Protonated DNA–LTN | 0 | 23.5 |
| 0.1 | 29.3 | |
| 0.3 | 34.6 | |
| 0.5 | 38 | |
| B DNA–LTN | 0 | 64.2 |
| 0.3 | 66.7 | |
| 0.5 | 68.3 | |
Molecular docking study
To further support the mode of binding, binding affinity and binding location, molecular docking studies have been performed on CT DNA [PDB ID: 225D (protonated DNA) and 1BNA (B DNA)] in the presence of LTN. The details of the method have been discussed in the methods section. Fig. 14 represents the docked complexes of LTN with polyforms of DNA. The study revealed that LTN is intercalated between the base pairs of B DNA (preferably in the AT rich region) while strong external electrostatic interaction is observed when binding involves the protonated form of DNA and LTN. Interactions between LTN and polyforms of DNA are primarily caused by various types of non-covalent interactions that include hydrophobic as well as electrostatic interactions. The interactions occur either through the sugar phosphate backbone of DNA or via with the DNA bases.55 However, the interaction between LTN with protonated and B form DNA cannot be accepted to be exclusively hydrophobic or electrostatic as the possibility of hydrogen bonding cannot be ruled out in either of the cases. The minimized docking free energies of the DNA docked conformations of LTN with protonated and B form DNA are found to be −6.81 and −5.35 kcal mol−1 respectively. The more negative relative binding energy of protonated DNA bound LTN indicates stronger binding of LTN towards protonated DNA in comparison to the B form of DNA. The obtained molecular docking computations are quite reasonable with the experimental findings of the said interaction.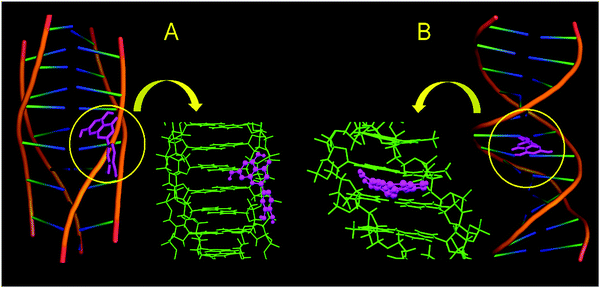 | ||
| Fig. 14 Docked conformations of LTN with (A) protonated DNA (PDB ID: 225D) and (B) B DNA (PDB ID: 1BNA). | ||
Conclusions
The interaction between LTN with two polymorphic forms (protonated and B form) of CT DNA has been investigated by different optical techniques and molecular docking methods. Hypochromism and the red-shifted absorption spectrum of LTN along with enhancement in fluorescence intensity strongly support the strong affinity of LTN towards both protonated DNA and B DNA structures. Fluorescence lifetime study confirms the ground state complexation of LTN with both the polyforms of DNA. Structural alteration of left-handed and right-handed DNA helices upon binding with LTN is manifested through the CD spectral changes of DNA. Taken together, our fluorescence quenching experiment, viscometric studies and thermal melting data on LTN–DNA interaction deliver unequivocal evidence in favour of the intercalation of LTN into the B DNA structure, while strong stacking is responsible for LTN binding to the protonated DNA structure. Moreover, a molecular modeling study further confirms the binding location and binding mode of the said flavonoid to both the polymorphic forms of DNA.Conflicts of interest
There are no conflicts to declare.Acknowledgements
SD gratefully acknowledges the financial assistance provided by the University Grants Commission (UGC), New Delhi, India [F. No. 43-243/2014 (SR), MRP-MAJORCHEM-2013-37991]. SB and LH thank the UGC for the award of Senior Research Fellowship. SC thanks the UGC, Government of India, for project fellowship.References
- W. Saenger, Principles of Nucleic acid Structure, Springer, New York, USA, 1984 Search PubMed.
- T. Kohwi-Shigematsu, R. Gelinas and H. Weintrau, Proc. Natl. Acad. Sci. U. S. A., 1983, 80, 4389 CrossRef CAS.
- A. Rich and S. Zhang, Nat. Rev. Genet., 2003, 7, 566 CrossRef PubMed.
- L. Haque, A. B. Pradhan, S. Bhuiya and S. Das, J. Lumin., 2016, 173, 44 CrossRef CAS.
- A. B. Pradhan, L. Haque, S. Bhuiya, A. Ganguly and S. Das, J. Phys. Chem. B, 2015, 119, 6916 CrossRef CAS PubMed.
- L. Li, D. von Kessler, P. A. Beachy and K. S. Matthews, Biochemistry, 1996, 35, 9832 CrossRef CAS PubMed.
- D. Pozzi, P. A. Faggioni, C. Zompetta, I. De-kos, S. Lio, A. Lisi, G. Ravagnan, L. Frati and S. Grimaldi, Intervirology, 1992, 33, 215 CrossRef PubMed.
- J. S. Colins, Agents Actions Spec., 1992, C4, 47 CrossRef.
- J. W. Foster, CRC Crit. Rev. Microbiol., 1995, 21, 215 CrossRef CAS PubMed.
- E. W. Hicky and I. N. Hirshfield, Appl. Environ. Microbiol., 1990, 56, 1038 Search PubMed.
- G. J. Puppels, C. Otto, C. Greve, M. Robert-Nicoud, D. J. Arndt-Jovin and T. M. Jovin, Biochemistry, 1994, 33, 3386 CrossRef CAS PubMed.
- C. H. Zimmer, G. Luck, H. Venner and J. Fric, Biopolymers, 1968, 6, 563 CrossRef CAS PubMed.
- W. Guschlbauer and Y. Csourtois, FEBS Lett., 1968, 1, 183 CrossRef CAS PubMed.
- T. O’Connor, S. Mansy, M. Bina, D. R. Mcmillan, M. A. Bruck and R. S. Tobias, Biophys. Chem., 1981, 15, 53 CrossRef.
- K. Hoogsteen, Acta Crystallogr., 1963, 16, 907 CrossRef CAS.
- Y. Courtois, P. Fromaeot and W. Guschlbauer, Eur. J. Biochem., 1968, 6, 493 CrossRef CAS PubMed.
- Y. Podolyan, L. Gorb and J. Leszczynski, J. Phys. Chem. A, 2000, 104, 7346 CrossRef CAS.
- H. A. Tajmir-Riahi, J. F. Neault and M. Naoui, FEBS Lett., 1995, 370, 105 CrossRef CAS PubMed.
- M. D. Frank-Kamenetskii, Protonated DNA Structures, in Nucleic Acids and Molecular Biology 4, ed. F. Eckstein and D. M. J. Lilley, Springer, Berlin, Heidelberg, 1990 Search PubMed.
- S. Das, G. S. Kumar and M. Maiti, Biophys. Chem., 1999, 76, 199 CrossRef CAS PubMed.
- K. Bhadra, G. S. Kumar, S. Das, M. Islam and M. Maiti, Bioorg. Med. Chem., 2005, 13, 4851 CrossRef CAS PubMed.
- C. V. Kumar and E. H. Asuncion, J. Am. Chem. Soc., 1993, 115, 8547 CrossRef CAS.
- M. L. Neuhouser, Nutr. Cancer, 2004, 50, 1 CrossRef CAS PubMed.
- M. Katan, Am. J. Clin. Nutr., 1997, 65, 1542 CrossRef CAS PubMed.
- E. Middleton, C. Kandaswami and T. C. Theoharides, Pharmacol. Rev., 2000, 52, 673 CAS.
- G. R. Pettit, M. S. Hoard, D. L. Doubek, J. M. Schmidt, R. K. Pettit, L. P. Tackett and J. C. Chapuis, J. Ethnopharmacol., 1996, 53, 57 CrossRef CAS PubMed.
- S. F. Nabavi, N. Braidy, O. Gortzi, E. Sobarzo-Sanchez, M. Daglia, K. Skalicka-Woźniak and S. M. Nabavi, Brain Res. Bull., 2015, 119, 1 CrossRef CAS PubMed.
- J. S. Kim and C. Jobin, Immunology, 2005, 115, 375 CrossRef CAS PubMed.
- J. K. Lee, S. Y. Kim, Y. S. Kim, W. H. Lee, D. H. Hwang and J. Y. Lee, Biochem. Pharmacol., 2009, 77, 1391 CrossRef CAS PubMed.
- Z. Weng, A. B. Patel, S. Panagiotidou and T. C. Theoharides, J. Allergy Clin. Immunol., 2015, 135, 1044 CrossRef CAS PubMed.
- S. Zhang, B. Ling, F. Qu and X. Sun, Spectrochim. Acta, Part A, 2012, 97, 521 CrossRef CAS PubMed.
- N. Zou, X. Wang and G. Li, J. Solid State Electrochem., 2016, 20, 1775 CrossRef CAS.
- V. Mary, P. Haris, M. K. Varghese, P. Aparna and C. Sudarsanakumar, J. Chem. Inf. Model., 2017, 57, 2237 CrossRef CAS PubMed.
- S. Das and G. S. Kumar, J. Mol. Struct., 2008, 872, 56 CrossRef CAS.
- G. Scatchard, Ann. N. Y. Acad. Sci., 1949, 51, 660 CrossRef CAS.
- J. D. McGhee and P. H. von Hippel, J. Mol. Biol., 1974, 86, 469 CrossRef CAS PubMed.
- P. Job, Ann. Chim. Appl., 1928, 9, 113 CAS.
- R. Lakowicz, Principles of Fluorescence Spectroscopy, Plenum Press, New York, 2006 Search PubMed.
- A. Larsson, C. Carlsson, M. Jonsson and B. Albinsson, J. Am. Chem. Soc., 1994, 116, 8459 CrossRef CAS.
- G. S. Kumar, S. Das, K. Bhadra and M. Maiti, Bioorg. Med. Chem., 2003, 11, 4861 CrossRef CAS PubMed.
- N. K. Janjuaa, A. Siddiqa, A. Yaquba, S. Sabahat, R. Qureshi and S. U. Haque, Spectrochim. Acta, Part A, 2009, 74, 1135 CrossRef PubMed.
- A. A. Jamali, A. Tavakoli and J. E. N. Dolatabadi, Eur. Food Res. Technol., 2012, 235, 367 CrossRef CAS.
- G. Favaro, C. Clementi, A. Romani and V. Vickackaite, J. Fluoresc., 2007, 17, 707 CrossRef CAS PubMed.
- G. M. Blackburn and M. J. Gait, Nucleic Acids in Chemistry and Biology, Oxford University Press, Oxford, 1996 Search PubMed.
- M. D. Frank-Kamenetski, Methods Enzymol., 1992, 211, 180 Search PubMed.
- V. I. Ivanov, L. E. Minchenkova, A. K. Schyolkina and A. I. Poletayer, Biopolymers, 1973, 12, 89 CrossRef CAS PubMed.
- P. Lincoln, E. Tuite and B. Norden, J. Am. Chem. Soc., 1997, 119, 1454 CrossRef CAS.
- G. D. Fasman, Circular Dichroism and Conformational Analysis of Biomolecules, Plenum Press, New York, 1996, p. 413 Search PubMed.
- P. U. Maheswari and M. Palaniandavar, J. Inorg. Biochem., 2004, 98, 219 CrossRef.
- A. Rajendran and B. U. Nair, Biochim. Biophys. Acta, 2006, 1760, 1794 CrossRef CAS PubMed.
- L. S. Lerman, J. Mol. Biol., 1961, 3, 18 CrossRef CAS PubMed.
- G. Cohen and H. Eisenberg, Biopolymers, 1969, 8, 45 CrossRef CAS.
- A. B. Pradhan, S. Das, L. Haque, S. Bhuiya and S. Das, J. Lumin., 2016, 169, 277 CrossRef CAS.
- C. V. Kumar, R. S. Turner and E. H. Asuncion, J. Photochem. Photobiol., A, 1993, 74, 231 CrossRef CAS.
- F. Arjmand and I. Yousuf, J. Organomet. Chem., 2013, 743, 55 CrossRef CAS.
| This journal is © The Royal Society of Chemistry and the Centre National de la Recherche Scientifique 2019 |


