A chemiluminescence resonance energy transfer for the determination of indolyl acetic acid using luminescent nitrogen-doped carbon dots as acceptors
Yan
Liu
and
Suqin
Han
 *
*
School of Chemistry and Material Science, Shanxi Normal University, Linfen 041004, Shanxi, P. R. China. E-mail: hsq@sxnu.edu.cn
First published on 20th November 2017
Abstract
A chemiluminescence resonance energy transfer (CRET) method was fabricated for the determination of indolyl acetic acid (IAA) by using Ce(IV)–Na2SO3 in a chemiluminescence (CL) reaction as the donor and luminescent nitrogen-doped carbon dots (N-CDs) as the acceptor. The CL intensity from the redox reaction of Ce(IV) and Na2SO3 in acidic medium increased significantly in the presence of N-CDs because the absorption band of N-CDs perfectly overlapped with the luminescence spectra of excited SO2 from the reaction of Ce(IV)–Na2SO3. Further, IAA was observed to inhibit the CL signal of the N-CDs–Ce(IV)–Na2SO3 system, which made it applicable for the determination of IAA. The linear range was 2.0 × 10⁻⁸–1.0 × 10⁻⁶ mol L−1 and the detection limit was 5.6 × 10⁻⁹ mol L−1. This work is not only of importance for gaining a better understanding of the unique optical and physical chemistry properties of doping carbon dots with heteroatoms but also has great potential to find CL applications in many fields.
1. Introduction
Indolyl-acetic acid (IAA) plays an important role in coordinating plant growth and development as a plant growth hormone. It is also commonly used as a pesticide and may be introduced into environmental water.1 IAA presents acute toxic effects, such as irritation of eyes, the respiratory system and skin.2 Several analytical methods including spectrofluorimetry (FL),2 sensors,3 electrochemistry,4 chemiluminescence(CL),5,6 high performance liquid chromatography (HPLC)7 and capillary electrochromatography (CEC)8 have been used for the determination of IAA.Carbon dots (CDs) have attracted tremendous attention owing to their fascinating properties such as unique optical properties, good biocompatibility, low toxicity, great aqueous stability, facile synthesis, etc.9 CDs can be obtained using different procedures either using chemical bottom up or top down synthesis methods such as the electrochemical process, combustion, the hydrothermal process, acidic oxidation, microwave and ultrasonic processing, and laser ablation. An easy synthesis method and interesting luminescence properties make CDs gain a wide range of analytical applications.10 However, the surface chemical structure and poor optical characteristics, particularly intrinsic low emission efficiency of the CDs, limit their practical application.11 Doping a heteroatom is an excellent method to modify the intrinsic properties of CDs including optical characteristics, surface and local chemical features.12 A nitrogen (N) atom has a comparable atomic size and five valence electrons for bonding with a carbon atom, and doping CDs with electron-rich N atoms can drastically alter their electronic characteristics and offer more active sites, thus producing new phenomena and unexpected properties. Recent research revealed N-doping caused significant enhancement on the quantum yield of CDs due to quantum confinement and edge effect of the N atom. Nowadays, nitrogen-doped carbon dots (N-CDs) have been widely used in the fields of molecule and ion detection,13,14 biomedical sensors and photocatalysts15,16 because of their excellent luminous properties, light stability, and photoelectric physical properties. The inherent virtues of N-CDs stimulate exploration of their possible applications in CL,17–20 since they are superior to the traditional inorganic nanomaterials.
CL is generally defined as the emission of light as a result of a chemical reaction without using an external light source and has been widely applied to various fields due to its high sensitivity, wide dynamic range, simplicity and low cost.21 Chemiluminescence resonance energy transfer (CRET) is nonradiative energy transfer from a chemiluminescent donor to a suitable acceptor. It is a powerful technique for probing very small changes in the distance between the CL donor and the acceptor. Since no external light source is used for excitation in CRET, non-specific signals caused by external light excitation could be minimized. This makes CRET an attractive light-measuring scheme in bioassays.22 Currently, CRET modes are used for the assays of biomolecules,23–26 small molecules27 and ions.28
The redox reaction between Ce(IV) and Na2SO3 is known to produce a weak CL signal for the low luminescence efficiency of emitting species. Excited sulfur dioxide (SO2*) has been proposed as the emitting species and emits radiation in the spectral region 300–450 nm.29,30 In this study, the weak CL reaction of Ce(IV) and Na2SO3 was used as a model system, the N-CDs was used as a sensitizing reagent, and the CRET method was applied to explore the CL status and determine IAA. The N-CDs could remarkably enhance the CL signal of the Ce(IV)–Na2SO3 system based on CRET, and IAA had the diminishing effect on the N-CDs enhanced Ce(IV)–Na2SO3 CL system. The decreasing CL signal was directly proportional to the concentration of IAA. So a new CL method has been established for the analysis of trace levels of IAA in environmental water samples.
2. Experimental
2.1. Reagents and solutions
The analytical grade chemical reagents were used, and deionized water was used to prepare all solutions. Ascorbic acid, ammonia and 2(NH4)2SO4·Ce(SO4)2·4H2O were obtained from Tianjin Chemical Reagents Company (Tianjin, China). Na2SO3 and H2SO4 were purchased from Luoyang Chemical Reagent Company (Luoyang, China). IAA was obtained from Beijing Chemical Reagents Company (Beijing, China). Ce(IV) solution (1.0 × 10⁻² mol L−1) was prepared in dilute H2SO4 solution. The stock solution of 1.0 × 10⁻³ mol L−1 IAA was prepared by dissolving a certain amount of IAA in a small amount acetone and diluting to 50 mL with water, and further lower concentration solutions were prepared by stepwise dilution of the stock solution.2.2. Apparatus
CL measurements were carried out using a BPCL ultra weak CL analyzer (Institute of Biophysics, Chinese Academy of Science, Beijing, China) equipped with an IFIS-C intelligent flow injection sampler (Xi'an Remax Analytical Instrument Co. Ltd, Shanxi, China). The sizes and morphologies of the as-synthesized N-CDs were measured using a JEM-2100 transmission electron microscope (TEM, JEOL, Japan). UV-vis absorption spectra were performed using a Cary 5000 spectrophotometer (Varian, USA). The fluorescence (FL) spectra were collected using a Cary Eclipse spectrofluorometer (Varian, USA).2.3. Preparation of N-CDs
N-CDs were synthesized by a simple ultrasonic approach following a general procedure described in previous work.31 In 100 mL of water, 1.23 g of ascorbic acid was added, and then 40 mL of ammonia was injected slowly under stirring. After ultrasonicating for 12 h at 50 °C, a brown color N-CD solution was formed. The as-prepared N-CD solution was purified by stirring and heating properly to remove superfluous ammonia, centrifugation and filtering to remove other impurities. The N-CD solution was stored at 4 °C. The concentration of N-CDs was expressed as volume ratio of N-CD solution to water (v/v).2.4. General procedure
The schematic diagram of the flow injection (FI)-CL system is shown in Fig. 1. N-CDs and Na2SO3 were delivered using the peristaltic pump P1 at a flow rate of 1.7 mL min−1. The peristaltic pump P2 was used to deliver water (carrier), IAA standard/sample solutions and Ce(IV) in H2SO4 at a flow rate of 2.4 mL min−1. The N-CD solution was mixed with Na2SO3 solution at the three-way channel, and then was injected into an eight way valve which was equipped with a 60 μL sample loop, merged with IAA stream. Finally the mixed solution and Ce(IV) in H2SO4 were delivered into the flow cell installed in front of the photomultiplier tube (PMT), producing CL emission. The signal was imported to the computer for data acquisition.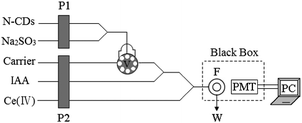 | ||
| Fig. 1 Schematic diagram of the FI-CL system. P1, P2: peristaltic pump; V: injection valve; F: CL flow-cell; W: waste solution; PMT: photomultiplier tube; high voltage: −600 V. | ||
3. Results and discussion
3.1. Characterizations of N-CDs
The TEM image showed that the as-prepared N-CDs were nearly spherical in morphology with a narrow size distribution of 3.0–5.0 nm diameter (Fig. 2A). Fig. 2B shows the UV-vis absorption and FL spectra of N-CDs excited at different excitation wavelengths. The peak at 267 nm represented the absorption of an aromatic series and belonged to the π–π* transition of C![[double bond, length as m-dash]](https://www.rsc.org/images/entities/char_e001.gif) C, and another peak at 310 nm was ascribed to the n–π* transition of C
C, and another peak at 310 nm was ascribed to the n–π* transition of C![[double bond, length as m-dash]](https://www.rsc.org/images/entities/char_e001.gif) O. The maximum FL emission (∼460 nm) was obtained with an excitation wavelength of 385 nm and the emission shifted with the increased excitation wavelength, which revealed a distribution of the different surface energy traps of the N-CDs.31,32 The FT-IR spectrum of the N-CDs is shown in Fig. 2C, in which O–H, N–H and C
O. The maximum FL emission (∼460 nm) was obtained with an excitation wavelength of 385 nm and the emission shifted with the increased excitation wavelength, which revealed a distribution of the different surface energy traps of the N-CDs.31,32 The FT-IR spectrum of the N-CDs is shown in Fig. 2C, in which O–H, N–H and C![[double bond, length as m-dash]](https://www.rsc.org/images/entities/char_e001.gif) O bonds are located at 3000–3200 cm−1 and 1682 cm−1, the C
O bonds are located at 3000–3200 cm−1 and 1682 cm−1, the C![[double bond, length as m-dash]](https://www.rsc.org/images/entities/char_e001.gif) C stretching vibration was at 1611 cm−1, the C
C stretching vibration was at 1611 cm−1, the C![[double bond, length as m-dash]](https://www.rsc.org/images/entities/char_e001.gif) N vibration in an aromatic ring and C–O–C vibration in the epoxy group were also observed at 1399 cm−1, 1318 cm−1 and 1075 cm−1. The carboxylate and hydroxyl groups on the surface of N-CDs are beneficial for their good solubility and more active sites in water.
N vibration in an aromatic ring and C–O–C vibration in the epoxy group were also observed at 1399 cm−1, 1318 cm−1 and 1075 cm−1. The carboxylate and hydroxyl groups on the surface of N-CDs are beneficial for their good solubility and more active sites in water.
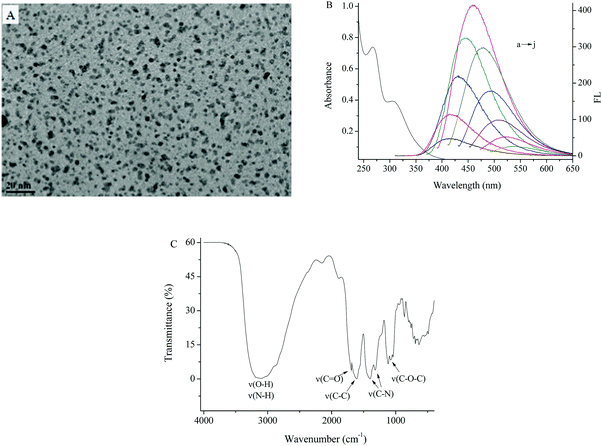 | ||
| Fig. 2 (A) TEM image, (B) UV-vis and FL spectra excited at wavelengths of 305–485 nm, with increments of 20 nm (a–j), and (C) FT-IR spectrum of the N-CDs. | ||
3.2. Effect of ultrasonic reaction conditions on CL
In order to investigate the effect of the synthetic conditions of N-CDs on the CL response of N-CDs–Ce(IV)–Na2SO3 reaction, solutions of N-CDs with different reaction times and temperatures were prepared. As can be seen in Fig. 3, the CL intensity of N-CDs–Ce(IV)–Na2SO3 increased with the reaction time for a fixed reaction temperature (50 °C), and reached a maximum when the reaction time was 12 h, and it caused about a 10-fold increase in the CL intensity of the original reaction. Raising the temperature was helpful for the rapid generation of N-CDs, but when the temperature was too high, there was no improvement in the CL performance. This may be attributed to the unique surface structure of the N-CDs (50 °C, 12 h). So, N-CDs prepared at 50 °C for 12 h were selected as the enhancer of the Ce(IV)–Na2SO3 system in subsequent experiments.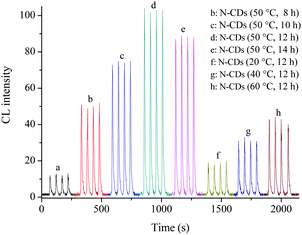 | ||
| Fig. 3 Effect of preparation conditions of N-CDs on CL intensity. (a) Ce(IV)–Na2SO3; (b–h) Ce(IV)–Na2SO3–N-CDs (among N-CDs synthesized with different times and temperatures). | ||
3.3. CL reaction sensitized by N-CDs
The mixing orders of the reagent solutions were evaluated in static mode, and three mixing orders including injecting Na2SO3 into N-CDs–Ce(IV), N-CDs into Ce(IV)–Na2SO3, and Ce(IV) into N-CDs–Na2SO3 are studied in Table 1. The highest intensity was achieved when Ce(IV) was injected to the mixture of N-CDs and Na2SO3, and this mode was used in the subsequent experiment. The CL intensity and the rate of different systems are also presented in Table 1. The N-CDs enhanced considerably the CL intensity of Ce(IV)–Na2SO3, which could improve the luminescence efficiency and the sensitivity of Ce(IV)–Na2SO3 for analytical application. There was great inhibition of IAA on the N-CDs-enhanced Ce(IV)–Na2SO3 CL, which was suitable for the determination of IAA. The quick reaction rate was suitable for FI-CL analytical mode.3.4. Optimization of analytical conditions
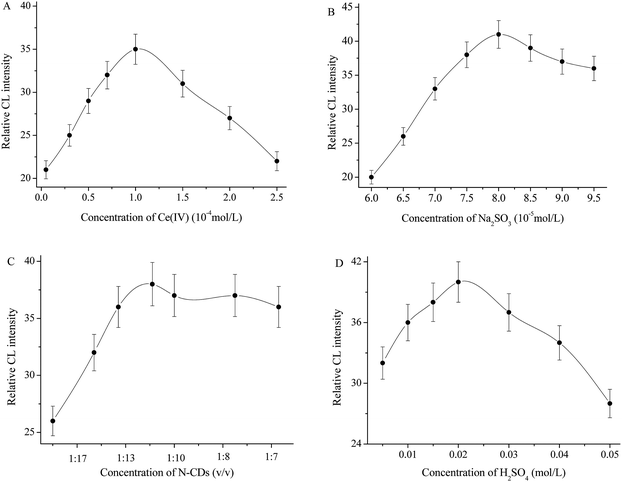
The effect of Ce(IV) concentration was studied on the response of the resulting N-CDs enhanced CL system to IAA (Fig. 4A); the maximum relative CL signal was obtained at 1.0 × 10⁻⁴ mol L−1 Ce(IV). Above or below this concentration, the CL intensity decreased dramatically. Therefore, 1.0 × 10⁻⁴ mol L−1 Ce(IV) was chosen for the subsequent experiment. The influence of Na2SO3 concentration was examined (Fig. 4B). The CL intensity increased with Na2SO3 concentration and reached a maximum value at 8.0 × 10⁻⁵ mol L−1, above which the CL intensity decreased gradually. Therefore 8.0 × 10⁻⁵ mol L−1 Na2SO3 has been selected as the optimum concentration. The effect of N-CDs concentration on the CL intensity was examined in the volume ratio range of 1![[thin space (1/6-em)]](https://www.rsc.org/images/entities/char_2009.gif) :
:![[thin space (1/6-em)]](https://www.rsc.org/images/entities/char_2009.gif) 20 to 1
20 to 1![[thin space (1/6-em)]](https://www.rsc.org/images/entities/char_2009.gif) :
:![[thin space (1/6-em)]](https://www.rsc.org/images/entities/char_2009.gif) 7 (v/v) (Fig. 4C). The best response was observed at 1
7 (v/v) (Fig. 4C). The best response was observed at 1![[thin space (1/6-em)]](https://www.rsc.org/images/entities/char_2009.gif) :
:![[thin space (1/6-em)]](https://www.rsc.org/images/entities/char_2009.gif) 11 (v/v), after that the CL signal decreased slightly. So 1
11 (v/v), after that the CL signal decreased slightly. So 1![[thin space (1/6-em)]](https://www.rsc.org/images/entities/char_2009.gif) :
:![[thin space (1/6-em)]](https://www.rsc.org/images/entities/char_2009.gif) 11 N-CDs was chosen as the optimum concentration. The experiment showed that 0.02 mol L−1 H2SO4 could produce the maximum CL response, but the excess H2SO4 caused an obvious decrease of the emission intensity (Fig. 4D). Thus 0.02 mol L−1 H2SO4 was selected as the optimum reaction medium and was mixed with 1.0 × 10⁻⁴ mol L−1 Ce(IV).
11 N-CDs was chosen as the optimum concentration. The experiment showed that 0.02 mol L−1 H2SO4 could produce the maximum CL response, but the excess H2SO4 caused an obvious decrease of the emission intensity (Fig. 4D). Thus 0.02 mol L−1 H2SO4 was selected as the optimum reaction medium and was mixed with 1.0 × 10⁻⁴ mol L−1 Ce(IV).
3.5. Analytical performance
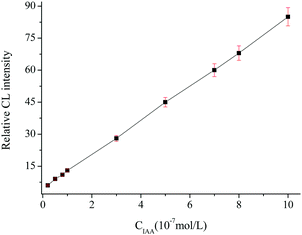
The CL signal curve with increasing amount of IAA showed that the CL intensity decreased linearly with increasing concentration, and the linear range was 2.0 × 10⁻⁸–1.0 × 10⁻⁶ mol L−1 (Fig. 5). Each point of the calibration graph corresponded to the mean value obtained from three independent measurements. The regression equation was ΔI = 8.00C (10−7 mol L−1) + 4.61 (R = 0.9985), where ΔI was the difference of the CL signal between the blank and the presence of IAA. The relative standard deviation (RSD) values (n = 11) for the determination of 3.0 × 10⁻⁷ mol L−1 IAA was 2.6%. The detection limit (3σ) of the method was 5.6 × 10⁻⁹ mol L−1. The result was comparable to most of those obtained from the literature methods, as shown in Table 2. The proposed method displayed a higher sensitivity and a wider linear range.| Methods | Sample | Linear ranges (mol L−1) | Detection limit (mol L−1) | Ref. |
|---|---|---|---|---|
| FL | Water | 2.85 × 10⁻⁸–3.43 × 10⁻⁶ | 5.71 × 10⁻¹¹ | 2 |
| Sensor | — | 1.0 × 10⁻³–0.1 | — | 3 |
| EC | Soil | 1.3 × 10⁻⁶–9.47 × 10⁻⁵ | 1.48 × 10⁻⁷ | 4 |
| CL | Water | 2.85 × 10⁻⁶–8.56 × 10⁻⁵ | 5.71 × 10⁻⁷ | 5 |
| CL | Biological fluids, soil | 1.0 × 10⁻⁸–1.0 × 10⁻⁵ | 1.0 × 10⁻⁹ | 6 |
| HPLC | Plant | 2.85 × 10⁻⁵–1.14 × 10⁻³ | 1.26 × 10⁻⁵ | 7 |
| CEC | Culture media | — | 1.01 × 10⁻⁶ | 8 |
| The method | Water | 2 × 10⁻⁸–1 × 10⁻⁶ | 5.6 × 10⁻⁹ |
3.6. Interferences
The effect of some species commonly found in water samples was investigated on the determination of 3.0 × 10⁻⁷ mol L−1 IAA. The tolerable concentration ratio for foreign species was taken as the largest amount yielding a relative error less than 5% and the results demonstrated that 1000-fold for Na+, K+, Ca2+, Cl−, Ba2+, NH4+, Al3+, SO42−, NO3−, CO32−, HCO3−, acetone, methanol, alcohol, glucose, sucrose, starch; 500-fold for Mg2+, CH3COO−, HPO42−, Br−, benzoic acid, EDTA; 100-fold for Ni2+, Co2+, Pb2+, Hg2+, Fe2+, Cd2+, C2O42−, ortho-hydroxybenzoic acid, carbamide, ascorbic acid; 50-fold for Mn2+, Fe3+, S2O32−, NO2−, resorcinol; 20-fold for catechol, hydroquinone, phenol; 5-fold for Cu2+. The amounts of most of the potentially interfering species in water samples were below their tolerable levels. To eliminate the possible interferences from metal ions, ethylene diamine tetraacetic acid (EDTA) was used as a masking reagent. Thus, it could be concluded that the proposed CL method presented high selectivity for the determination of IAA in water samples.3.7. Application
Under the optimum conditions, the proposed method has been applied for the determination of IAA in water and mungbean sprout samples. Fresh water samples were collected and filtered through a 0.45 μm membrane. Then 1.5 mL of 1.0 × 10⁻⁴ mol L−1 EDTA was added to 10 mL of lake water and tap water, respectively. Recovery tests were performed to evaluate the accuracy of this method. The mungbean sprout was purchased from the market. 200 g of mungbean sprouts were ground into homogenate, and then was set into a flask and mixed with IAA standard solutions. Ultrasonic extraction was performed in acetone three times after allowing to stand for 1 h for ultrasonic treatment. Distilled water was added for analysis after acetone was collected and evaporated to dryness. Mungbean sprouts without IAA standard solutions were regarded as the blank sample. As summarized in Table 3, the recoveries were found to be in the range of 97.5–103.3% for water and mungbean sprout samples, which indicated that the developed method was simple, sensitive and afforded good precision and accuracy when applied for the determination of IAA in real samples.| Sample | Amount | Added (10−7 mol L−1) | Found (10−7 mol L−1) | Recovery (%) |
|---|---|---|---|---|
| Lake water | 0.048 mg L−1 | 0 | 2.74 ± 0.02 | — |
| 2.0 | 4.69 ± 0.06 | 97.5 | ||
| 4.0 | 6.87 ± 0.05 | 103.3 | ||
| Tap water | Not detected | 1.0 | 1.02 ± 0.03 | 102.0 |
| 2.0 | 1.97 ± 0.05 | 98.5 | ||
| Mungbean sprout | Not detected | 1.0 | 0.975 ± 0.03 | 97.5 |
| 2.0 | 2.00 ± 0.05 | 100.0 | ||
3.8. Possible CL reaction mechanism
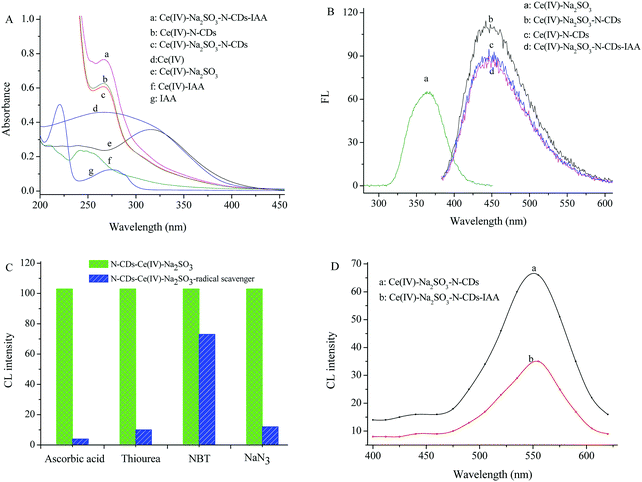
The UV-vis spectra and FL spectra are shown in Fig. 6A and B. From Fig. 6A, it is observed that the reaction occurred between Ce(IV) and Na2SO3, Ce(IV) and IAA, Ce(IV) and N-CDs, respectively. In the N-CDs–Ce(IV)–Na2SO3 system, the absorption peak of N-CDs at 310 nm disappeared, and in the N-CDs–Ce(IV)–Na2SO3–IAA system, the absorption peak of IAA at 280 nm was not present, which showed that N-CDs and IAA were involved in the corresponding reaction. In Fig. 6B, the emission peak of the Ce(IV)–Na2SO3 system occurred at about 360 nm, after adding N-CDs to the Ce(IV)–Na2SO3 system, an emission band located at around 460 nm was observed. These showed the different luminophores in both the Ce(IV)–Na2SO3 system and the N-CDs–Ce(IV)–Na2SO3 system. The systems of N-CDs–Ce(IV)–Na2SO3 and N-CDs–Ce(IV)–Na2SO3–IAA shared the same luminophores with the N-CDs–Ce(IV) system.Fig. 6C showed the effect of radical scavengers33,34 on the CL of the N-CDs–Ce(IV)–Na2SO3 system. 1.0 × 10⁻⁴ mol L−1 ascorbic acid could decrease the CL intensity by 95%, which indicated the generation of free radicals in the CL reaction. As an effective radical scavenger for a hydroxyl radical (˙OH), 1.0 × 10⁻⁴ mol L−1 thiourea could strongly inhibit the CL intensity. Production of superoxide anion radicals (˙O2−) could be identified by 1.0 × 10⁻⁴ mol L−1 nitro blue tetrazolium chloride (NBT). In addition, the existence of singlet oxygen (1O2) was also confirmed by 1.0 × 10⁻⁴ mol L−1 NaN3.
The CL spectra were investigated using high-energy cut off filters (Fig. 6D). It's hard to detect the CL signal from the reaction of Ce(IV) and Na2SO3. After adding N-CDs to the Ce(IV)–Na2SO3 system, the CL intensity increased significantly, and the CL spectra exhibited a peak maximum at 550 nm, a significant red shift compared with the maximum FL emission (460 nm) of the N-CDs. This may be due to smaller energy separation of the N-CD surface state for the CL emission than the band gap of the N-CD core for the most intense FL emission.19,35,36 Therefore, excited N-CDs (N-CDs*) should act as the emitting species.37 Moreover, the CL intensity was markedly inhibited by IAA and the maximum emission wavelength was still 550 nm, which indicated there was no new emitter produced and the emitter was still N-CDs* in the Ce(IV)–Na2SO3–N-CDs–IAA system.
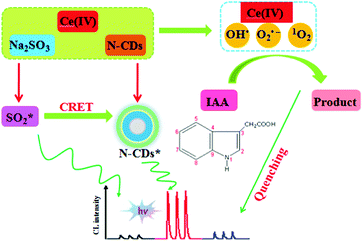
The CL emission of the oxidation of Ce(IV) and Na2SO3 in acidic solution has been attributed to the formation of SO2* molecules which radiate during deexcitation.29,30 Since the luminescence efficiency of SO2* is low, its CL intensity is so weak that we could not obtain its CL spectrum. SO2* can also act as the CL donors and transfer its energy to a fluorescent compound which then produces an enhanced CL emission. The CL emission spectrum of SO2* (300–450 nm) overlaps well with the excitation wavelength of the sensitizer N-CDs. Theoretically, there is a possibility that a CRET between SO2* as donors and N-CDs as acceptors occurred, leading to the production of the N-CDs* and an increase in the CL intensity.37 Our previous study showed that Ce(IV) could inject holes into the N-CDs to produce oxidized-state N-CDs (N-CDs˙+).32,38 At the same time, an electron could be injected by HSO3˙ from the oxidization product of HSO3− by Ce(IV) into the N-CDs to produce reduced-state N-CDs (N-CDs˙−).39 As a result, recombination of electron–hole pairs could produce excitons, then CL emission occurred with N-CDs* returning to their ground state.
From Fig. 5A, the absorption peak of N-CDs at 310 nm disappeared in the N-CDs–Ce(IV)–Na2SO3 system, and in the N-CDs–Ce(IV)–Na2SO3–IAA system, the absorption peak of IAA at 280 nm was not present. These results may indicate that N-CDs and IAA were involved in the complex formation with Ce(IV). Due to the coordination complex formation between Ce(IV) and N-CDs, the distance is suitable for CRET between the donor and the acceptor. Upon the addition of IAA, the competition for Ce(IV) from the complex may result in the unsuitable distance for CRET and a decrease in the CL intensity. The possible CL reaction mechanism is briefly illustrated in Scheme 1.
4. Conclusions
In this study, N-CDs could enhance the ultraweak CL reaction of Ce(IV) and Na2SO3 based on CRET. Upon the addition of IAA, the competition for Ce(IV) from the complex may result in the unsuitable distance for CRET and a decrease in the CL intensity. Thus a sensitive, simple, and straightforward CL method for IAA was developed. The established method has been successfully applied for the determination of IAA in water and mungbean sprout samples with good recovery and high reproducibility. We hope the investigation of the CL mechanism of the N-CDs will be valuable both for the understanding of these versatile materials and for the acceleration of the use of an ultraweak CL system in analytical fields.Conflicts of interest
There are no conflicts to declare.Acknowledgements
This work was financially supported by the Natural Science Foundation of Shanxi (Grant No. 2013011013-3), National Undergraduate Training Programs for Innovation and Entrepreneurship (201610118003).References
- M. Qamar and M. Muneer, J. Hazard. Mater., 2005, 120, 219–227 CrossRef CAS PubMed.
- J. M. Calatayud, J. G. de Ascenção and J. R. Albert-García, J. Fluoresc., 2006, 16, 61–67 CrossRef CAS PubMed.
- Y. Liu, H. T. Dong, W. Z. Zhang, Z. Q. Ye, G. L. Wang and J. L. Yuan, Biosens. Bioelectron., 2010, 25, 2375–2378 CrossRef CAS PubMed.
- R. A. De Toledo and C. M. P. Vaz, Microchem. J., 2007, 86, 161–165 CrossRef CAS.
- A. I. P. Neves, J. R. Albert-García and J. M. Calatayud, Talanta, 2007, 71, 318–323 CrossRef PubMed.
- S. Q. Han, Microchim. Acta, 2010, 168, 169–175 CrossRef CAS.
- S. J. Hou, J. Zhu, M. Y. Ding and G. H. Lv, Talanta, 2008, 76, 798–802 CrossRef CAS PubMed.
- X. B. Yin and D. Y. Liu, J. Chromatogr. A, 2008, 1212, 130–136 CrossRef CAS PubMed.
- S. Y. Lim, W. Shen and Z. Q. Gao, Chem. Soc. Rev., 2015, 44, 362–381 RSC.
- I. Y. Goryacheva, A. V. Sapelkin and G. B. Sukhorukov, Trends Anal. Chem., 2017, 90, 27–37 CrossRef CAS.
- H. J. Zhang, Y. L. Chen, M. J. Liang, L. F. Xu, S. D. Qi, H. L. Chen and X. G. Chen, Anal. Chem., 2014, 86, 9846–9852 CrossRef CAS PubMed.
- Z. L. Wu, P. Zhang, M. X. Gao, C. F. Liu, W. Wang, F. Lenga and C. Z. Huang, J. Mater. Chem. B, 2013, 1, 2868–2873 RSC.
- Z. Y. Yan, X. C. Qu, Q. Q. Niu, C. Q. Tian, C. J. Fan and B. F. Ye, Anal. Methods, 2016, 8, 1565–1571 RSC.
- X. L. Wu, Y. Song, X. Yan, C. Z. Zhu, Y. Q. Ma, D. Du and Y. H. Lin, Biosens. Bioelectron., 2017, 94, 292–297 CrossRef CAS PubMed.
- V. Borse, M. Thakur, S. Sengupta and R. Srivastava, Sens. Actuators, B, 2017, 248, 481–492 CrossRef CAS.
- V. Arul, T. N. J. I. Edison, Y. R. Lee and M. G. Sethuraman, J. Photochem. Photobiol., B, 2017, 168, 142–148 CrossRef CAS PubMed.
- H. Abdolmohammad-Zadeh and E. Rahimpour, Sens. Actuators, B, 2016, 225, 258–266 CrossRef CAS.
- X. Q. Fan, Y. Feng, Y. Y. Su, L. C. Zhang and Y. Lv, RSC Adv., 2015, 5, 55158–55164 RSC.
- Y. R. Tang, Y. Y. Su, N. Yang, L. C. Zhang and Y. Lv, Anal. Chem., 2014, 86, 4528–4535 CrossRef CAS PubMed.
- S. N. A. Shah, H. F. Li and J. M. Lin, Talanta, 2016, 153, 23–30 CrossRef CAS PubMed.
- J. A. Ocaña-González, M. Ramos-Payán, R. Fernández-Torres, M. V. Navarro and M. Á. Bello-López, Talanta, 2014, 122, 214–222 CrossRef PubMed.
- X. Y. Huang and J. C. Ren, Trends Anal. Chem., 2012, 40, 77–89 CrossRef CAS.
- Z. Wang, H. Gao and Z. Fu, Analyst, 2013, 138, 6753–6758 RSC.
- S. Bi, S. Yue, W. Song and S. Zhang, Chem. Commun., 2016, 52, 12841–12844 RSC.
- H. Gao, W. Wang, Z. Wang, J. Han and Z. Fu, Anal. Chim. Acta, 2014, 819, 102–107 CrossRef CAS PubMed.
- S. Zhang, Y. Yan and S. Bi, Anal. Chem., 2009, 81, 8695–8701 CrossRef CAS.
- J. Du, Y. Wang and W. Zhang, Spectrochim. Acta, Part A, 2015, 149, 698–702 CrossRef CAS PubMed.
- X. Fan, Y. Su, D. Deng and Y. Lv, RSC Adv., 2016, 6, 76890–76896 RSC.
- J. Stauff and W. Jaeschke, Atoms. Environ., 1975, 9, 1038–1039 CrossRef CAS.
- K. Takeuchi and T. Ibusuki, Anal. Chim. Acta, 1985, 174, 359–363 CrossRef CAS.
- F. H. Wang, S. S. Wang, Z. N. Sun and H. Zhu, Fullerenes, Nanotubes, Carbon Nanostruct., 2015, 23, 769–776 CrossRef CAS.
- Z. Lin, W. Xue, H. Chen and J. M. Lin, Chem. Commun., 2012, 48, 1051–1053 RSC.
- S. Liang, L. Zhao, B. Zhao, B. Zhang and J. M. Lin, J. Phys. Chem. A, 2008, 112, 618–623 CrossRef CAS PubMed.
- W. Xue, Z. Lin, H. Chen, C. Lu and J. M. Lin, J. Phys. Chem. C, 2011, 115, 21707–21714 CAS.
- Z. F. Ding, B. M. Quinn, S. K. Haram, L. E. Pell, B. A. Korgel and A. J. Bard, Science, 2002, 296, 1293–1297 CrossRef CAS PubMed.
- J. Jiang, Y. He, S. Y. Li and H. Cui, Chem. Commun., 2012, 48, 9634–9636 RSC.
- M. Amjadi, J. L. Manzoori, T. Hallaj and M. H. Sorouraddin, Microchim. Acta, 2014, 181, 671–677 CrossRef CAS.
- Y. Liu and S. Q. Han, Food Anal. Methods, 2017, 10, 3398–3406 CrossRef.
- C. Y. Sun, B. Liu and J. H. Li, Talanta, 2008, 75, 447–454 CrossRef CAS PubMed.
| This journal is © The Royal Society of Chemistry and the Centre National de la Recherche Scientifique 2018 |


